
Measuring Discourse Bias Using Text Network Analysis
Measuring Discourse Bias Using Text Network Analysis
In this article I propose a method and a tool to measure the level of bias in discourse based on text network analysis. The measure is based on the structure of text and uses both quantitive and qualitative parameters of a text graph to identify how strongly biased it is. Therefore, it can be used by humans as well as be implemented into various APIs and AI to perform automatic bias analysis.
Bias: the Good and the Bad
Bias is commonly understood as inclination or prejudice towards a certain point of view. A discourse or text that has a bias may have a certain agenda or promote a certain ideology.
In the age of “fake news”, the rise of extreme ideologies and various misinformation techniques it is important to be able to identify the level of bias in discourse: be it social network posts, newspaper articles or political speeches.
Bias is not necessarily a bad thing. Sometimes it can make an intention stronger, push an agenda forward, make a point, persuade, dissuade and transform. Bias is an agent of change, however, when there is too much of it, bias can also be destructive. When we measure bias we measure how ideologically charged a text is, how much it wants to put forward a certain point of view. In some contexts — like fiction or highly charged political speeches — strong bias may be preferential. In some other contexts — like news or non-fiction — strong bias may reveal an agenda.
Currently there are no tools that can measure how biased a text is. Various text mining APIs categorize texts based on its content and sentiment, but there are no instruments that can measure the level of inclination towards a certain point of view in text. The instrument and the method proposed in this article can serve as the first step in this direction. The open-source online tool for text network analysis that I developed already can measure bias based on this methodology, so you are welcome to try it on your own texts and see how it works. Below I describe how the bias index works and some technical details.
Discourse Structure as a Dynamic Network
Any discourse can be represented as a network: the words are the nodes and their co-occurrences are the connections between them. The resulting graph traces the pathways of meaning circulation. We can make it more readable by aligning the clusters of nodes that are more densely connected (force-atlas algorithm) into the distinct groups marked with a specific color. We can also make the more influential nodes bigger on the graph (the nodes with the high betweenness centrality). You can read more about the technical details in this whitepaper on text network analysis.
For example, here’s a visualization of the TED talk by Julian Treasure called “How to Speak So People Will Want to Listen” made using this method. If you’re interested to look at the actual interactive graph, you can open it here.

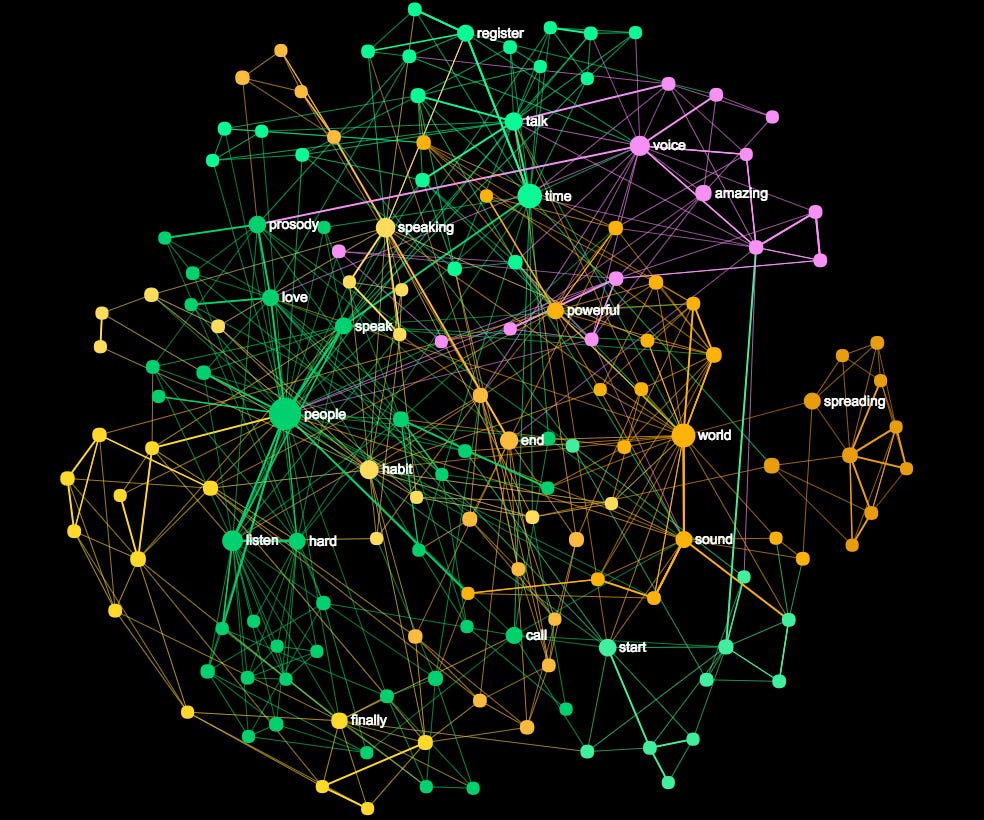
From this graph we can clearly see that the main concepts are the notions of
“people”, “time”, “world”, “listen”, “voice” etc.
These concepts are the junctions for meaning circulation in that particular discourse. They connect the different communities of nodes (designated by distinct colors).
The algorithm works in a way that emulates human perception (following the landscape reading model, the idea of semantic priming, and also the common sense): if the words are frequently mentioned in the same context, they will form a community in the graph. If they appear in different contexts, they will be pushed away from each other. If the words are frequently used to connect different contexts together, they’ll appear bigger in the graph.
As a result, the structure of a text network graph can tell us a lot about the structure of the discourse.
For example, if the graph has a pronounced community structure (several different communities of words), the discourse also has several distinct topics, which are expressed in the text. In our example we have at least 4 major topics:
people — listen — speak (dark green)time —talk —register (light green)world—sound—powerful (orange)amazing—voice (pink)
If we analyze other texts in the same way, we will see that the resulting graph structures are different. For instance, here’s a visualization of the first chapter of Quaran:

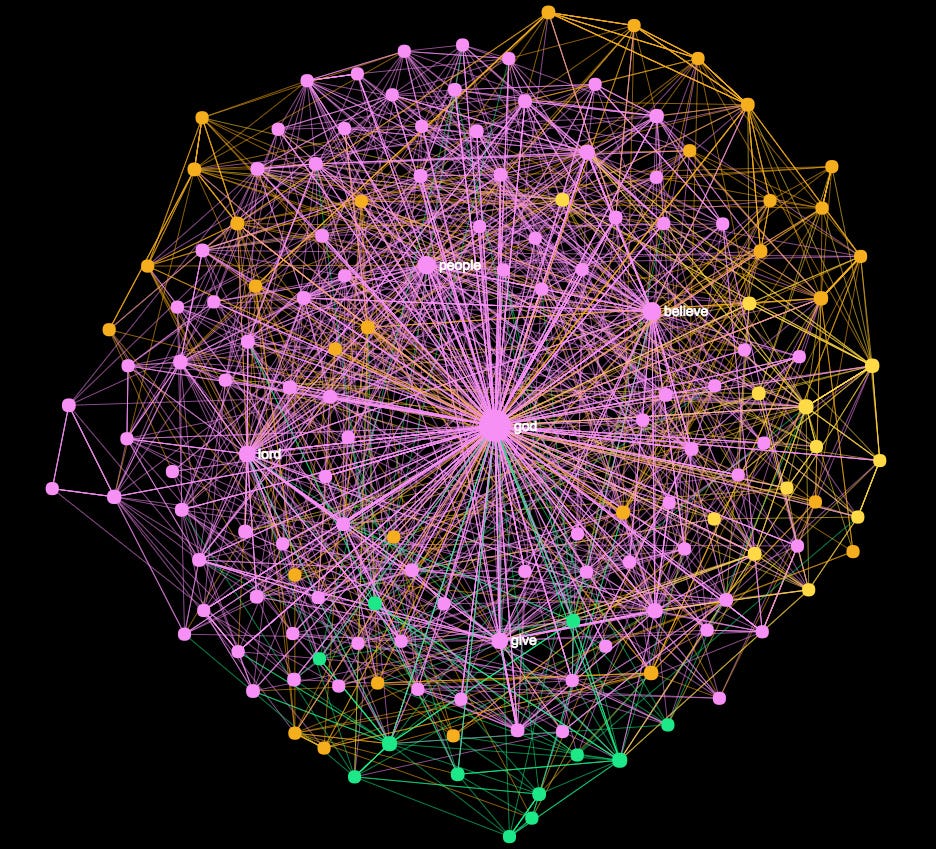
It can be seen that it has a different network structure. It is much more centralized and less diversified. There are a few main concepts:
“god”, “people”, “believe”, “lord”, “give”
and the whole discourse circulates around these concepts. All the other notions are there to support the main ones.
We performed a similar analysis with the inauguration speeches of the US presidents from 1969 to 2013 and visualized the way their narrative changed over time:

It can be seen that while the structure of the discourse stayed more or less the same over the years, while the emphasized concepts have changed with every address. This may indicate that rhetorical strategy stayed the same, while the content has transformed over the years. Obama’s speeches seem to have a higher number of distinct influential nodes, which may indicate a more diversified discourse.
Bias as a Conduit for Ideology in Networks
Now that we’ve shown how discourse can be represented as a network structure, we can discuss the notion of bias in the context of network science. We will use some ideas for epidemiology to demonstrate how network’s topology affect the speed and propagation of information across the nodes.
A network can be seen as a representation of interactions that happen over time, a diagram of traces left by a dynamic process. If we study topology of a network, we can get a lot of insights about the nature of the dynamic processes it represents.
In the context of social sciences and health care information about network structure can provide valuable insights for epidemiology: how fast a disease (a virus, an opinion or any other (mis)information) may spread, how far it may propagate, what the best immunological strategies may be.
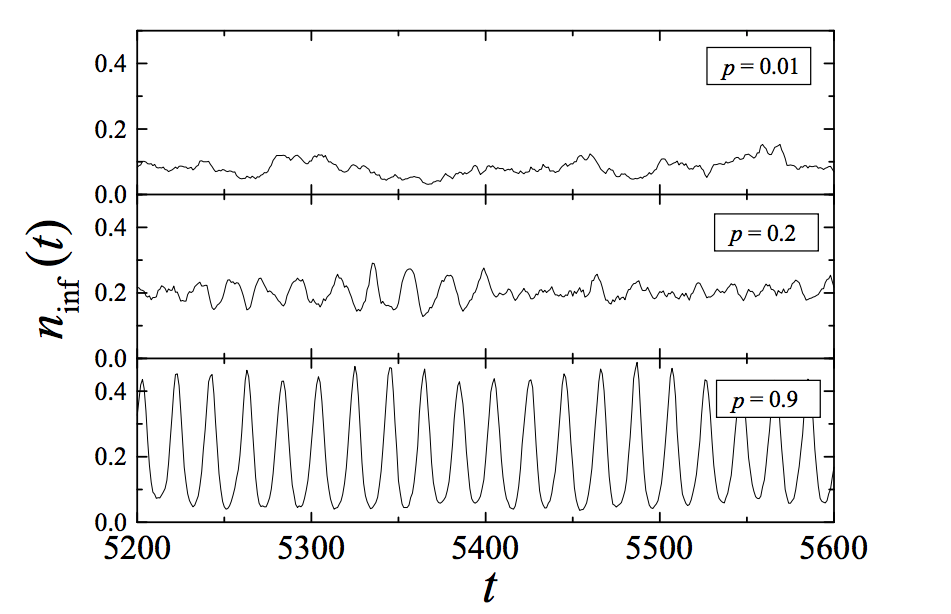
It has been demonstrated (Abramson & Kuperman 2001; PastorSatorras & Vespignani 2001) that as a network structure becomes more randomized, its epidemiological threshold decreases. Diseases, viruses, misinformation can spread faster and to a higher number of nodes. In other words, as the community structure of a network is less and less pronounced and the number of connections increase, the network propagates information to more nodes and this propagation occurs in highly pronounced oscillations (infected / not infected).

At the same time, when the community structure is pronounced while the network is relatively interconnected (small-world network), the “pockets” of nodes help maintain epidemic disease for a longer time in the network. In other words, less nodes may become infected, but the infection might stay longer (endemic state).

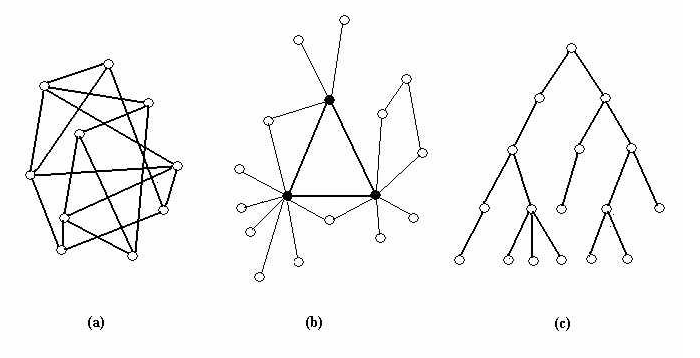
In another study performed on various social networks (Stocker, Cornforth & Bossomaier 2002) it has been shown that hierarchically flat networks (i.e. disordered) networks are not as stable as the scale-free ones (i.e. the ones that have a more pronounced community structure). In other words, hierarchies may be good for passing down the orders, but scale-free structures are better for maintaining a certain worldview.
As we can see there is not one network topology that may be considered to be preferential. In fact it depends on the intention, the context, the situation. In some cases it can be good if a network can propagate information easily to all of its elements relatively fast. In some other cases stability can be more preferential.
Overall, the topology of a network reflects how well it can propagate information, how susceptible it is to the new ideas, whether the ideas will take over the whole network for only a short time or remain for a longer period.