To BQ or not to BQ
Qualifying for the Boston Marathon is a long-standing goal for many marathoners. To qualify runners must achieve a gender and age related cut-off time in a qualifying marathon. For example, 45–49 year old men need to beat 3 hours and 25 minutes to be in with a shot of qualifying. However, the high demand for participation in the fabled Boston Marathon is such that achieving your BQ standard is not a guarantee for entry, and in recent years increasingly many qualifying runners have been excluded due to limits on participation numbers. For example, a recent Runners World
Every year, the Boston Athletics Association (
On the one hand these tougher times obviously make it harder for runners to achieve a BQ standard, but on the other hand, they are designed to increase the likelihood of entry for those who do achieve the standard. Runners who are mostly interested in bragging rights, rather than entry rights, will be disappointed, but for those who are driven by the desire to race Boston, the entry-odds should be significantly improved if they make the new standards.
But what are the implications of the new standards? How will they change BQ rates in practice? BQ rates should drop but by how much? And do the changes reflect a level playing field for all ages and genders?
To explore these questions we will compare the current 2013 and the new 2020 BQ standards using a dataset of more than 3,275,398 runners, from dozens of big-city marathons across the world over the last 15 years or so. For the purpose of this analysis we will focus on the subset of 2,460,733 runners who have competed under the current 2013 qualification standard.
BQ Rates
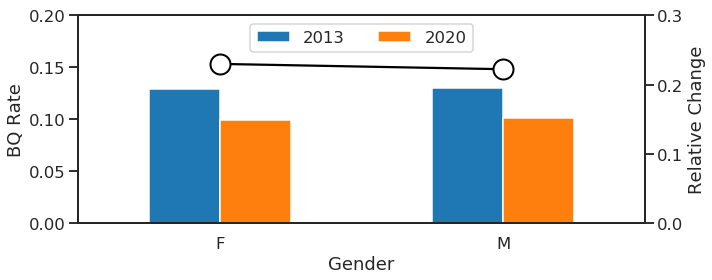
To begin with let’s look at BQ rates, that is the fraction of runners who achieve their BQ standardusing the 2013 standard compared to the 2020 standard. Figure 1 shows these rates for men and women: almost 13% of men and women qualified under the 2013 standard, but under the new 2020 standard these BQ rates drop to approximately 10% (9.9% for women and 10.1% for men). In other words, 23% fewer women, and 22% fewer men, are likely to qualify under the new 2020 standard.

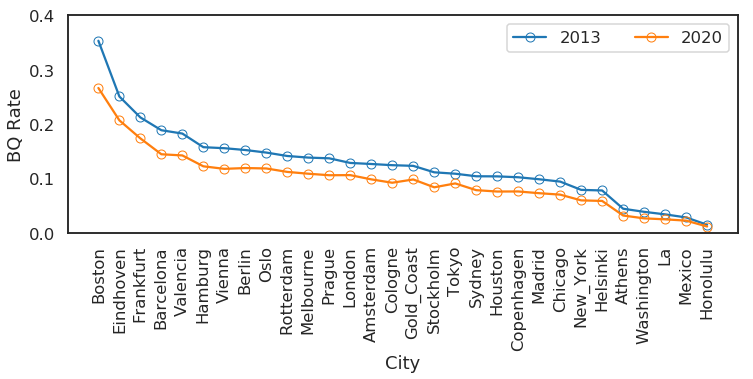
And, just for fun, we can consider the BQ rates for different cities in our dataset, as in Figure 2. BQ rates vary quite considerably across our dataset with marathons like Boston, Eindhoven, and Frankfurt generating the greatest proportion of BQs among their participants (>20%) while cities like LA, Mexico, and Honolulu only appear to generate very small numbers of BQs (<5%). Of course, the new 2020 standards depress these qualification rates for all of the cities, but some are impacted more than others. For example, the Marine Corps marathon (Washington) is associated with the greatest relative drop in BQ rate (31%), as the percenage of qualifiers falls from 3.8% to 2.6%. In contrast, Tokyo experiences the smallest relative change in BQ rates (16%) as the percentage of qualifiers falls from 10.8% to 9.1% as a result of the 2020 standards.

BQ Margins
Another way to look at the data is to consider the degree to which runners meet or miss their BQ standard, which we call the BQ margin. For example, according to the 2013 standard, a 50–54 year old women has to beat 4 hours (240 minutes) to qualify. Suppose a women in this age group secures a finish time of 237 minutes and 36 seconds, beating their qualification time by 2.4 minutes then their BQ margin is +0.01; they have beat their time by 1% of the cut-off. Likewise if another women in this age group missed her qualification time by 24 minutes (a finish-time of 3 hours and 36 minutes), or 10%, then her BQ margin is –0.1.
In this way the BQ margin allows us to evaluate the degree to which runners over or under-perform relative to their qualification standard. In Figure 3 we present the BQ margins for men and women who (a) achieve their BQ time and (b) miss their BQ time, using the 2013 and 2020 standards.

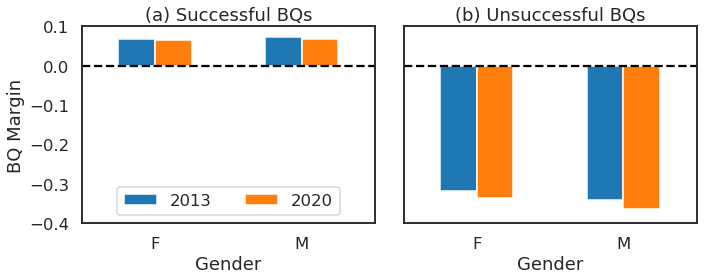
Using the 2013 standard, runners who achieve their BQ time do so with a BQ margin of about 0.07 (7% to spare); more precisely, it’s 6.9% for women and 7.3% for men. If we apply the 2020 standard, not only do fewer runners qualify (as per Figure 1), we see in Figure 2(a) that their BQ margins reduce albeit only fractionally; the new margins are 0.066 (6.6%) for women and 0.067 (6.7%) for men.
A similar analysis is presented in Figure 2(b) but this time focusing on the (majority) of runners who fail to make their BQ times. Under the 2013 standard, the BQ margins for men and women, who fail to meet their cut-offs, are –0.34 (–34%) and –0.31 (–31%), respectively, and these increase to –0.36 (–36%) and –0.33 (–33%), respectively, under the 2020 standard. In other words, under the 2020 standard, not only do more runners miss their BQ time, they miss by an increasingly large margin. Moreover, men tend to miss by a larger margin than women, under both standards.
Age Group Analysis
Of course a key feature of the BQ standard that it provides different qualification times for different age groups, in order to provide runners of all ages with a chance to qualify. Tightening the qualficiation standard by 5 minutes, regardless of gender and age, has the advantage of being a simple change to communicate, but is it fair across all age groups? For example, 18–34 year old male runners, with a 2013 BQ target of 185 minutes, must improve their finish-times by 2.7% under the 2020 standard. The same 5-minute improvement for 60–64 year old males, who have a 2013 BQ of 235 minutes, requires a less demanding relative improvement of 2.1%. In general, older runners, with slower BQ times, need to make smaller relative improvements to their times, compared to younger runners, if they are to meet the new 2020 standard
BQ Rates by Age Group
In Figure 3 we present the BQ rates for (a) male and (b) female runners according to the 2013 and 2020 standards, across the various age groups. Perhaps the most striking feature of these results is that the BQ rates tend to increase with age, at least when we look at the distribution of finish-times in our dataset. Older runners BQ significantly more often than younger runners, regardless of gender. For example, 18–34 year old female runners BQ about 10% of the time, based on the 2013 standard. For 40–44 year old females the BQ rate rises to about 17%. The same pattern is evident for the 2020 qualification standards, albeit for its reduced BQ rates.

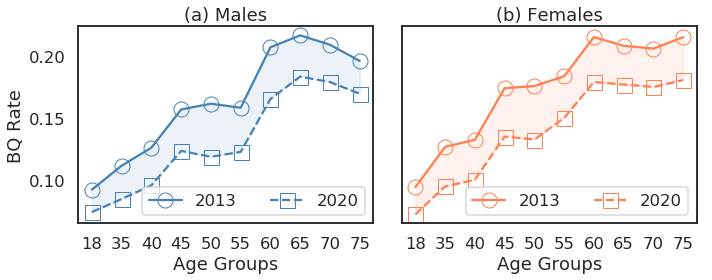
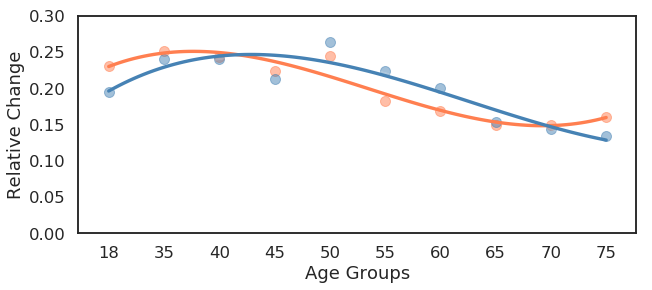
It is also worth highlighting how the 2020 changes will not be felt evenly by all age groups. As mentioned earlier, younger runners will need to improve their finish-times by a greater relative amount, compared with older runners, and this is reflected in the relative change in BQ rates when we compare 2013 and 2020 policies, as shown in Figure 5. For example, the BQ rates for 35–39 year old runners are reduced by approximately 25%, whereas the rates for 65–69 year-old runners drop by only 15%.

BQ Margins by Age Groups
We can apply a similar approach to consider the margins associated with those who succeed or fail to qualify according to the 2013 and 2020 standards, as shown in Figure 4. This time we show the margin for those that achieve their BQ (margin > 0) and the margin for those that fail to BQ (margin < 0) on the same graph. The margins for qualifiers are fairly stable across all age groups and only marginally impacted by the tougher qualification conditions of the 2020 standard; in general males and females who qualifiy do so with a margin of about 6%.

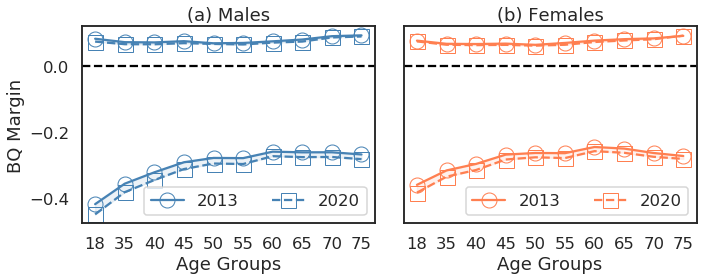
Of course most runners do not qualify and we can see how their distance from the qualification standard is impacted significantly by age, just as BQ rates are. Younger runners tend to miss their qualification standard by a large margin (-40%) — the margins are slightly wider for males than females — but this reduces with age, so that by the time runners are in their 60s their BQ margins have closed to about -25%. It is worth noting too that the margins associated with those who fail to qualify are impacted by the tougher 2020 standards: for males and females of all ages the 2020 margins are even wider than their 2013 counterparts.
Implications for 2020 Runners
In summary then, there is no doubt that the new 2020 BQ policy will have a significant impact on qualification rates. Based on our dataset of more than 2m runners, from marathons around the globe, we can expect the new standards to reduce qualification rates from about 12–13% to about 10% overall.
However, this overall qualification rate only tells part of the story because, regardless of qualification standard, there appears to be a strong interaction between qualification rates and the age of runners, with older runners significantly more likely to qualify than younger runners, whether male or female. Is this fair?
Is it right that older runners appear to be up to twice as likely to BQ than younger runners? Or should an effort be made to develop a fairer set of age standards so that the chances of securing a BQ are equal across all ages and genders? We will refer to this as the ‘Fair BQ’ policy and we will describe how to determine such a policy in the next section.
Towards a Fair BQ Standard
It turns out that building the ‘Fair BQ’ policy is straightforward. The starting point is to pick a target qualification rate, to use as the basis for filtering runners. Since the new 2020 BQ standard reduces overall qualification rates to about 10% we can use this as our target qualification rate.
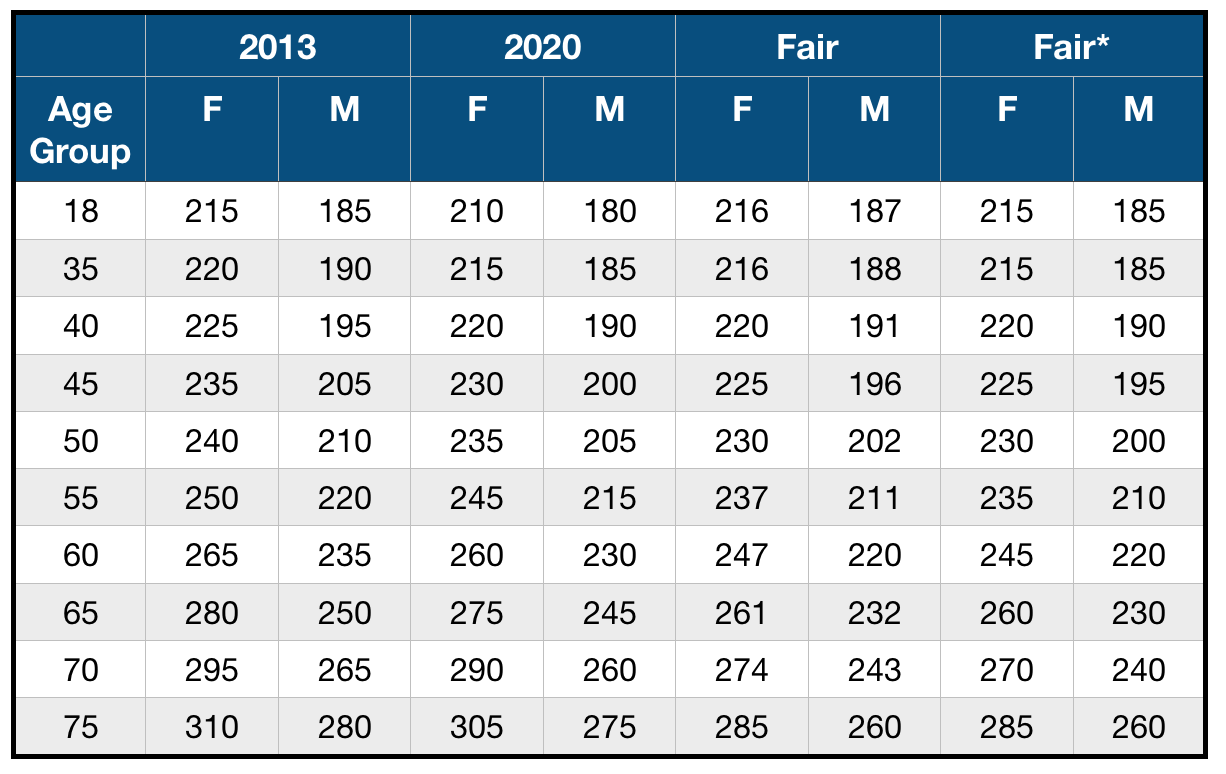
Next, to identify the cut-off times for runners (by age and gender) we simply group all of our runners, based on their gender and age group, and compute the 10th percentile of the finish-times in each of these groups, sorted in ascending order of finish-time; if we wanted to use a different target BQ rate then we would use the percentile corresponding to that rate. The resulting cut-off times are presented as part of Table 1.

This approach is guaranteed to generate a set of cut-off times, for each gender and age group (cohort), such that only 10% of runners in the cohort achieve this time or faster. Figure 7(a) depicts this visually by showing the BQ rates for men and women, across all age groups, using this Fair BQ standard; for each age group we can see that 10% of runners meet the BQ standard.

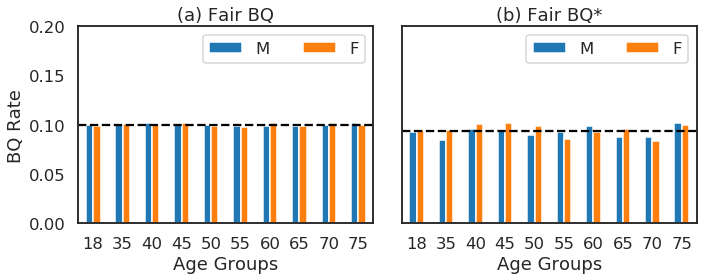
One of the disadvantages of this new Fair approach is that it tends to produce cut-off times that are not rounded off to the nearest 5 minutes, as is the case with the existing BQ standards. Of course we can address this and in Table 1 we also include times for a version of Fair called Fair* in which each cut-off time is rounded up or down to the nearest 5 minutes. This produces more ‘regular’ cut-off times but it does also effect the BQ rates. For example, in Figure 7(b) we show the BQ rates for this adjusted, Fair* policy and we can see how some cohorts are associated with BQ rates that are sometimes slightly higher or lower than the target BQ rate, while still admitting 10% of runners overall. Either way, Fair and Fair* generate BQ rates that are much more balanced than those produced by the 2013 and 2020 standards on our test dataset.

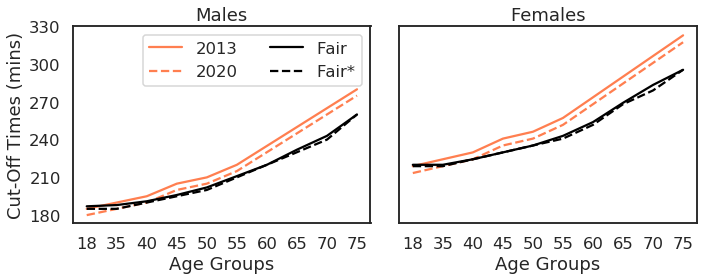
The cut-off times for all policies are summarised visually in Figure 8. The bottom-line is that to achieve ‘fairness’ the Fair and Fair* policies tend to disproportionately tighten the qualification times associated with older (>40 years old) runners, because these groups enjoy higher BQ rates than younger runners under the current policies.
Conclusions
As marathon running has grown in popularity over the last few years, more and more runners appear to be targeting the Boston Marathon as a must-do race. The result has been a gradual increase in applications and a corresponding drift in the utility of existing (2013) qualification standards, as each new year sees more and more ‘qualifying’ runners failing to gain entry due to limittaions in the total number of places on offer. The new changes in the Boston Qualification standards for 2020 are designed to help address this problem, at least in the sense that the (tougher) cut-off times reflect a set of qualification times that are more likely to see qualifiers gaining actual entry into the Boston Marathon, should they apply.
Based on an analysis of more than 2m marathoners, from races around the world, we can expect the new 2020 standards to reduce the qualification rate by about 22–23%, for men and women. But these new standards will not be felt equally by all runners. Younger runners will need to improve their times to a greater degree than older runners (relatively speaking).
This analysis has highlighted an inherent qualification bias in the 2013 and 2020 policies that favours older runners. As an alternative we have calculated the cut-offs for a new BQ policy (Fair) with the objective of providing runners of all ages with an equal chance (10%) of qualifying, regardless of age.
