Performance Improvements in Mesos 1.7.0
Performance Improvements in Mesos 1.7.0
Scalability and performance are key features for Mesos. Some users of Mesos already run production clusters that consist of many tens of thousands of nodes. However, there remains a lot of room for improvement across a variety of areas of the system.
The Mesos community has been working hard over the past few months to address several performance issues that have been affecting users. The following are some of the key performance improvements included in Mesos 1.7.0:
- Master
/stateendpoint: Adopted RapidJSON and reduced copying for a 2.3x throughput improvement due to a ~55% decrease in latency (MESOS-9092). Also, added parallel processing of/staterequests to reduce master backlogging / interference under high request load (MESOS-9122). - Allocator: in 1.7.1 (these patches did not make 1.7.0 and were backported to 1.7.x), allocation cycle time was reduced. Some benchmarks show an 80% reduction. This, together with the reduced master backlogging from
/stateimprovements, substantially reduces the end-to-end offer cycling time between Mesos and schedulers. - Agent
/containersendpoint: Fixed a performance issue that caused high latency / cpu consumption when there are many containers on the agent (MESOS-8418). - Agent container launching performance improvements: Some initial benchmarking shows a ~2x throughput improvement for both launch and destroy operations.
Before we dive into the details of these performance improvements, I would like to recognize and thank the following contributors:
- Alex Rukletsov and Benno Evers: for working on the parallel serving of master
/stateand providing benchmarking data. - Meng Zhu: for authoring patches to help improve the allocator performance.
- Stéphane Cottin and Stephan Erb: for reporting the
/containersendpoint performance issue and providing performance data. - Jie Yu: for working on the container launching benchmarks and performance improvements.
Master /state Endpoint
The /state endpoint of the master returns the full cluster state and is frequently polled by tooling (e.g. DNS / service discovery systems, backup systems, etc). We focused on improving performance of this endpoint as it is rather expensive and is common performance pain point for users.
RapidJSON
In Mesos we perform JSON serialization by directly going from C++ objects to serialized JSON via an internal library called jsonify. This library had some performance bottlenecks, primarily in the use of std::ostream for serialization:
- See here for a discussion of its performance issues with strings.
- See here and here for integer-to-string and double-to-string performance comparisons against
std::ostream.
We found that RapidJSON has a performance focused approach that addresses these issues:
- Like
jsonify, it also supports directly serializing from C++ without converting through intermediate JSON objects (via aWriterinterface). - It eschews
std::ostream(although it introduced support for it along with a significant performance caveat). - It performs fast integer-to-string and double-to-string conversions (see performance comparison linked above).
After adapting jsonify to use RapidJSON and eliminating some additional mesos::Resource copying, we ran the master state query benchmark. This benchmark builds up a large simulated cluster in the master and times the end-to-end response time from a client’s perspective:

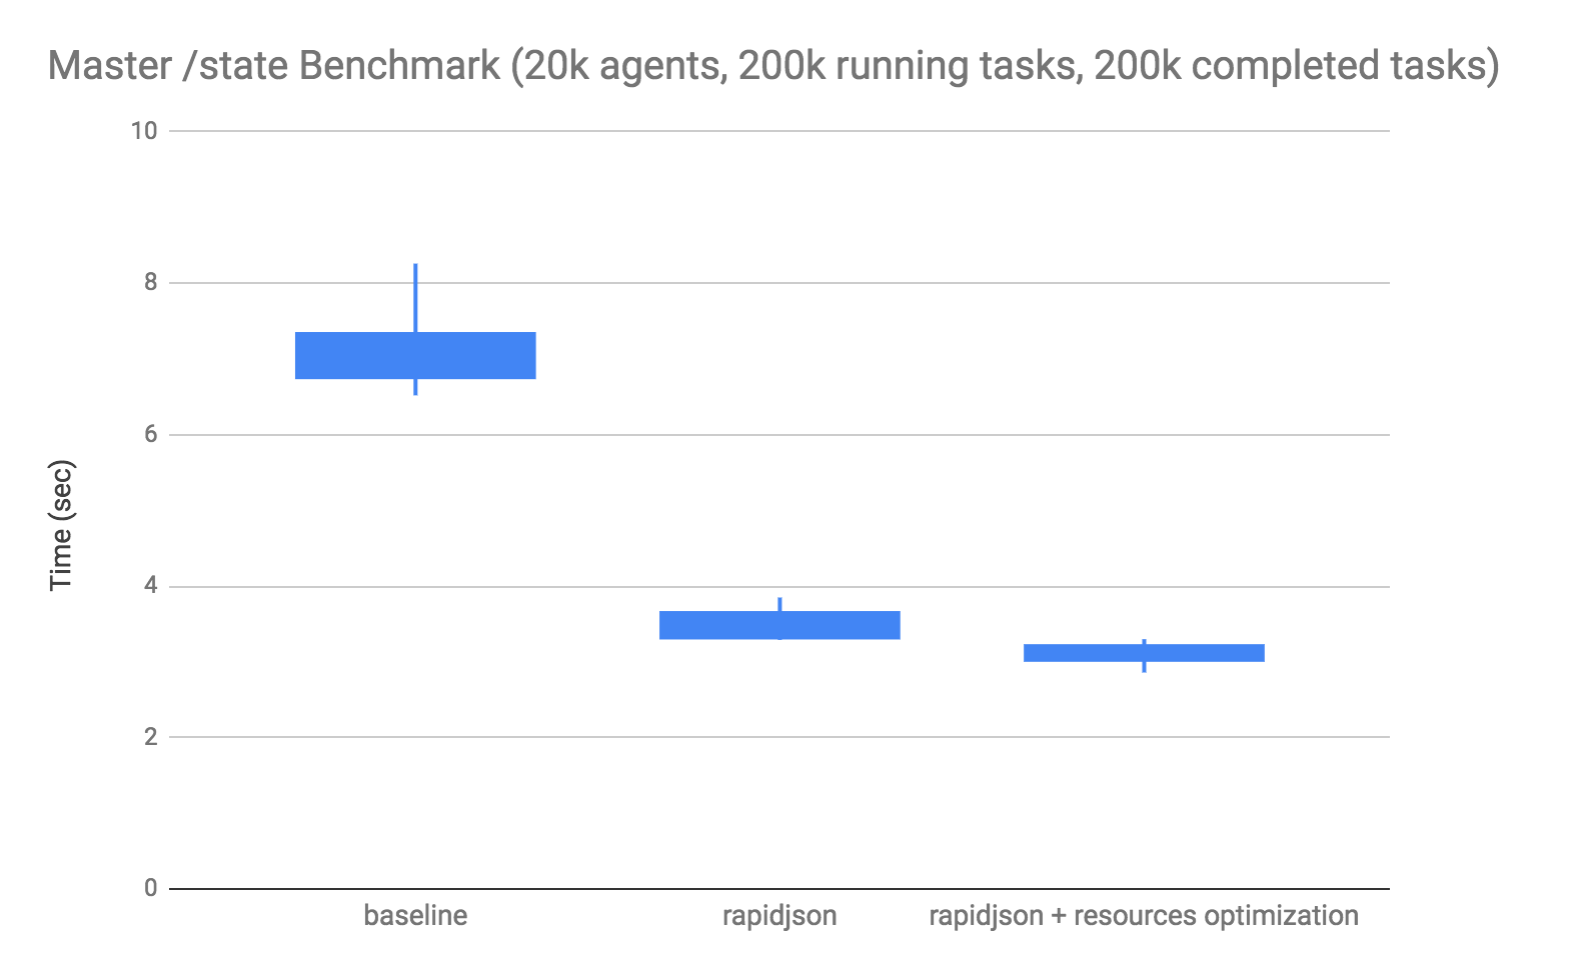
This is a box plot, where the box indicates the range of the 1st and 3rd quartiles, and the lines extend to the minimum and maximum values. The results above showed a reduction in the client’s end-to-end time to receive the response from approximately 7 seconds down to just over 3 seconds when both rapidjson and the mesos::Resource copy elimination are applied. An 55% decrease in latency, which yields a 2.3x throughput improvement of state serving.
Parallel Serving
In Mesos, we use an asynchronous programming model based on actors and futures (see libprocess). Each actor in the system operates as an HTTP server in the sense that it can set up HTTP routes and respond to requests. The master actor hosts the majority of the v0 master endpoints, including /state. In an actor-based model, each actor has a queue of events and processes those events in serial (without parallelism). As a result, actors can be overwhelmed if there are too many expensive events in their queue. HTTP requests to the /state endpoint are an example of an expensive event, especially for larger clusters. If multiple clients are polling the /state endpoint, responsiveness of the master can degrade significantly.
In order to improve the ability to serve multiple clients of /state, we introduced parallel serving of the /state endpoint via a batching technique (see MESOS-9122). This was possible since /state is read-only against the master actor, and we accomplish this by spawning other worker actors and blocking the master until they complete (see MESOS-8587 for potential library generalizations of this technique).
A benchmark was implemented that polls the master’s /state endpoint concurrently from multiple clients and measures the observed response times across 1.6.0 and 1.7.0:

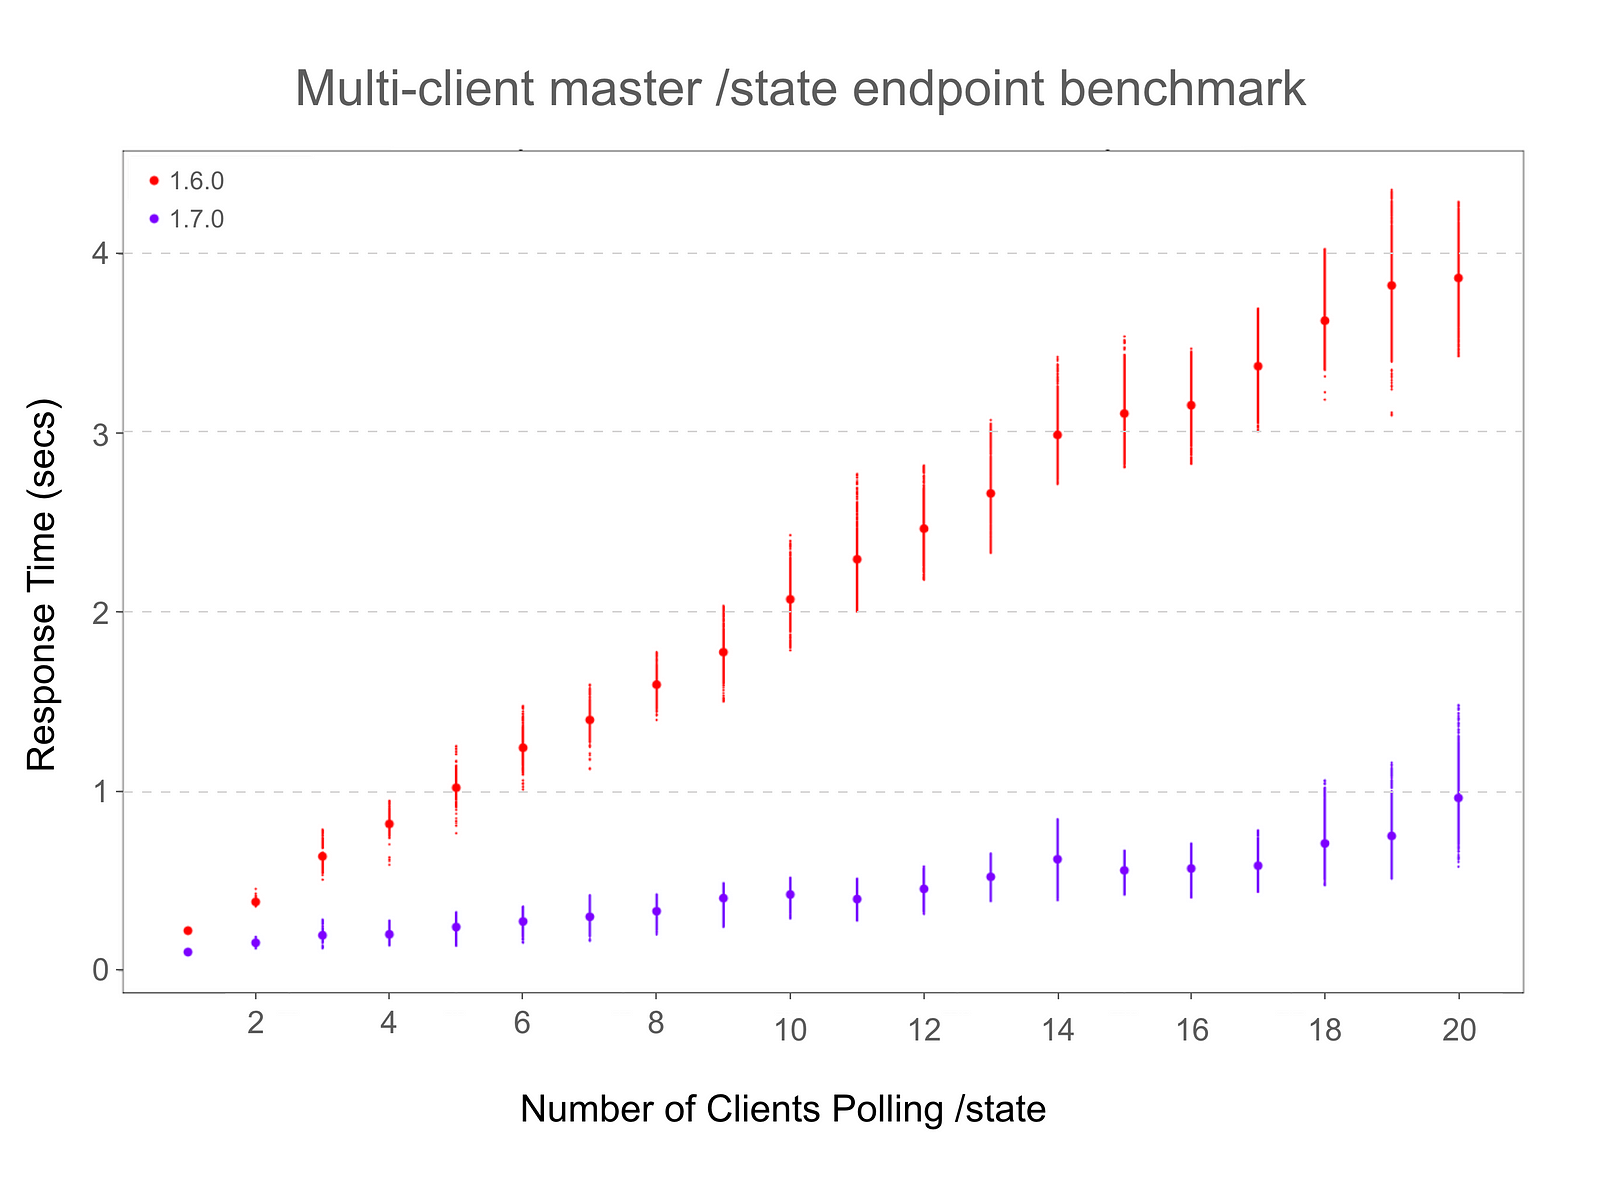
The benchmark demonstrates a marked improvement in the response times as the number of clients polling the /state endpoint grows. These numbers were obtained using an optimized build on a machine with 4 x 2.9Ghz CPUs, and LIBPROCESS_NUM_WORKER_THREADS was set to 24. A virtual cluster was created with 100 agents, 10 running and 10 completed frameworks with 10 tasks each, on each agent. Every client polls the /state endpoint 50 times. Small dots denote raw measured response times, big dots denote the arithmetic mean. The top and bottom 2% of raw times were removed to filter outliers.
Allocation Cycle Time
Several users reported that the master’s resource allocator was taking a long time to perform allocation cycles on larger clusters (e.g. high agent / framework counts). We investigated this issue and found that the main scalability limitation was due to excessive re-computation of the DRF ordering of roles / frameworks (see MESOS-9249 and MESOS-9239 for details).
We ran an existing micro-benchmark of the allocator that creates clusters with a configurable number of agents and frameworks:

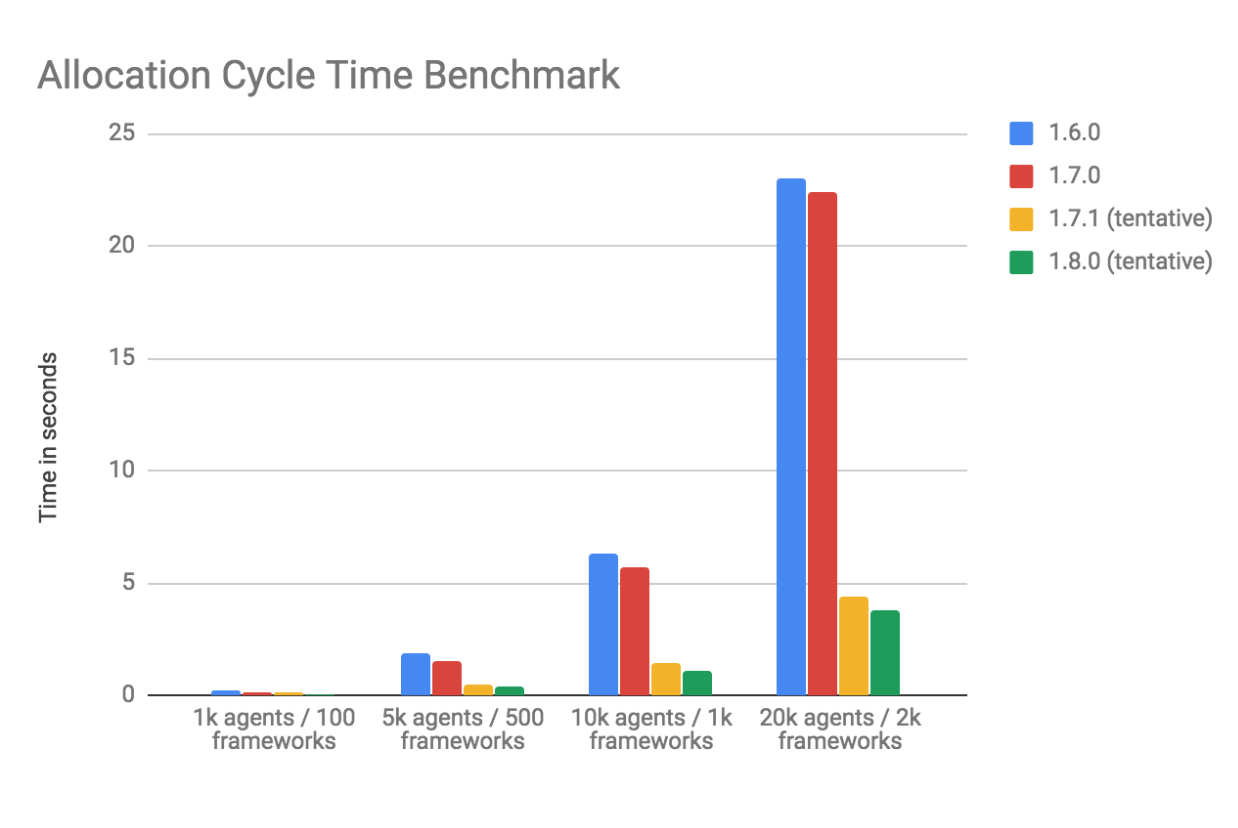
The results show an ~80% reduction in allocation cycle time in 1.7.1 for this particular setup (all frameworks in a single role, no filtering). Since this is a substantial improvement to a long-standing pain point for large scale users, we backported the changes to 1.7.1 since they are not included in 1.7.0.
Future work is underway to improve the allocation cycle performance when quota is enabled (see: MESOS-9087).
Agent /containers Endpoint
Reported in MESOS-8418, during the collection of container resource consumption metrics, there are many reads of /proc/mounts being performed. The system mount table will be large and expensive to read if there are a lot of containers running on the agent using their own root filesystems. This was only incidentally being done as a result of some cgroup related verification code performed before reading a cgroup file. Since this code was only in place to provide better error messages, it was removed.
Stephen Erb provided the following graphs that show the impact of deploying the change. First, we can see the tasks (i.e. containers) per agent:

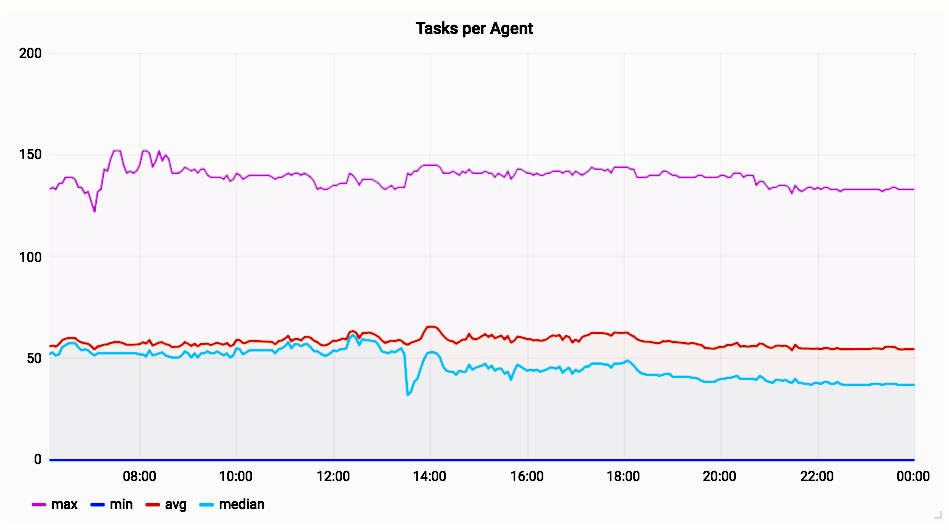
The agent with the most tasks has ~150 containers, the median and average are both around 50 containers. The following graph provided by Stephan Erb shows the latency of the /containers endpoint before and after deploying the fix on the same cluster:

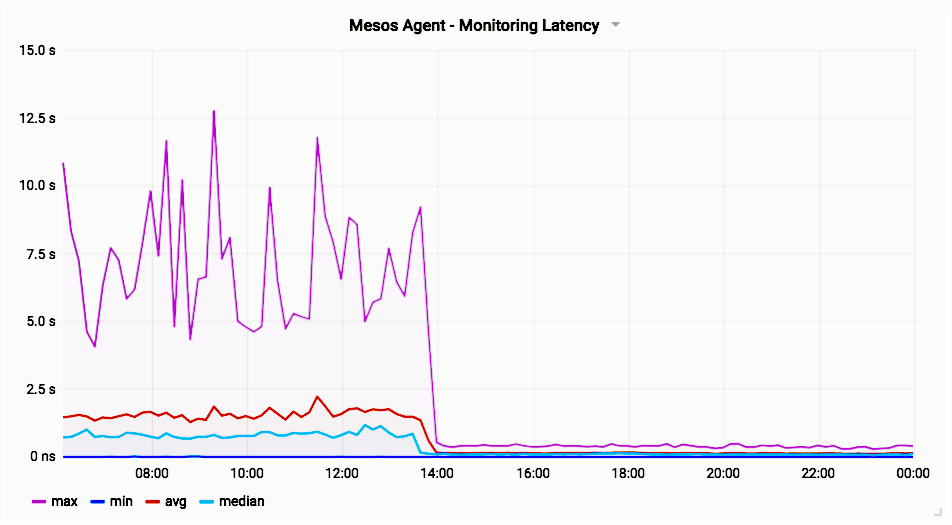
Prior to the change, the agent with the worst /containers latency took between 5-10 seconds to respond, and the median latency across agents was around 1 second. After the change, all of the agents have sub-second /containers latency.
Agent Container Launching
From the user reports originally in MESOS-8418, we identified that the container launching throughput would suffer from the same issue of expensive /proc/mounts reads shown above in the /containers endpoint improvements. See MESOS-9081.
To remedy this, we moved the cgroups verification code to the call-sites. Since the cgroup just needs to be verified once during the bootstrapping agent bootstrap, this optimization significantly reduces the overhead of launching and destroying containers.
A preliminary benchmark shows that the container launch / destroy throughput gained a 2x throughput improvement thanks to a 50% reduction in latency. This test uses an docker image based on the host OS image of the machine it’s running on:

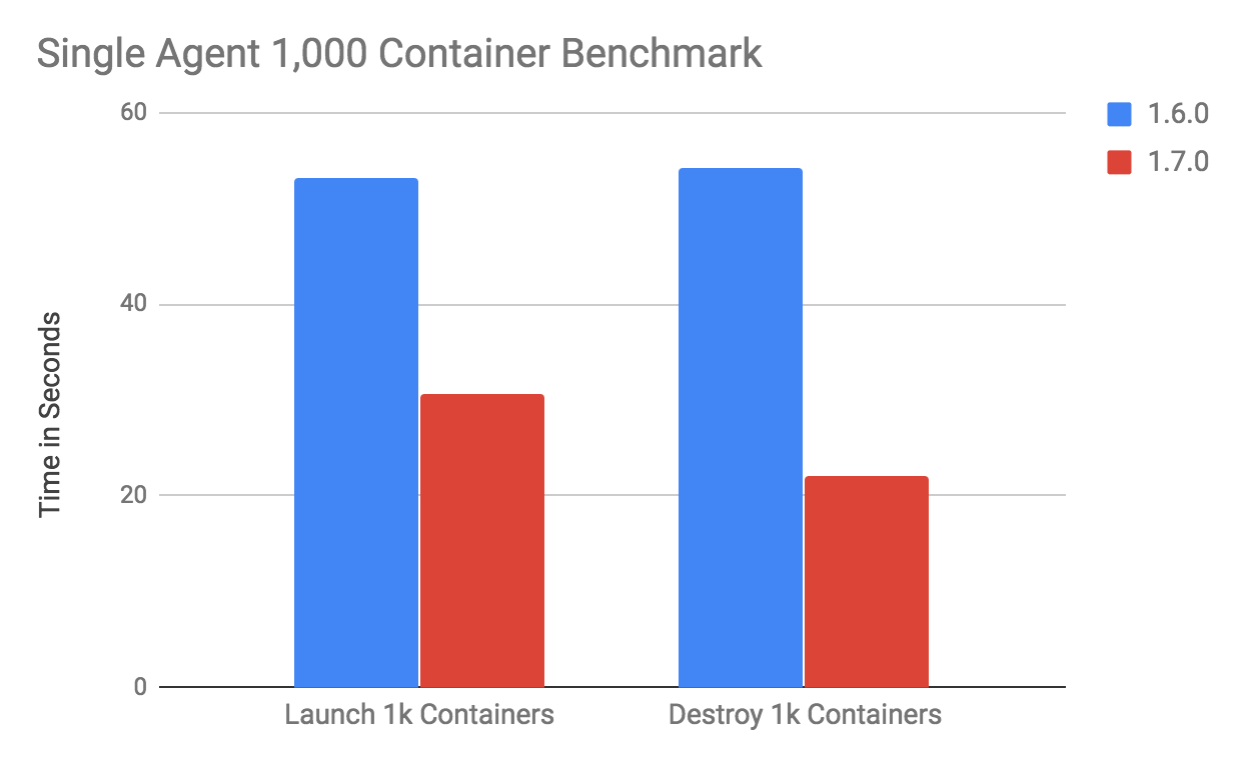
In this particular benchmark (see reviews.apache.org/r/68266/), a single agent is able to launch 1000 containers in about 30 seconds, destroying those 1000 containers in just over 20 seconds. This numbers were obtained on a server with 2 x Intel® Xeon® CPU E5–2658 v3.
Performance Working Group Roadmap
The backlog of performance worked in tracked in JIRA, see here. Any ticket with the performance label is picked up by this JIRA board.
If you are a user and would like to suggest some areas for performance improvement, please let us know by emailing [email protected] and we would be happy to help!
