Demystifying the p-value
Demystifying the p-value
As I began my initial foray into the mysterious world of data science, I became acquainted with not only the basics of Python, but also some fundamental statistical concepts that (as I later discovered) would serve as a foundation to supplement my continuing journey into the depths of machine learning.
Many of these foundational statistical concepts were not unfamiliar to me. Due to course requirements of my undergraduate major (computer science), I had taken a college level Elementary Statistics course less than a year before beginning my data science journey. Words and phrases such as linear regression, hypothesis testing, confidence intervals, scatter plots, probabilities, distributions, etc. etc. all conjured memories from that recent semester. I was in vaguely familiar territory, but this time around my reason for learning this information was not because it is required in order to graduate from college — now it is 100% necessary to learn and understand these concepts at a low level in order to establish effective skills as a data scientist.
This, in turn, required me to closely analyze such concepts like “Why do we need a null hypothesis and an alternative hypothesis?”, “Why do we need to set an alpha, or the significance level, at the outset of an experiment?”, and most notably: “What the heck is a p-value and what does it mean?”


The first two questions hardly gave me any trouble. I was instantly capable of following and accepting the logic of why
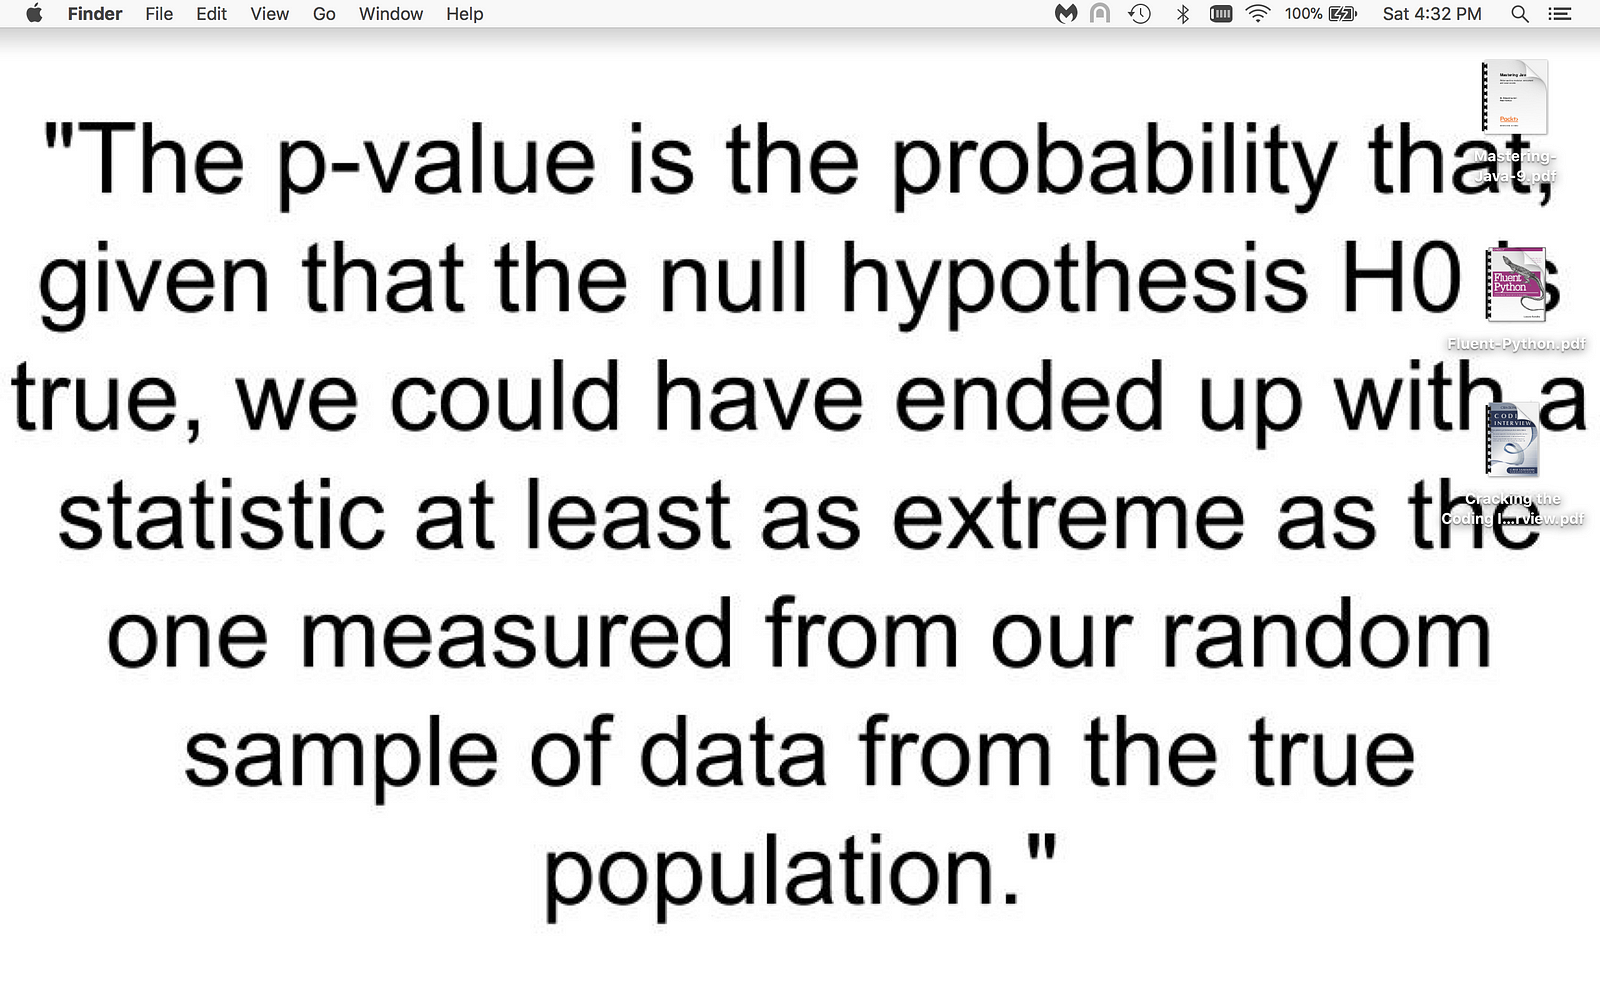
These were the questions that I struggled with. So much so that I changed the desktop background on my computer for weeks to an image of the “formal” definition of p-value.


Why do we need to set an alpha?
Setting an alpha before performing an hypothesis test essentially serves to eliminate bias when interpreting the results of the test. Often times, the alpha value is set at .05 which means that we want our p-value to be smaller than that number in order to reject the null hypothesis. Which might lead you to my next question.
What the heck is a p-value?
As you may have noticed in the screenshot earlier in the post, the p-value is the probability that, given that the null hypothesis H0 is true, we could have ended up with a statistic at least as extreme as the one measured from our random sample of data from the true population.* But what does this actually mean? This definition is kind of technical, and if you’re anything like me, the wording of this definition took a while to sink in. The first time I read it, I knew that I was going to have to sleep on it. The tenth time I read it — I knew that I was going to have to set it as my desktop background. Now I’m going to attempt to break it down piece-by-piece.
“The p-value is the probability…” — this is saying that the value assigned to our p-value is going to be a probability. Assuming the definition of ‘probability’ is known, to explain this with an example we could say, if the calculated value of the p-value is 0.04, then this first piece of the p-value’s definition is saying that “there is a 4% probability that…”
“… given that the null hypothesis H0 is true…” — this is setting a condition that is required to be true in order for all other pieces of this definition to be true. The null hypothesis must be thought of as true when interpreting this definition.
“… we could have ended up with a statistic at least as extreme as the one measured from our random sample of data from the true population.” — this translates to “we would have ended up with the same result observed from our sample population- if not a more extreme result — from our true population.”
Piecing It All Back Together
Let’s put these pieces back together plainly using an example where our null hypothesis is that a new teaching method has no significant impact on test scores, and our alternative hypothesis is that a new teaching method does have a significant impact on test scores. We set our alpha at .05. After we perform our experiment and calculate our observations, our p-value is equal to .004, and our observed test statistic is 7. Since our p-value is less than our alpha, we are able to reject the null hypothesis. This p-value means that it is .4% likely that we could have observed a 7 unit change in test scores using this new teaching method if the new teaching method had no significant impact on test scores. The less likely we are to observe the test statistic given that our null hypothesis is true has a direct negative correlation with how likely it is that we will observe that test statistic given that our null hypothesis is false.
* this definition of the p-value was given to me by Caroline Schmitt
