
Using Data Science to help Women make Contraceptive Choices
Clearly, some of the contraceptives are more popular and used more often than others, leading to imbalance between classes. We can try to address this in the modeling portion of the project.
Features:
Some of the features included age, ethnicity, marital status, number of partners, etc. I thought long and hard about the tool that I wanted to build, and knew that I would not be able to recommend a contraceptive unless the woman using my tool entered in all the necessary information, and asking for number of sexual partners would be too invasive. For this reason, I chose to include only three features in my model: Age, Ethnicity* and Marital Status. Since there were several types of marital status (“Separated”, “Married”, “Living together”, “Widowed”, etc.), I grouped them to three levels that encapsulated all these types of relationships — Single, Married or In a Relationship. In addition, Ethnicity was one-hot encoded using sklearn preprocessing.
We’re ready for some modeling!
*One unfortunate limitation from using this data set was that there were only three ethnicities — White, Black and Hispanic. Either only women of these ethnicities were included, or women only had these three ethnicities to choose from in the original data collection from the surveys.
Modeling:
Initially, I tried to create a model that would predict the most likely contraceptive for a woman, regardless of type. Then, with some valuable feedback from my Insight Technical Advisor, I split the contraceptives into two subgroups — semi-permanent or impermanent — and created two models for each subgroup. Each subgroup had four contraceptives as predictive classes, and the data was randomly split into 80% training and 20% test set using sklearn’s model selection.
Since this is a multi-class classification problem, I began with a Gaussian Naïve Bayes model rather than a logistic regression, which tends to do better in binary classification scenarios. I decided to start without any over- or under-sampling to see how a baseline model would do.
For both subgroups, the GNB model had a slightly higher accuracy than random (0.60), which in this case would be predicting the majority class every time (0.57). However, the GNB model assumes total independence between features — here, we know that age and marital status would surely be correlated. To take the feature correlations into account, the next model I used was a Random Forest (RF), which performed slightly better than the GNB (0.65). I chose to implement the RF in the product as it would also scale easily as we add more features. Below, you’ll see an example of the confusion matrix for the semipermanent group.


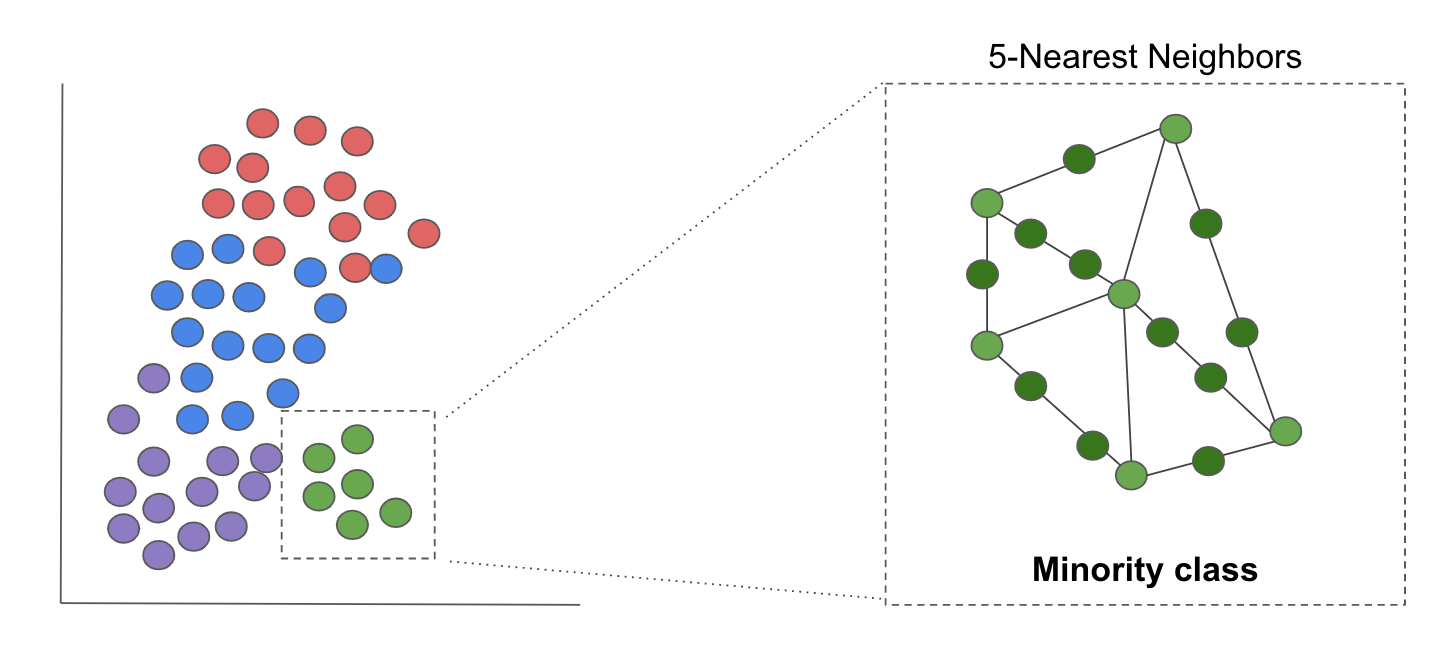
Clearly, the classes are imbalanced. To try to mitigate this issue, I used Synthetic Minority Over-Sampling (SMOTE from imbalanced-learn API imblearn; image below) to generate some data points in the minority classes to help train the model better. SMOTE works by generating data based on k-neighbors in the minority class. I considered under-sampling the majority class, but realized that with my already limited data set, I would be training my model on even less data. As was expected, the accuracy of the test set dropped, with no improvement in recall.

You’re probably asking, why did I use accuracy as a metric to measure the performance of my model? I wanted the model’s predictions to reflect the true nature of the distribution of contraceptive use among women. Unlike binary classification scenarios such as fraud detection and identifying breast cancer, I didn’t want my model optimized for it’s precision or recall on a particular class. In this case, the model’s accuracy best captured its overall performance across all classes. Because this was my goal, I chose to keep my original Random Forest model without any oversampling.
In addition, I noticed that the accuracy of the test set (0.65) was almost exactly that of the training set (0.66), indicating that I needed more predictive features for the model to improve in accuracy.
Moving forward:
In the future, with more time and resources at hand, I would look for other sources of data that could potentially be more predictive of contraceptive choice, such as geographic proximity to clinics, income level, etc. I received feedback that it might be useful to incorporate exclusions for those with certain medical conditions — this would be great to incorporate, but I would have to be careful with striking a balance between a suggestive tool and a medical recommendation. I could also spend time tuning additional hyperparameters of the random forest such as tree depth, minimum sample at a leaf, etc, which would be more effective with more predictive features.
Step 2: Analyzing the contraceptives’ side effects
To understand how women felt about the various types of birth control, I scraped r/BirthControl for two years’ worth of posts, using the pushshift.io Reddit API. This resulted in ~21,000 posts. From the body of each post, I used a variety of tools to clean up the text.
Text Cleaning:
- Remove stop words. To ensure that the sentiment around a contraceptive remained accurate, I kept “negation” words that are in the set of English stopwords from the Natural Language Toolkit (NLTK) corpus.
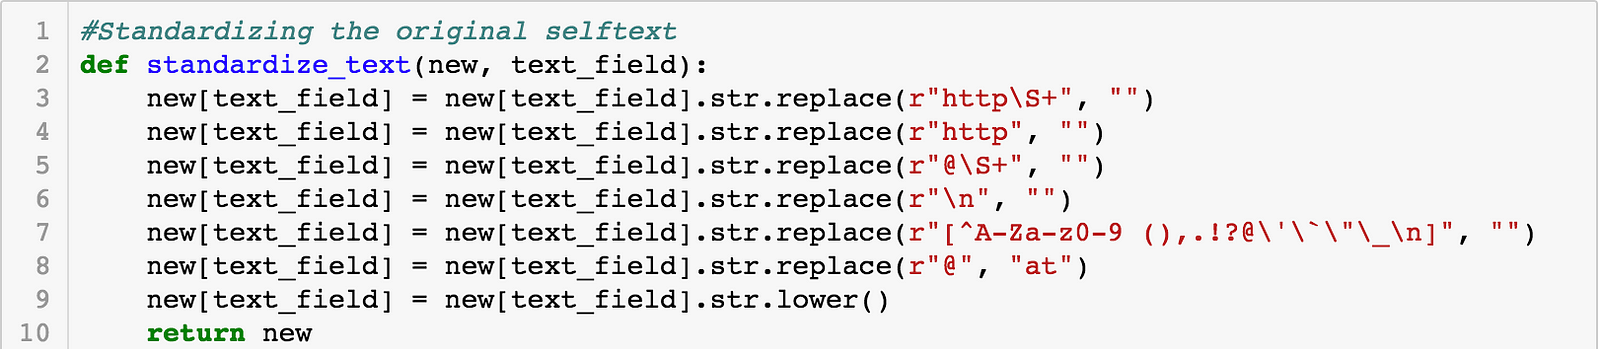
- Standardized text by removing URLs and another unnecessary characters, but keeping punctuation.

3. Tokenized (separated) sentences from one another using sent_tokenize from NLTK.
4. Stemmed words to remove their suffixes so that the same words do not get counted multiple times (i.e. pills becomes pill).
Once I had all the sentences separated out, I specifically wanted to look at sentences that mentioned the eight forms of birth control used in the predictive model above. I extracted the sentences that only mentioned the above contraceptives, and subsetted them into their respective pandas dataframes (i.e. all sentences mentioning “pill” go into the “pill” dataframe). To keep the sentiment analysis as accurate as possible, I only extracted sentences that mentioned the contraceptive of interest. So, a sentence mentioning the pill and the IUD wouldn’t be considered in the pill OR IUD dataframe. Although this reduces the amount of data I have to work with, it keeps the analysis of the sentiment of each sentence as accurate as possible.
Extracting Side Effect Mentions:
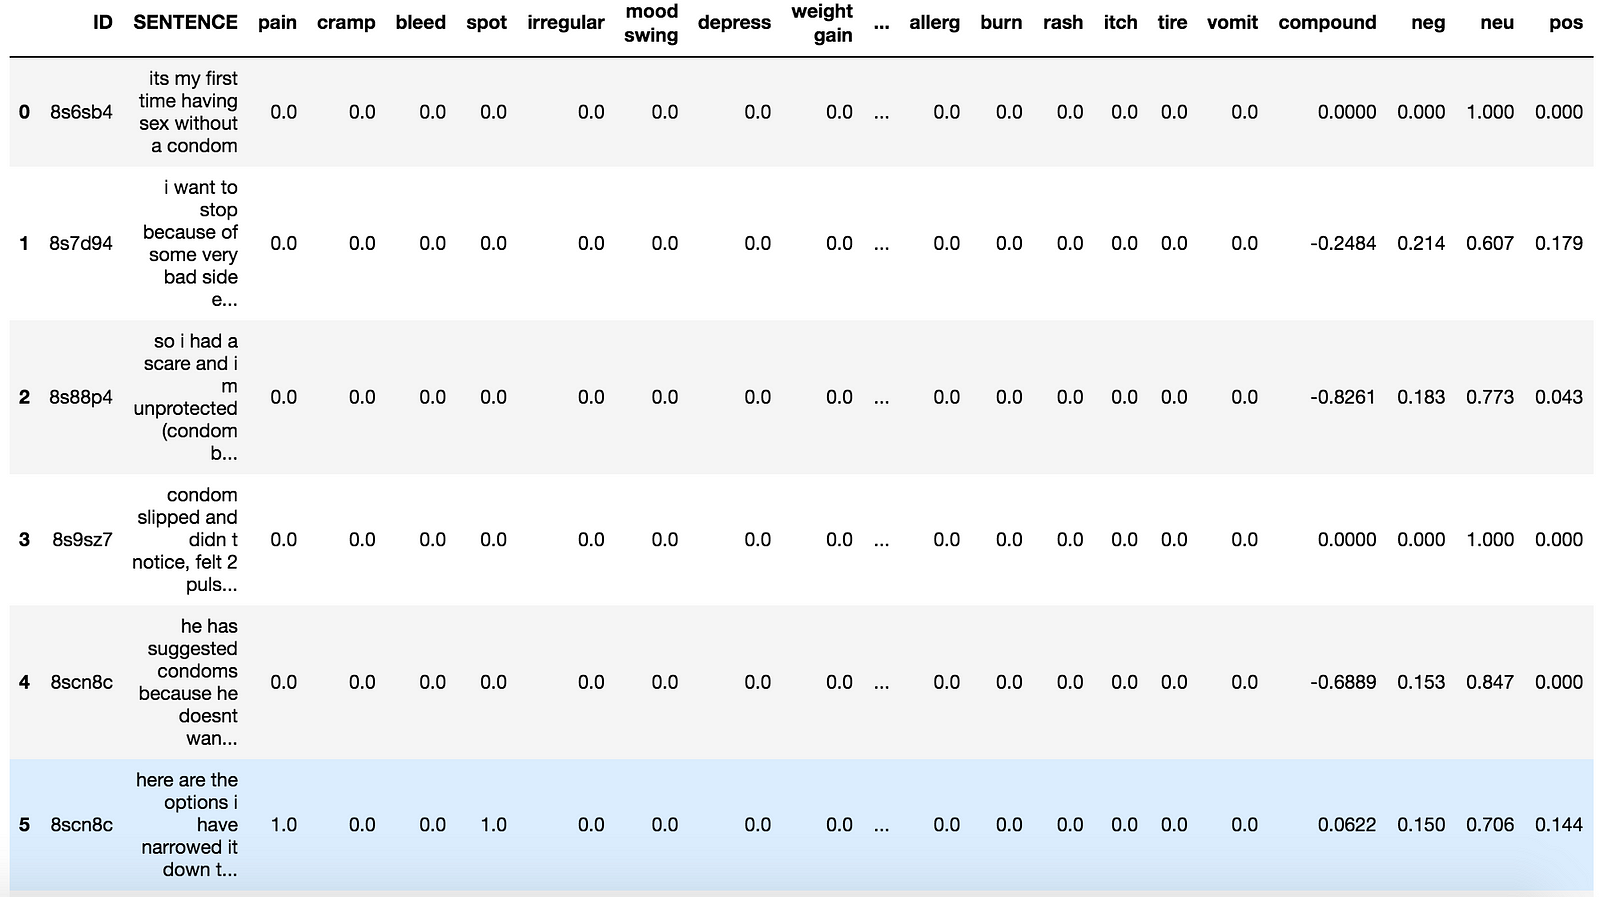
I created a list of potential side effects based on listed ones from the FDA website, and others that women had mentioned to me. Using this list, I created a new pandas dataframe with each sentence and whether or not it mentioned a particular side effect (1 or 0). You can think of this as a customized “bag of words” model, counting the number of times a side effect was mentioned in particular sentence about a contraceptive.
Sentiment Analysis:
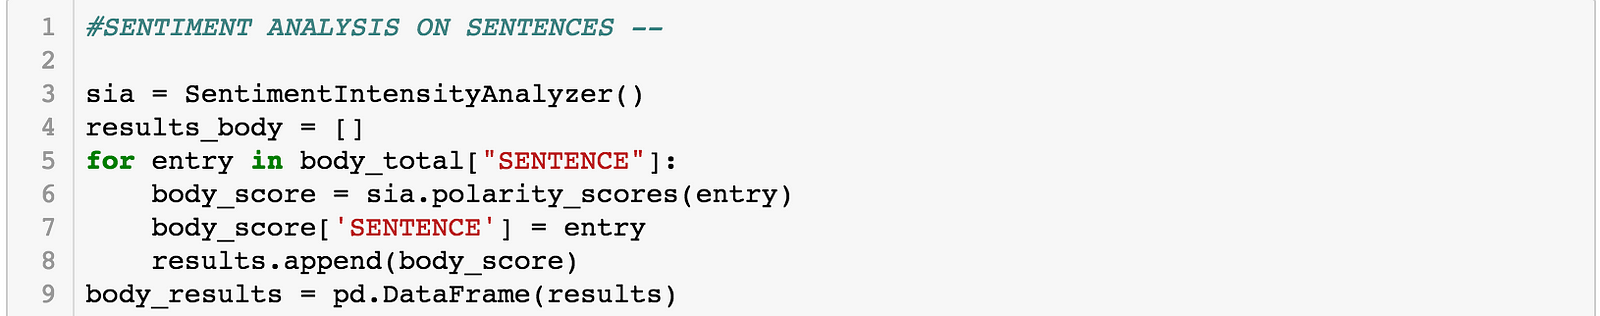
I applied the NLTK Sentiment Intensity Analyzer (SIA) from the VADER (Valence Aware Dictionary and sEntiment Reasoner) package to each sentence. This sentiment analyzer has been pre-trained on social media data, and uses a lexicon-based approach to take into account not only the type of sentiment (negative or positive) but also the intensity of the sentiment expressed, via the “polarity score”. There’s a great article on how this SIA was built and how it works here.
Here’s an example of the code and the resulting data set.


I was able to:
- Calculate the frequency of side effect mentions relative to all sentences mentioning a particular contraceptive
- Multiply the “polarity score” by the the specific side effect that was mentioned in the sentence, for each contraceptive.
This resulted in my final dataframe, below: