The Cost Of JavaScript In 2018
We’ve recently added support for flagging high “JavaScript boot-up time” to Lighthouse. This audit highlights scripts which might be spending a long time parsing/compiling, which delays interactivity. You can look at this audit as opportunities to either split up those scripts, or just be doing less work there.
Another thing you can do is make sure you’re not shipping unused code down to your users:
Code coverage is a feature in DevTools that allows you to discover unused JavaScript (and CSS) in your pages. Load up a page in DevTools and the coverage tab will display how much code was executed vs. how much was loaded. You can improve the performance of your pages by only shipping the code a user needs.

Tip: With coverage recording, you can interact with your app and DevTools will update how much of your bundles were used.
This can be valuable for identifying opportunities to split up scripts and defer the loading of non-critical ones until they’re needed.
If you’re looking for a pattern for serving JavaScript efficiently to your users, check out the


PRPL (Push, Render, Precache and Lazy-Load) is a pattern for aggressively splitting code for every single route, then taking advantage of a service worker to pre-cache the JavaScript and logic needed for future routes, and lazy load it as needed.
What this means is that when a user navigates to other views in the experience, there’s a good chance it’s already in the browser cache, and so they experience much more reduced costs in terms of booting scripts up and getting interactive.
If you care about performance or you’ve ever worked on a performance patch for your site, you know that sometimes you could end up working on a fix, only to come back a few weeks later and find someone on your team was working on a feature and unintentionally broke the experience. It goes a little like this:


Thankfully, there are ways we can we can try to work around this, and one way is having a performance budget in place.


Performance budgets are critical because they keep everybody on the same page. They create a culture of shared enthusiasm for constantly improving the user experience and team accountability.
Budgets define measurable constraints to allow a team to meet their performance goals. As you have to live within the constraints of budgets, performance is a consideration at each step, as opposed to an after-thought.
Based on the work by Tim Kadlec, metrics for perf budgets can include:
- Milestone timings — timings based on the user-experience loading a page (e.g Time-to-Interactive). You’ll often want to pair several milestone timings to accurately represent the complete story during page load.
- Quality-based metrics — based on raw values (e.g. weight of JavaScript, number of HTTP requests). These are focused on the browser experience.
- Rule-based metrics — scores generated by tools such as Lighthouse or WebPageTest. Often, a single number or series to grade your site.

Alex Russell had a tweet-storm about performance budgets with a few salient points worth noting:
- “Leadership buy-in is important. The willingness to put feature work on hold to keep the overall user experience good defines thoughtful management of technology products.”
- “Performance is about culture supported by tools. Browsers optimize HTML+CSS as much as possible. Moving more of your work into JS puts the burden on your team and their tools”
- “Budgets aren’t there to make you sad. They’re there to make the organization self-correct. Teams need budgets to constrain decision space and help hitting them”
Everyone who impacts the user-experience of a site has a relationship to how it performs.


Performance is more often a cultural challenge than a technical one.
Discuss performance during planning sessions and other get-togethers. Ask business stakeholders what their performance expectations are. Do they understand how perf can impact the business metrics they care about? Ask eng. teams how they plan to address perf bottlenecks. While the answers here can be unsatisfactory, they get the conversation started.

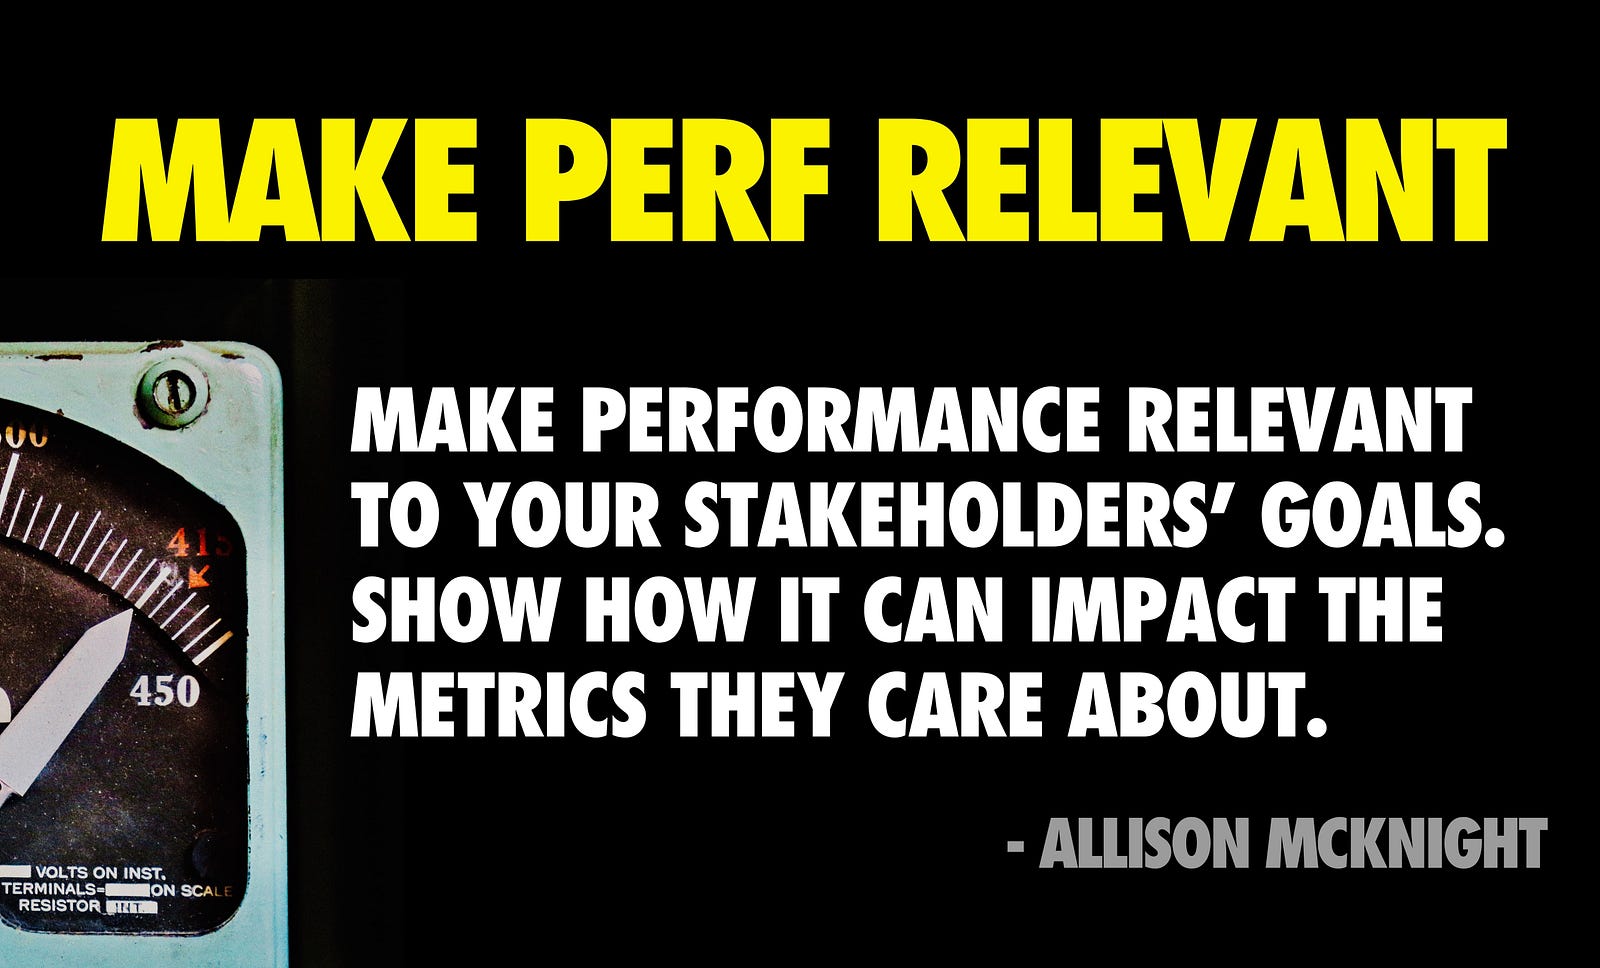
Here’s an action plan for performance:- Create your performance vision. This is a one-page agreement on what business stakeholders and developers consider “good performance”- Set your performance budgets. Extract key performance indicators (KPIs) from the vision and set realistic, measurable targets from them. e.g. “Load and get interactive in 5s”. Size budgets can fall out of this. e.g “Keep JS < 170KB minified/compressed”- Create regular reports on KPIs. This can be a regular report sent out to the business highlighting progress and success.
Web Performance Warrior by Andy Still and Designing for Performance by Lara Hogan are both excellent books that discuss how to think about getting a performance culture in place.
What about tooling for perf budgets? You can setup Lighthouse scoring budgets in continuous integration with the Lighthouse CI project:


A number of performance monitoring services support setting perf budgets and budget alerts including Calibre, Treo, Webdash and SpeedCurve:

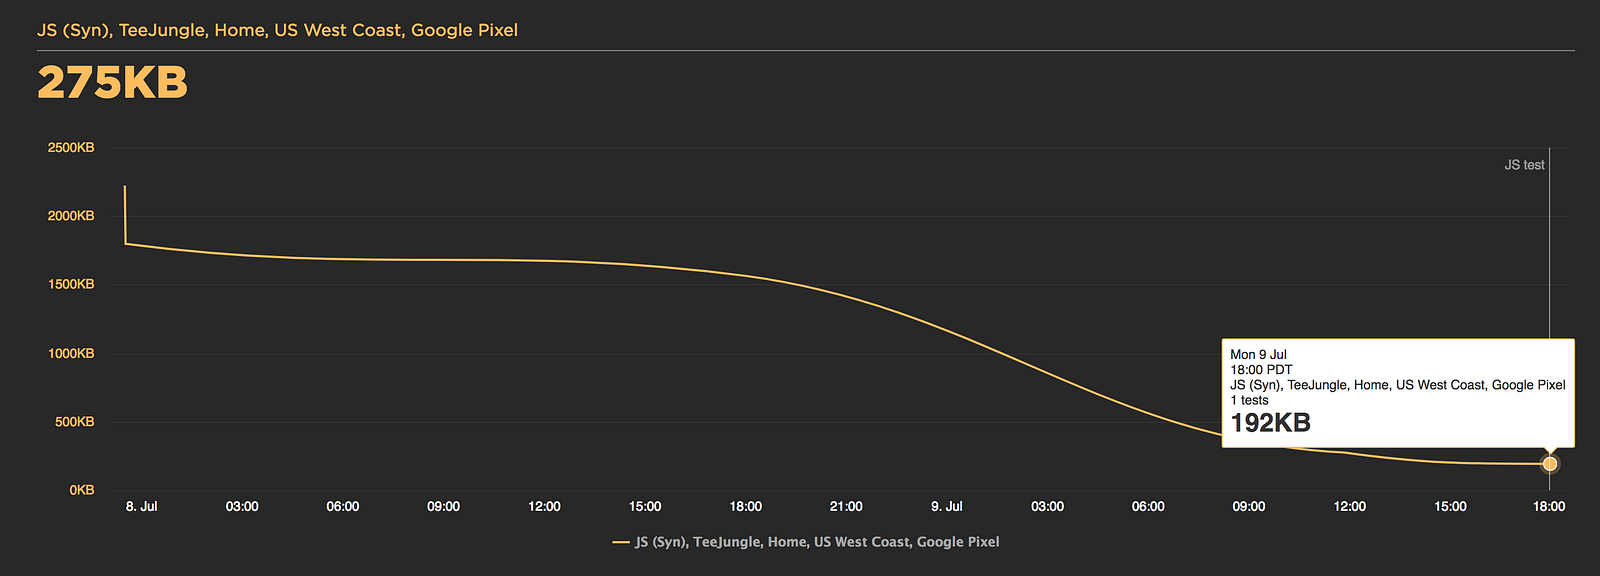
Embracing performance budgets encourages teams to think seriously about the consequences of any decisions they make from early on in the design phases right through to the end of a milestone.
Looking for further reference? The U.S Digital Service document their approach to tracking performance with Lighthouse by setting goals and budgets for metrics like Time-to-Interactive.
Next up..
To track the impact JavaScript can have on user-experience in a RUM (Real User Monitoring) setting, there are two things coming to the web I’d recommend checking out.

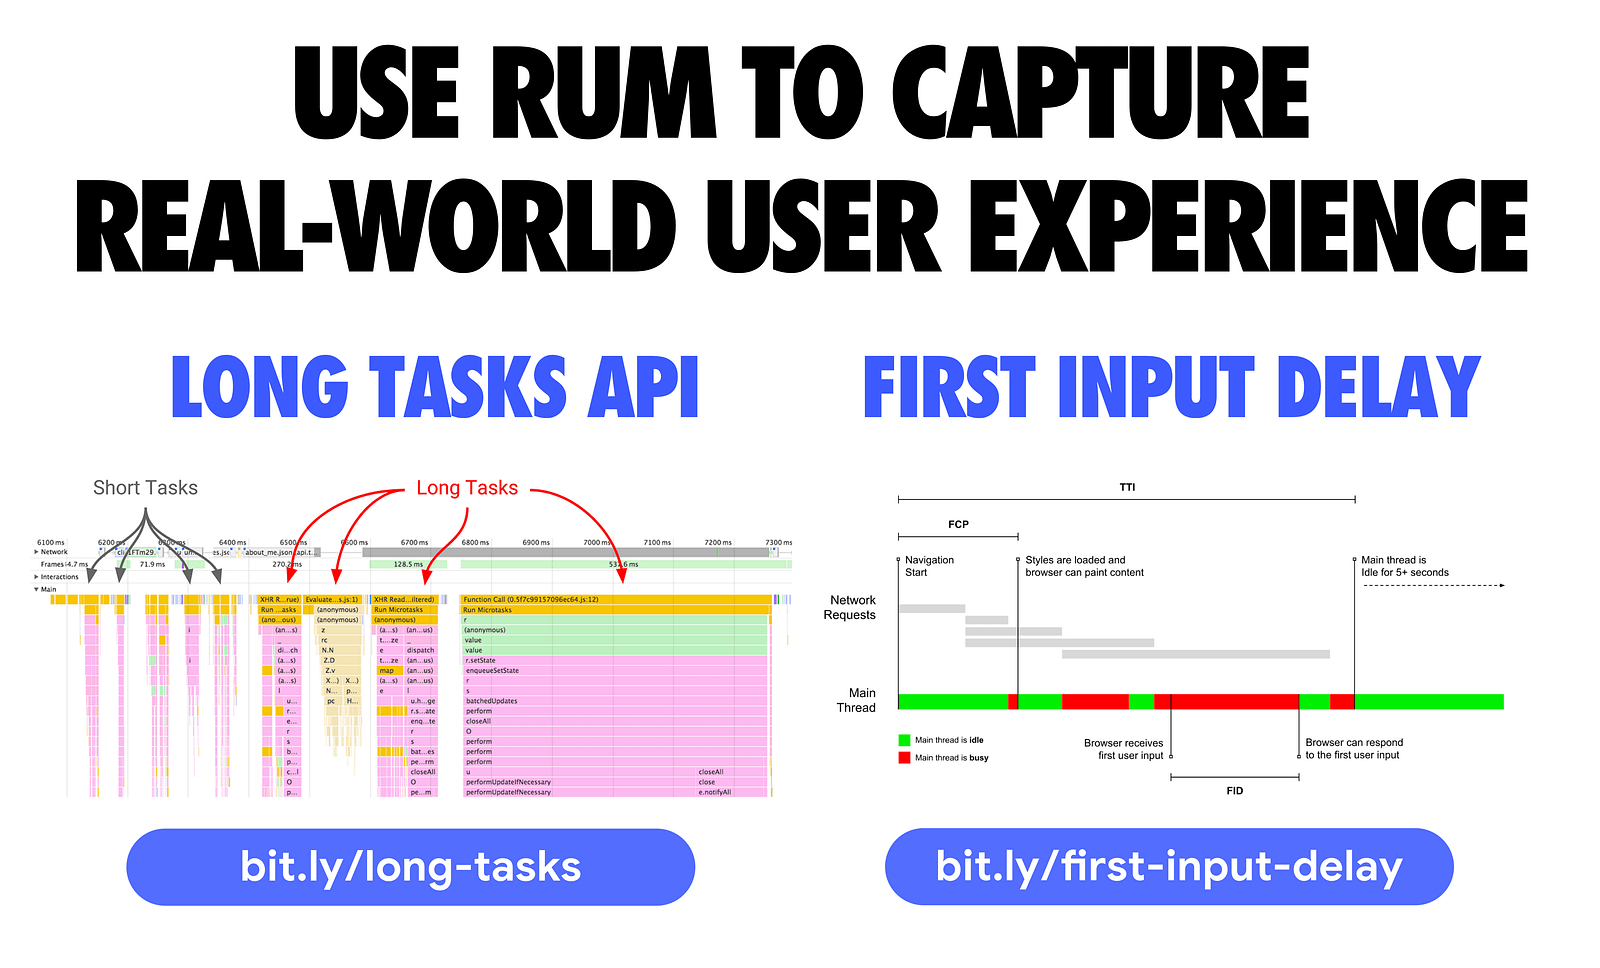
The first is Long Tasks — an API enabling you to gather real-world telemetry on tasks (and their attributed scripts) that last longer than 50 milliseconds that could block the main thread. You can record these tasks and log them back to your analytics.
First Input Delay (FID) is a metric that measures the time from when a user first interacts with your site (i.e. when they tap a button) to the time when the browser is actually able to respond to that interaction. FID is still an early metric, but we have a polyfill available for it today that you can check out.

Between these two, you should be able to get enough telemetry from real users to see what JavaScript performance problems they’re running into.

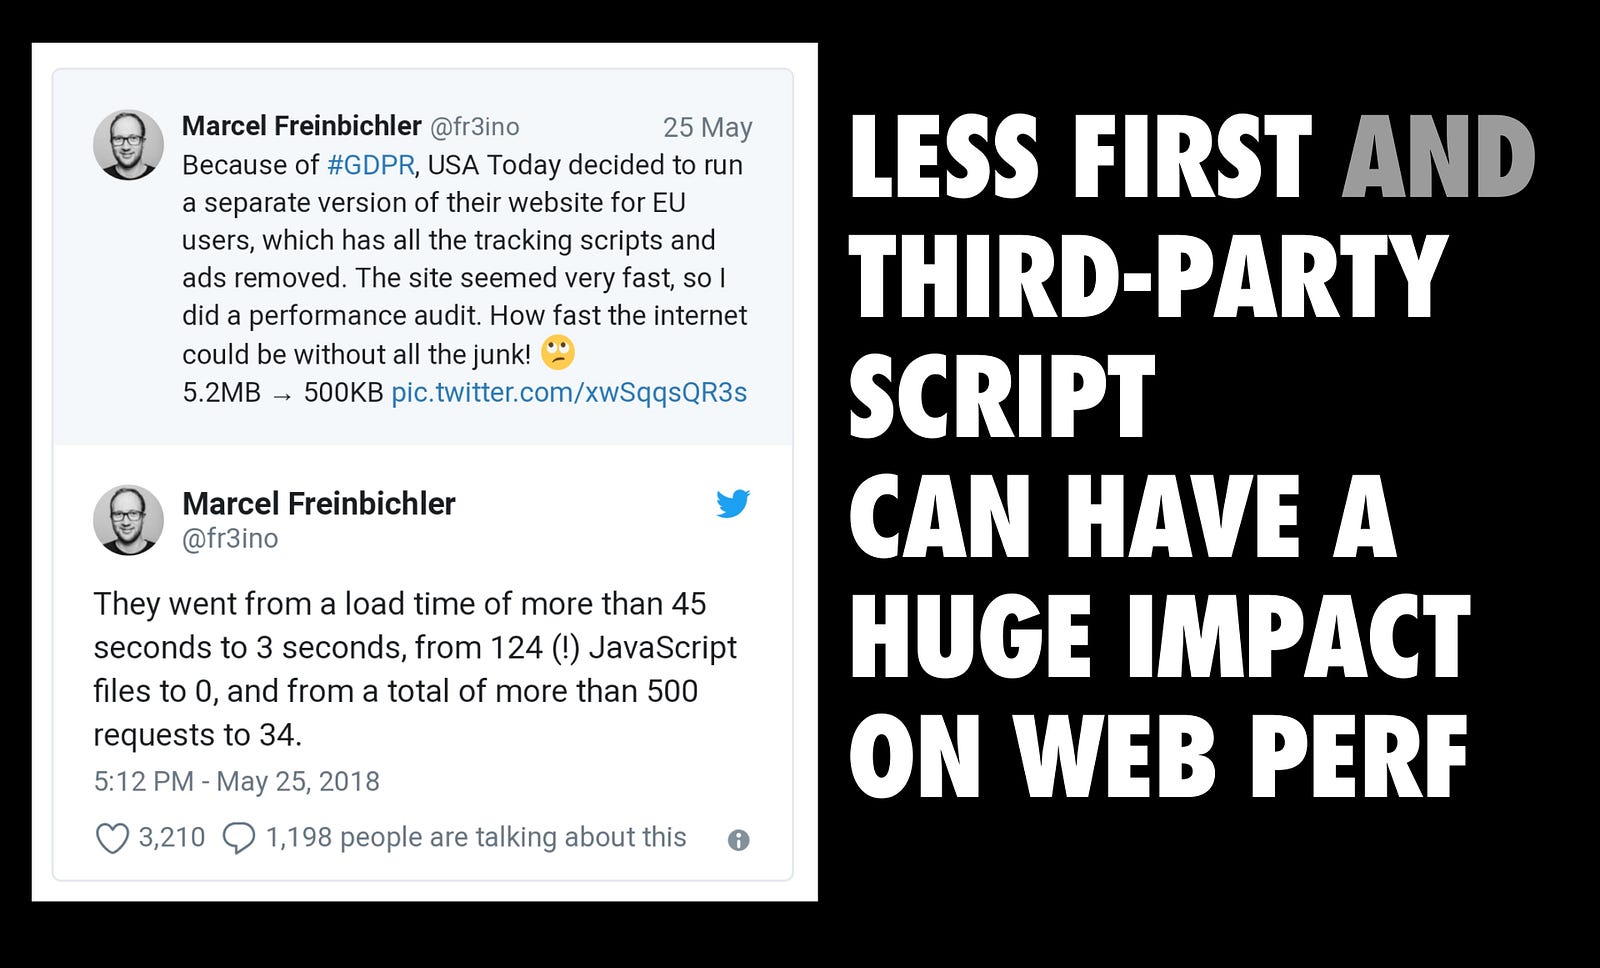
It’s well known that third-party JavaScript can have a dire impact on page load performance. While this remains true, it’s important to acknowledge that many of today’s experiences ship a lot of first-party JavaScript of their own, too. If we’re to load fast, we need to chip away at the impact both sides of this problem can have on the user experience.
There are several common slip-ups we see here, including teams using blocking JavaScript in the document head to decide what A/B test to show users. Or, shipping the JS for all variants of an A/B test down, even if only one is going to actually be used ?

We have a separate guide on loading Third-party JavaScript if this is currently the primary bottleneck you’re experiencing.
Get fast, stay fast.
Performance is a journey. Many small changes can lead to big gains.
Enable users to interact with your site with the least amount of friction. Run the smallest amount of JavaScript to deliver real value. This can mean taking incremental steps to get there.
In the end, your users will thank you.
