
使用Python對Sigmoid、Tanh、ReLU三種啟用函式繪製曲線
-
Sigmoid啟用函式

import math
import numpy as np
import matplotlib.pyplot as plt
x = np.arange(-10,10)
a=np.array(x)
y1=1/(1+math.e**(-x))
y2=math.e**(-x)/((1+math.e**(-x))**2)
plt.xlim(-11,11)
ax = plt.gca() # get current axis 獲得座標軸物件
ax.spines['right'].set_color('none')
ax.spines['top'].set_color('none') # 將右邊 上邊的兩條邊顏色設定為空 其實就相當於抹掉這兩條邊
ax.xaxis.set_ticks_position('bottom')
ax.yaxis.set_ticks_position('left') # 指定下邊的邊作為 x 軸 指定左邊的邊為 y 軸
ax.spines['bottom'].set_position(('data', 0)) #指定 data 設定的bottom(也就是指定的x軸)繫結到y軸的0這個點上
ax.spines['left'].set_position(('data', 0))
plt.plot(x,y1,label='Sigmoid',linestyle="-", color="blue")#label為標籤
plt.plot(x,y2,label='Deriv.Sigmoid',linestyle="--", color="red")#l
#plt.legend(loc=0,ncol=2)
plt.legend(['Sigmoid','Deriv.Sigmoid'])
plt.savefig('plot_test.png', dpi=500) #指定解析度
-
Tanh啟用函式

import math
import numpy as np
import matplotlib.pyplot as plt
x = np.arange(-10,10)
a=np.array(x)
y1=(math.e**(x)-math.e**(-x))/(math.e**(x)+math.e**(-x))
plt.xlim(-11,11)
ax = plt.gca() # get current axis 獲得座標軸物件
ax.spines['right'].set_color('none')
ax.spines['top'].set_color('none') # 將右邊 上邊的兩條邊顏色設定為空 其實就相當於抹掉這兩條邊
ax.xaxis.set_ticks_position('bottom')
ax.yaxis.set_ticks_position('left') # 指定下邊的邊作為 x 軸 指定左邊的邊為 y 軸
ax.spines['bottom'].set_position(('data', 0)) #指定 data 設定的bottom(也就是指定的x軸)繫結到y軸的0這個點上
ax.spines['left'].set_position(('data', 0))
plt.plot(x,y1,label='Tanh',linestyle="-", color="green")#label為標籤
plt.legend(['Tanh'])
plt.savefig('Tanh.png', dpi=500) #指定分辨
-
ReLU啟用函式
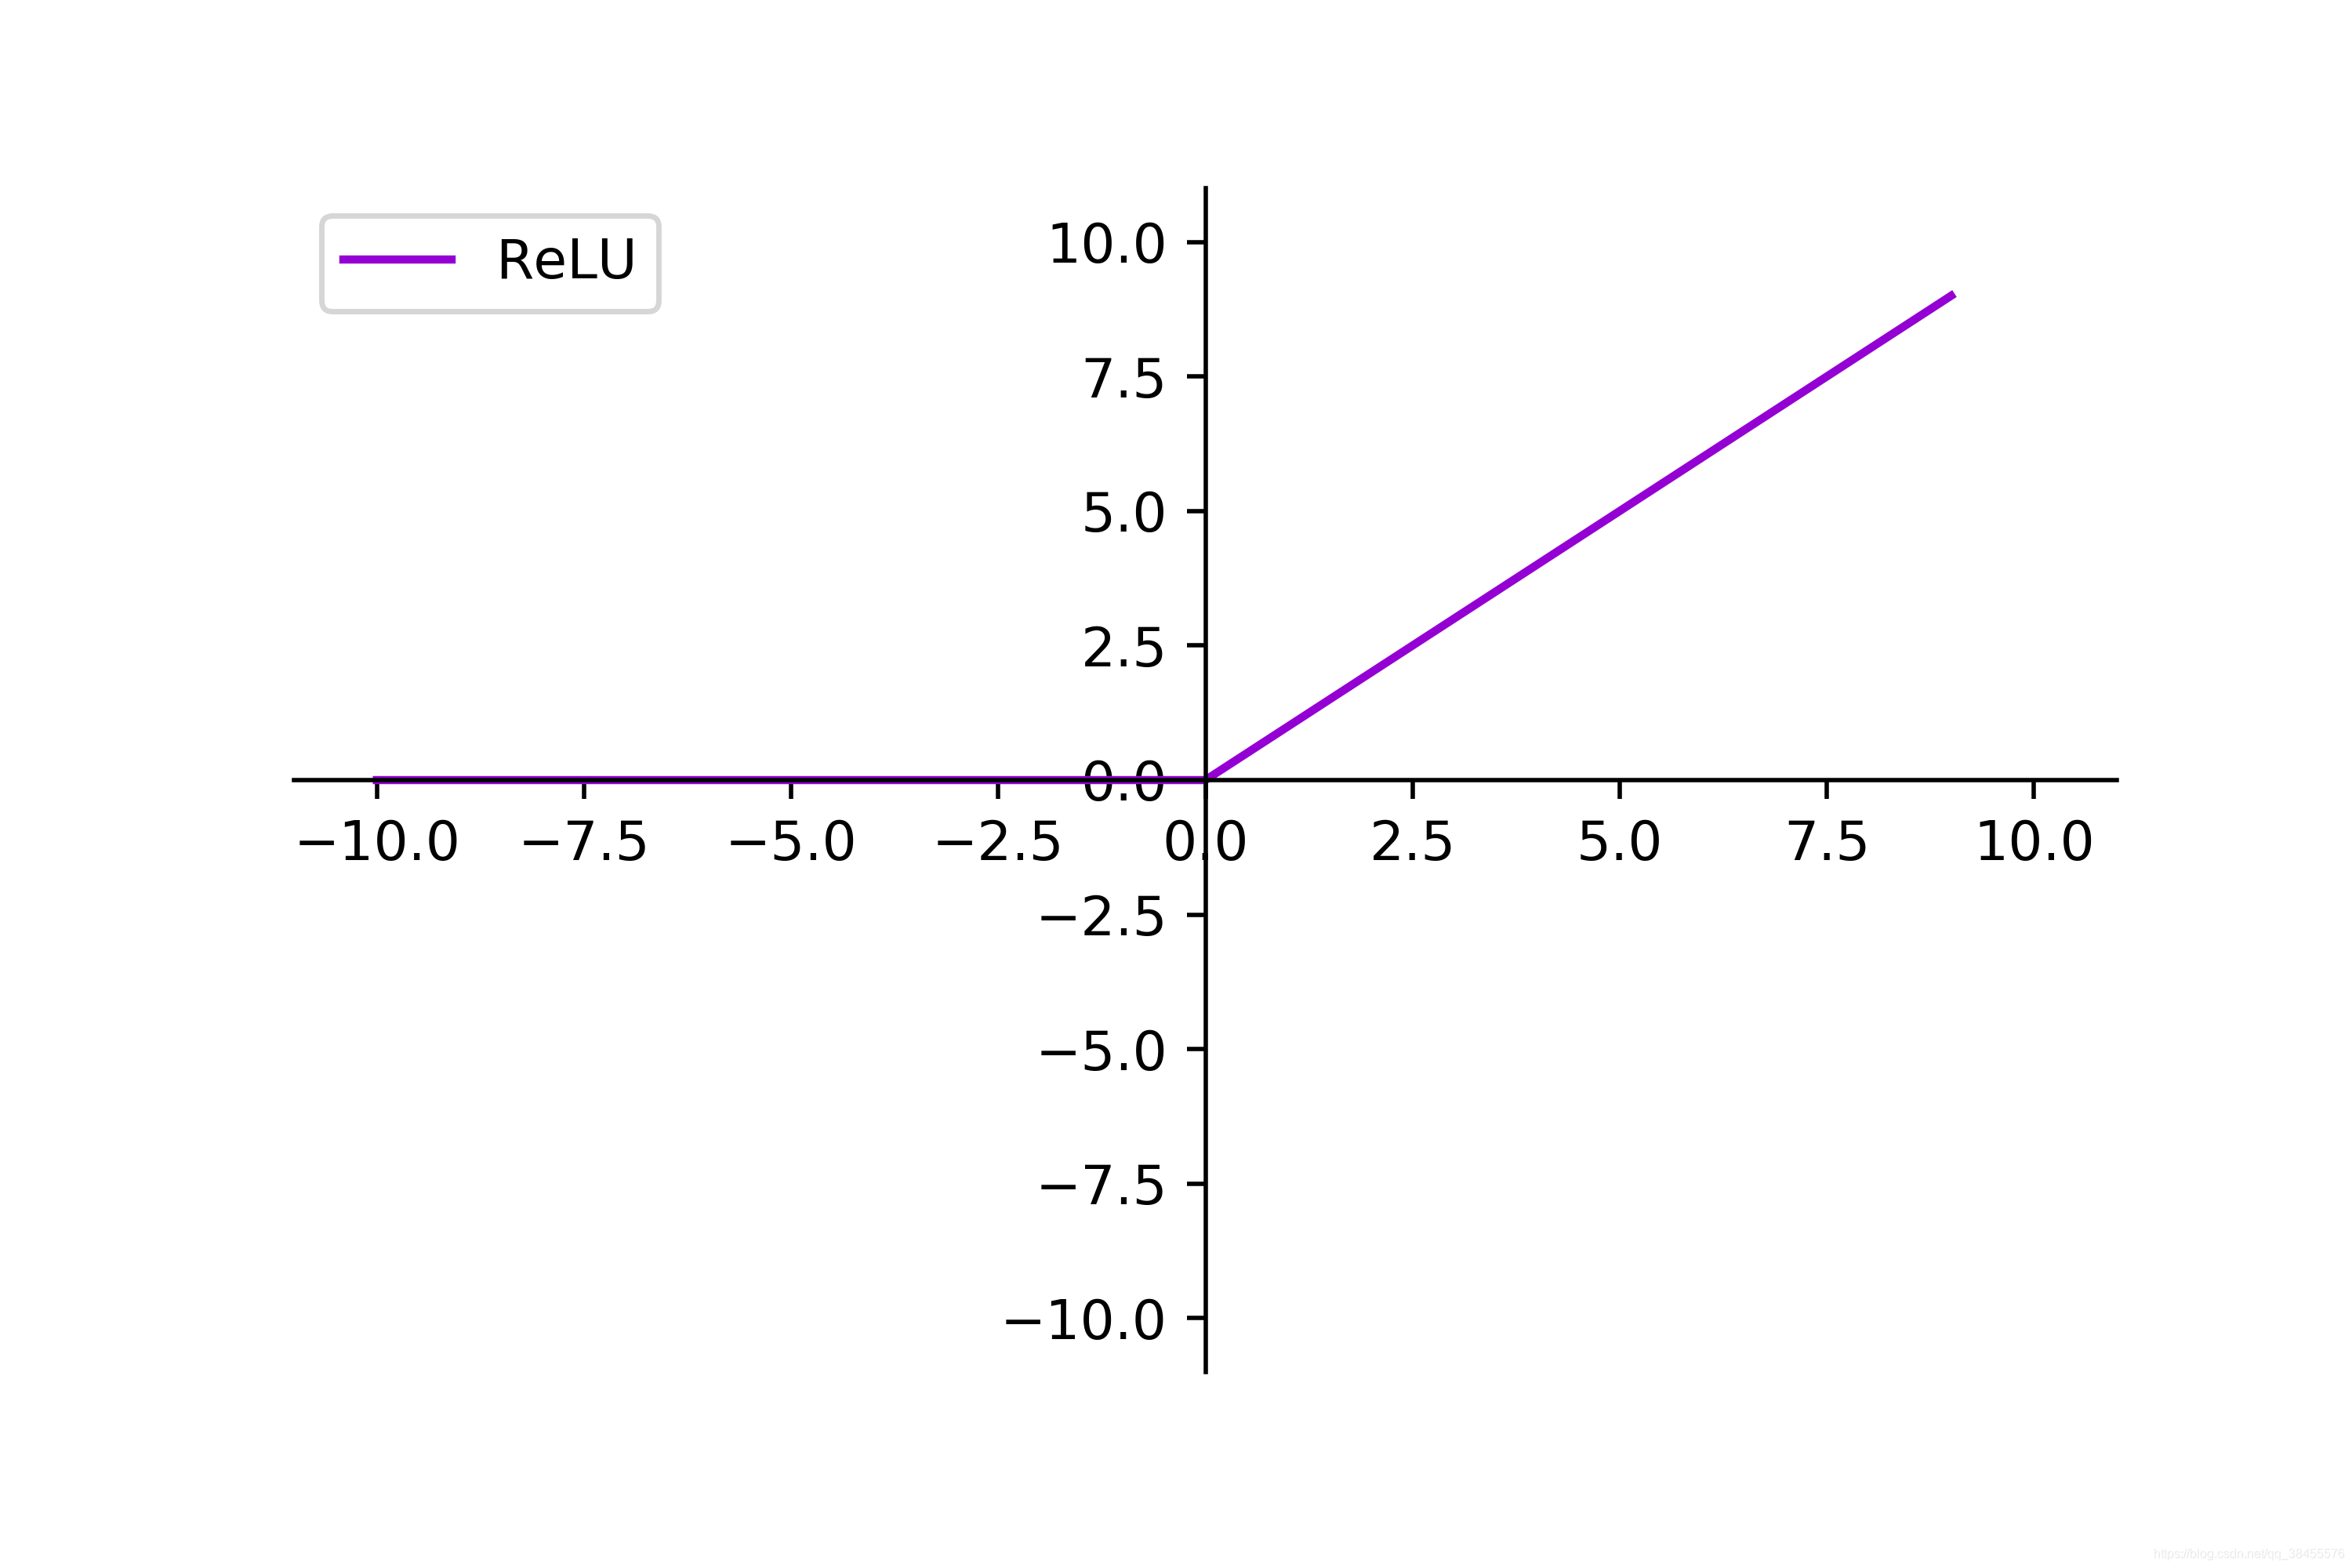
import numpy as np
import matplotlib.pyplot as plt
fig = plt.figure(figsize=(6,4))
ax = fig.add_subplot(111)
x = np.arange(-10, 10)
y = np.where(x<0,0,x)#滿足條件(condition),輸出x,不滿足輸出y
plt.xlim(-11,11)
plt.ylim(-11,11)
ax = plt.gca() # get current axis 獲得座標軸物件
ax.spines['right'].set_color('none')
ax.spines['top'].set_color('none') # 將右邊 上邊的兩條邊顏色設定為空 其實就相當於抹掉這兩條邊
ax.xaxis.set_ticks_position('bottom')
ax.yaxis.set_ticks_position('left') # 指定下邊的邊作為 x 軸 指定左邊的邊為 y 軸
ax.spines['bottom'].set_position(('data', 0)) #指定 data 設定的bottom(也就是指定的x軸)繫結到y軸的0這個點上
ax.spines['left'].set_position(('data', 0))
plt.plot(x,y,label='ReLU',linestyle="-", color="darkviolet")#label為標籤
plt.legend(['ReLU'])
plt.savefig('ReLU.png', dpi=500) #指定分辨