
Experimentation & Measurement for Search Engine Optimization
However, it is a common trap to overstate statistical significance when analyzing times series data in a difference-in-differences framework. This is because without any correction of our standard errors, we’re basically assuming that each additional day of traffic data for a given page is independent from the previous traffic information that we have already collected. However, this assumption is faulty, since we expect the traffic to have a high serial correlation within a specific specific market over time.
Therefore, to lower our Type I error, in our model we cluster the standard errors at the URL-level to correct for this serial correlation, where our variance-covariance matrix for our model coefficients is calculated as:


Where nᵤ is the number of URLs, and eᵢ is the raw residual for the iᵗʰ observation. When there is a correlation of traffic within canonical URLs across days, this causes the standard errors of our coefficients to increase. Therefore we effectively become more strict with our criterion to declare an experiment significant. As a result, we can be more confident that the experiments that with statistically significant estimators are more likely to be true positives.
Measuring Power
Before we launch an experiment, it’s important that we understand our statistical power. Since we mainly just care about the b₂ estimator, we are essentially carrying out the hypothesis test


where our power is defined as:

In other words, we’d like to know the probability of being able to detect a treatment effect in the case that there truly is one. If the power of our experiment is very low, then it may be useless if we’re not able to measure anything.
There are a number of ways to estimate power, one of the most common being a simulation-based estimation.

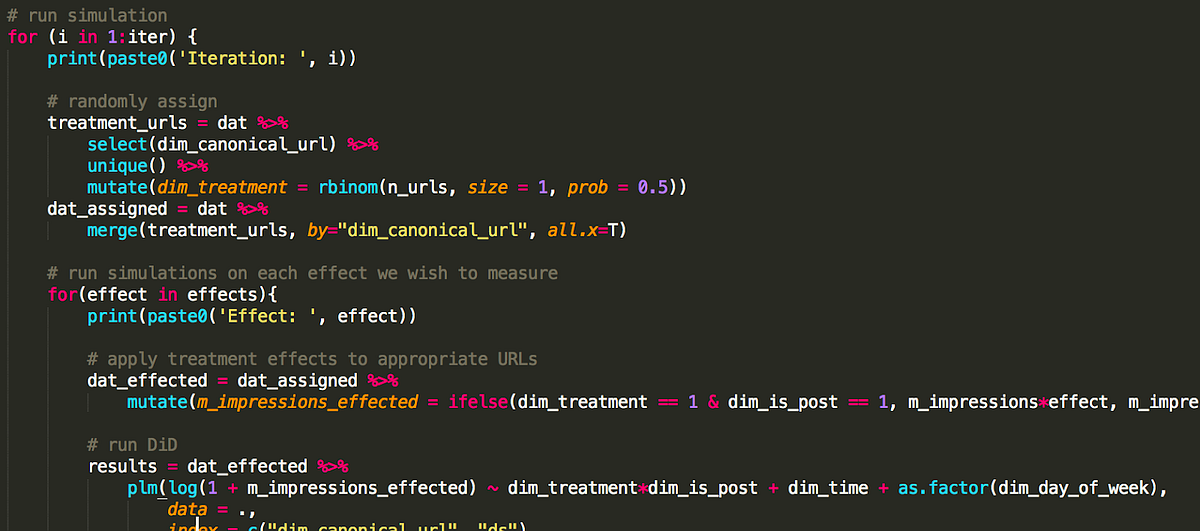
Using historical traffic data, we can run a set of simulations in which we randomly assign canonical URLs to treatment & control, and apply varying levels of traffic lifts to the treatment group in a predefined time period. We can then run our model on these data and see how many times we can detect the effect to a specific degree of statistical significance.
Using these simulated results, we can then plot how many times the model measured a statistically significant difference across different treatment effects:

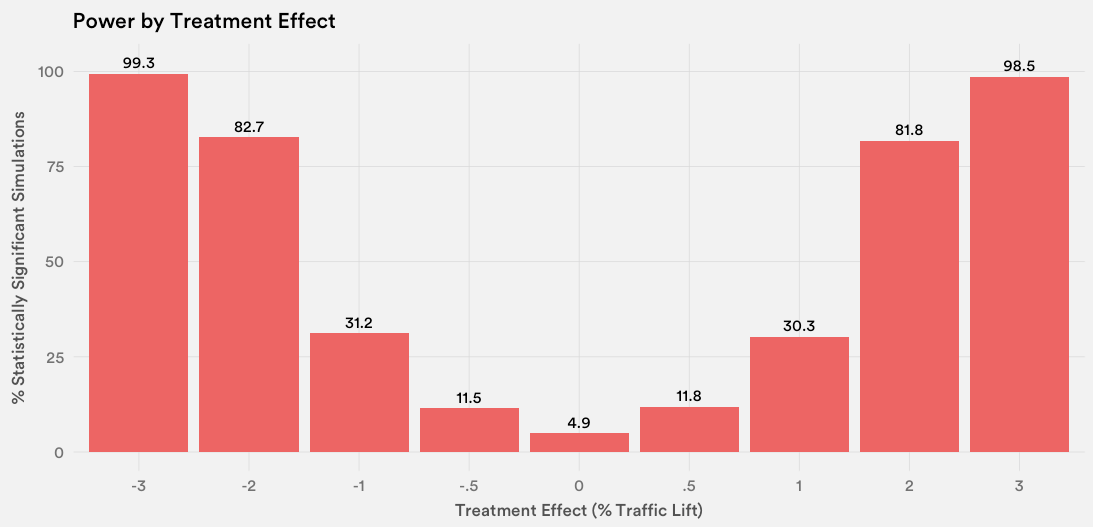
Given that we’d ideally have at least 80% power, our experiment likely has enough power in scenarios in which the treatment effect is around 2% or greater. This is quite a granular detectable difference, and given that we expect Magic Carpet’s effect to be on the order of multiple percentage points, we conclude that this model has enough power for us to run a full-fledged URL-level experiment.
Launching the Experiment
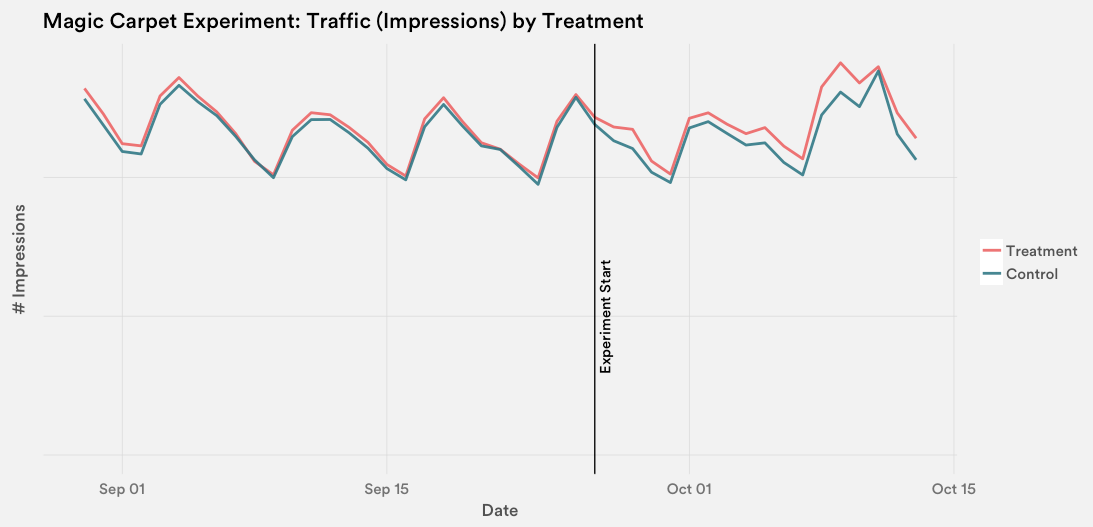
Once we set up our model with the appropriate assumptions and asserted that we had sufficient power to run a test, we launched the Magic Carpet experiment and randomly released the new design to half of our landing pages. The test lasted three weeks, in which we saw a visible lift in traffic:

When we ran our differences-in-differences model, we found that there was in fact a statistically significant positive result:

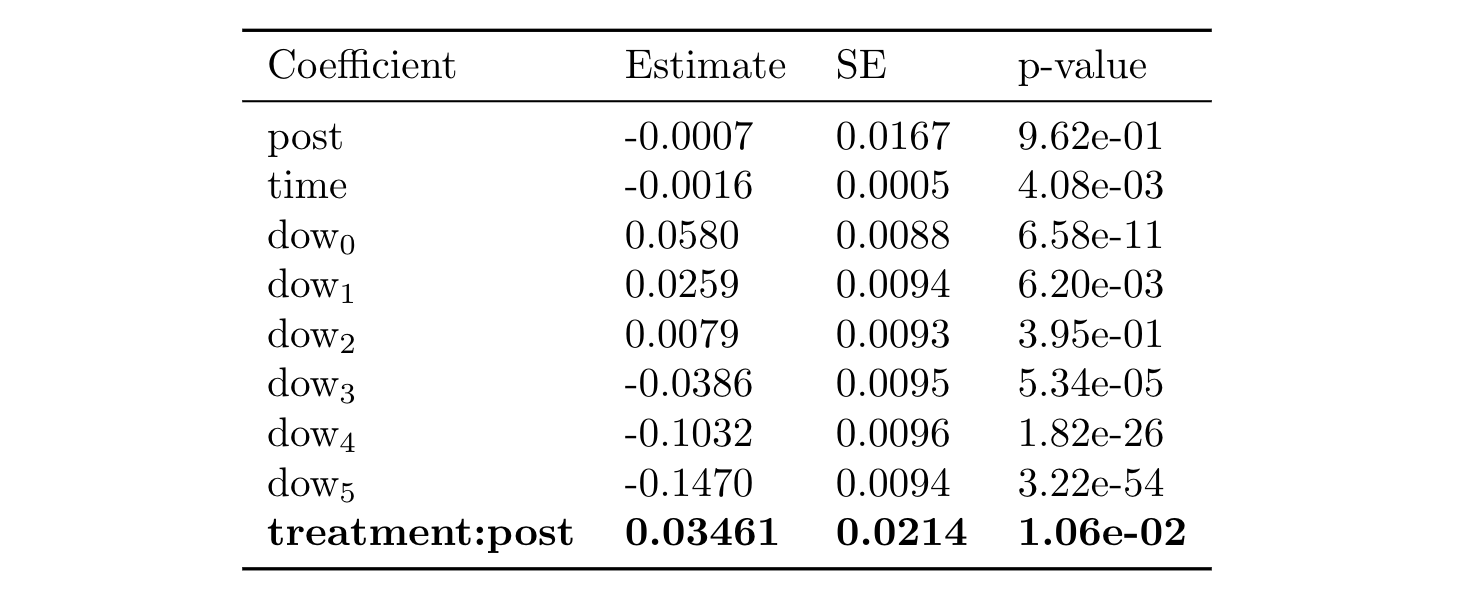
Because we applied a log transformation to our outcome traffic variable, this allows us to interpret our coefficient in terms of a percentage: a b₂ coefficient of .0346 means that Magic Carpet resulted in a (1 - e^(.0346)) = 3.52% increase in traffic. This may not seem large at first, but consider that this equates to tens of millions of additional visitors a day! After this testing period, we decided to launch Magic Carpet to 100% of our search results landing pages, and for the last year we have continuously iterated on designs using this same experimentation framework.
Final Thoughts
Approaching our SEO landing page experiments through a market-level framework has proven to be very useful for measuring effectiveness of changes to our product in terms of search engine rankings. In fact, we were able to scale this framework using our using our open-sourced Airflow scheduler to automate the analysis of over 20 experiments, ranging from sweeping design changes to small HTML tweaks.
Yet there is always room for improvement. Investing in tracking our exact search engine rankings would allow for a more granular outcome variable in our model, rather than using traffic as a proxy. In addition, there are plenty of other models utilized in market-level experiments, such as synthetic controls, that could be considered beyond our differences-in-differences approach.
However, regardless of the exact model used, the same lessons and key learnings apply. When making inferences on a given treatment effect, we must always make sure that (1) our experimentation model has the correct assumptions baked in, especially when failing to do so could result in a Type II error, and (2) the test has sufficient power to detect a treatment effect, so that we can ensure that our Type I error rate is not too high. When such frameworks are used correctly, they can be used as impressive tools for measurement.