You Don’t Need a Diversified Crypto Portfolio: Here’s Why
You Don’t Need a Diversified Crypto Portfolio: Here’s Why
Apart from a few outlier situations, the top cryptocurrencies are very closely correlated with Bitcoin; as a result, the idea of diversifying a portfolio to spread risk is really only a myth in my opinion. This article examines the correlation between cryptocurrency prices to explain my reasoning.
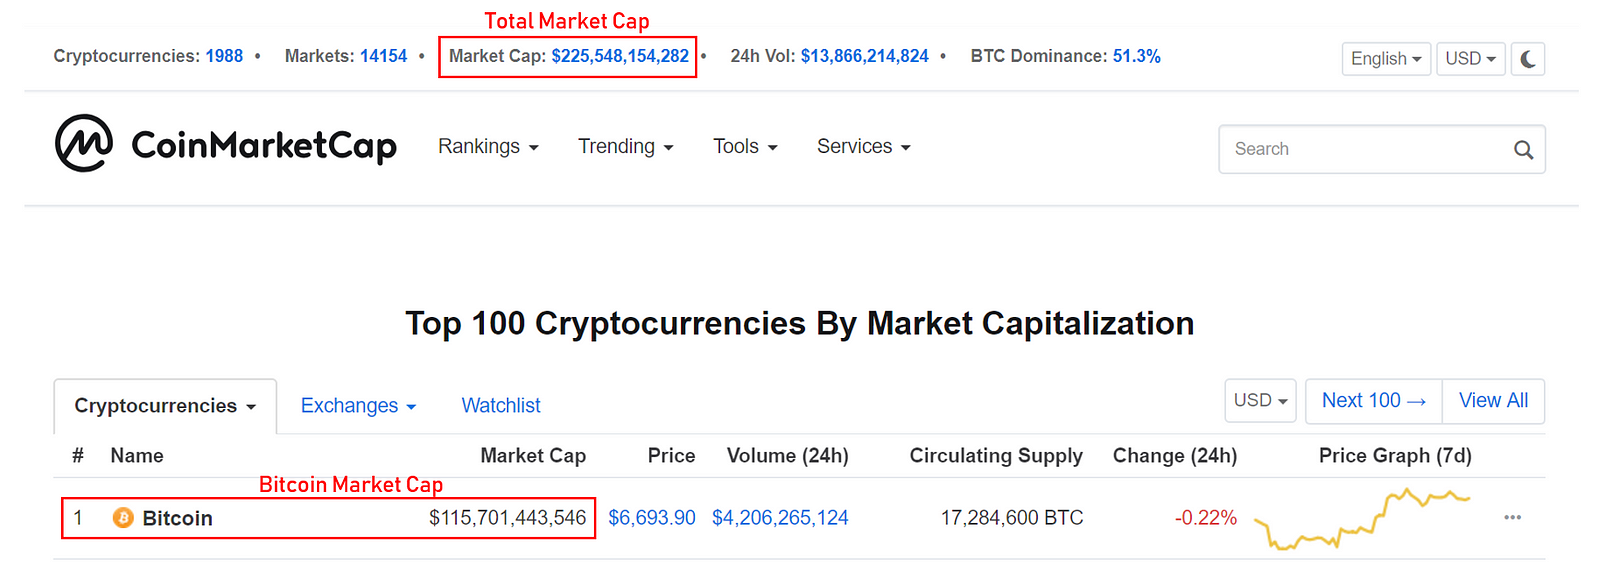
There’s a lot of misinformation, rumors, and just plain incorrect information out there about cryptocurrency. In fact, I think one of the most misleading labels in the cryptocurrency market is this idea of Bitcoin dominance, which is represented as Bitcoin’s percentage ownership of the entire market cap of cryptocurrency. You can find it on legitimate websites like CoinMarketCap, and while it’s a fair idea, I think the label it’s given creates a misconception about how the cryptocurrency market works. Simply put, Bitcoin Dominance is calculated as:


On September 23, 2018, CoinMarketCap reported Bitcoin’s dominance to be 51.3% because it has a total market cap of $115.7 billion, while the Total Market Cap is $225.5 billion. 115.7/225.5 = 0.513, or 51.3%.
But that number couldn’t be further from the truth. Bitcoin’s actual dominance extends much deeper into the entire market — any cryptocurrency trader can confirm this from watching Bitcoin historically make or break their entire portfolio.


I ran some correlation comparisons to see exactly how much of a hold BTC commands. Litecoin, Ethereum, and Ripple all showed signs of extremely strong correlation with Bitcoin prices between 2016 and 2018.
Normally when comparing the correlation between two items, any number between 0.7 to 1.0 indicates a strong positive correlation; in other words, between those two numbers, it’s a really strong likelihood that you have a powerful relationship between the two. With a positive, powerful relationship (which we call positive correlation), when the number of one item goes up, the other one goes up, and vice versa.
That being said, Bitcoin’s price correlation was 0.954 for Litecoin, 0.916 for Ethereum, and 0.836 for Ripple between 2016 and 2018. Litecoin and Ethereum are both trade-able cryptocurrencies on Coinbase, which is arguably the largest fiat-to-crypto direct exchange in existence right now, which can account for the strong correlation with Bitcoin prices — everyone cashes in and cashes out at the same time.
Ripple is an interesting representative case for altcoins that exist outside of the realm of direct fiat-to-crypto exchanging, as it can only be found on exchanges that have not historically accepted fiat. This means that users have to go through an extra step of moving Bitcoin from a place like Coinbase into an exchange like Binance.
From a purely psychological perspective, that extra step may indicate a much stronger desire to actually purchase Ripple than the other two. For example, on Coinbase, you might think, “Sure, I’ll put some into Ethereum and Litecoin too, why not?” but because Ripple isn’t on Coinbase, you wouldn’t buy any of it — unless you actually wanted to. Then you’d have to learn how to move your funds out of Coinbase into an exchange that trades Ripple.
Even with an arguably more adamant and determined investor pool, though, Ripple’s correlation with Bitcoin prices between 2016 to 2018 still came out to 0.836.
Skeptics might argue that Bitcoin’s influence over the price of other coins was much stronger before than it is today, but by going back to 2016 I’m unfairly weighing irrelevant historical data to spread fear, uncertainty, and doubt (FUD — a favorite acronym of the crypto trolls) about altcoins.
But first of all, I’m not here to shit on altcoins. I hold many myself, and I have Ripple. I’m only here to ground you in reality — sure, coins may “moon” at some point, but apart from those outlier incidents, their prices will be directly influenced by Bitcoin.
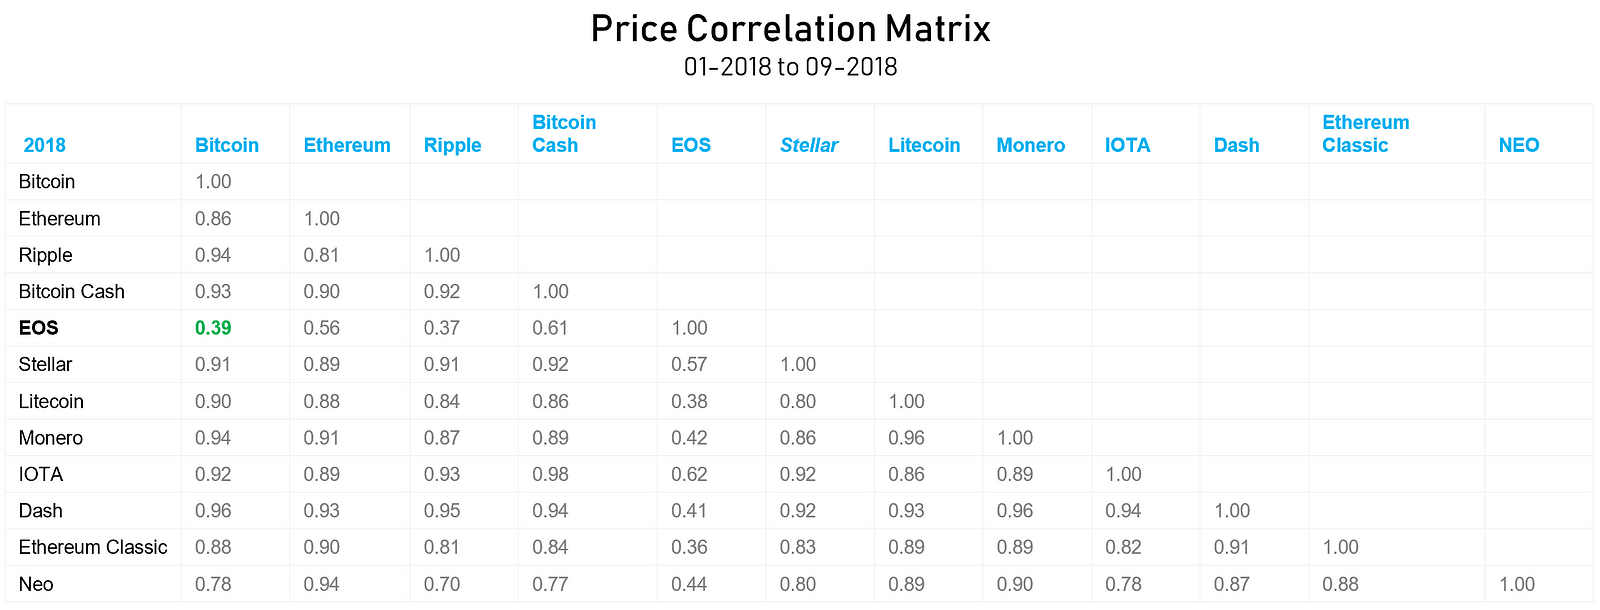
Second, and more importantly, Bitcoin’s influence over the price of other coins has become stronger today than it was years ago. In the chart below, I’ve created a correlation matrix between some of the top coins in the market today: Bitcoin, Ethereum, Ripple, Stellar, Litecoin, Monero, and Dash.


In 2016, the correlation of prices between each currency was very loose. In fact, if I recall correctly, you couldn’t even purchase Ripple except through this sketchy website called Gatehub. And I think you had to use fiat to purchase, but because that would be a problem for US citizens, I don’t think my account was ever verified. The details are a bit hazy and a bit of a tangent, but the point is, in 2016, altcoin prices were pretty loosely correlated Bitcoin. Only Litecoin, Monero, and Dash really showed any moderate correlation with Bitcoin. By stock-price standards, one might argue that it is still pretty strongly correlated, but when comparing with the latter years, 0.6–0.7 looks pretty decent.
The Bull Run
2017, which marks the start of the most recent cryptocurrency bull run, pretty much turned every altcoin into a planet with Bitcoin as the giant star in the center. Notice that correlation shot up dramatically, with only Ripple showing some resistance to Bitcoin pricing.
Near the end of 2017, Ripple reacted quite dramatically to Bitcoin’s price pump by providing a pump of its own. Ripple, which has an enterprise entity that is establishing strong partnerships with many financial institutions globally, showed some of the strongest resistance to Bitcoin price changes in that year.
Its competitor, Stellar (ironically founded by former founder and CTO of Ripple), also demonstrated resistance — the correlation between those two coins was 0.9, which seems to indicate a universal sentiment across both currencies — e.g., when investors were confident in Ripple, investors were likely to be confident in Stellar as well.
The Market Crash
In 2018, price trends shifted gears as positive market sentiment around cryptocurrency dwindled. Bitcoin prices fell from $17,000 to around $6,600 today, and the impact of this crash could be felt across the entire cryptocurrency market. During this time, correlation between cryptocurrency prices were even strong with the weight of Bitcoin’s price drops pulling everything down with it.
During 2018 (from January to September), correlation to Bitcoin prices never fell under 0.85. Interestingly enough, Litecoin and Ethereum, which demonstrated much stronger correlation with Bitcoin prices during the 2017 bull run, showed the weakest correlations with BTC throughout the crash. Whether or not it also has to do with the fact that they’re both available through Coinbase, or if you believe it’s other reasoning, feel free to elaborate in the comments section of this article.
Outliers
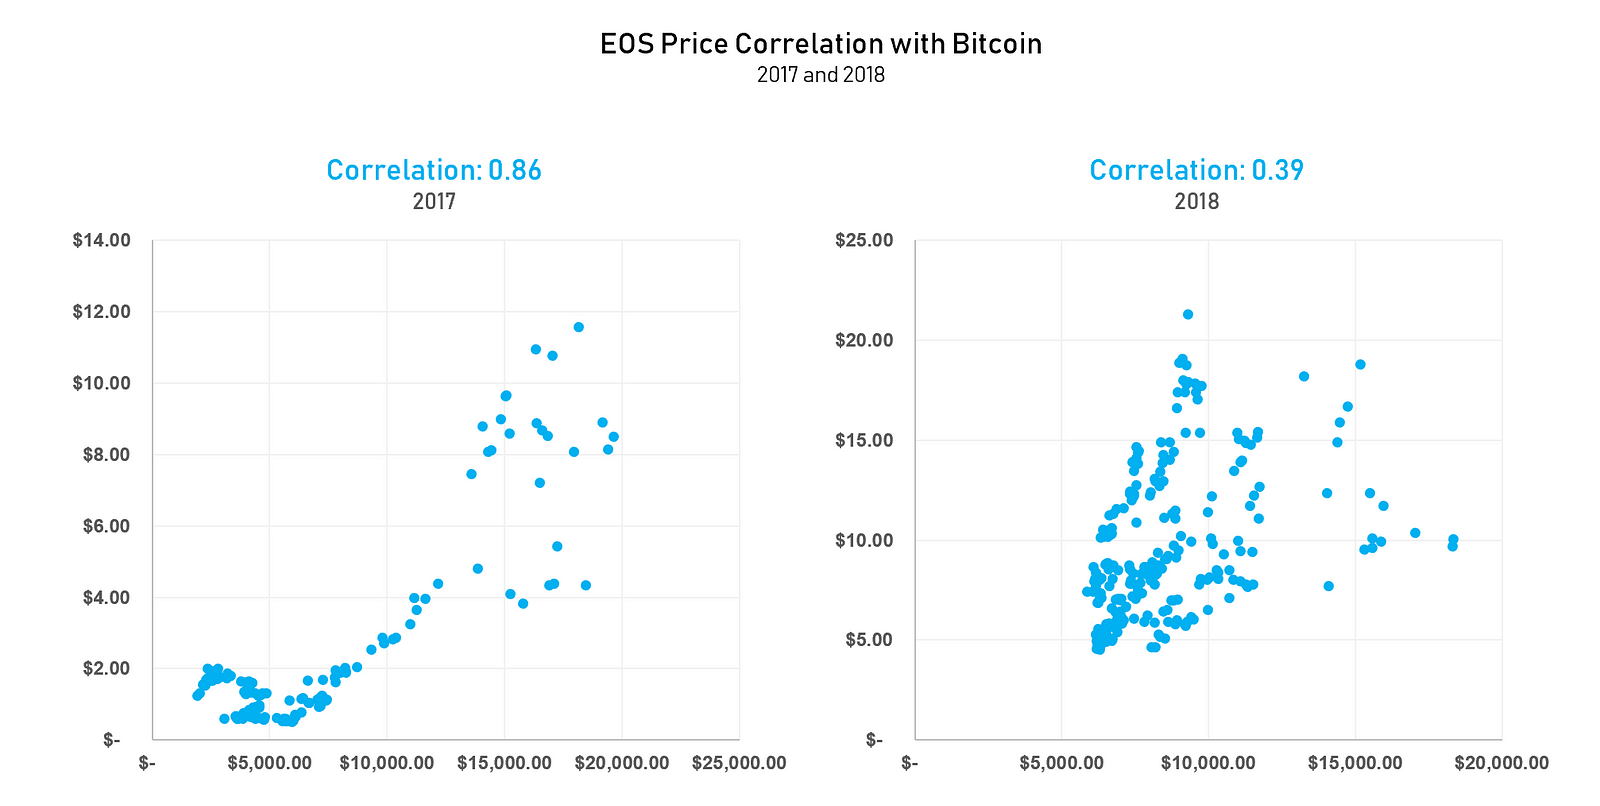
In the 2018 crash, though, while most of the major cryptocurrenies (i.e., the Top 15) demonstrated a very strong correlation with Bitcoin prices (>0.70), EOS showed really strong resistance to the trend.


In 2017, when EOS was first introduced, it demonstrated a much more positive correlation with Bitcoin prices. Its year-long ICO, which started in June 2017 and ended in June 2018, culminated with the launch of its main net. Despite its controversial nature as a cryptocurrency, it is inarguable that the coin has garnered a strong following with over $4 billion generated in its ICO.


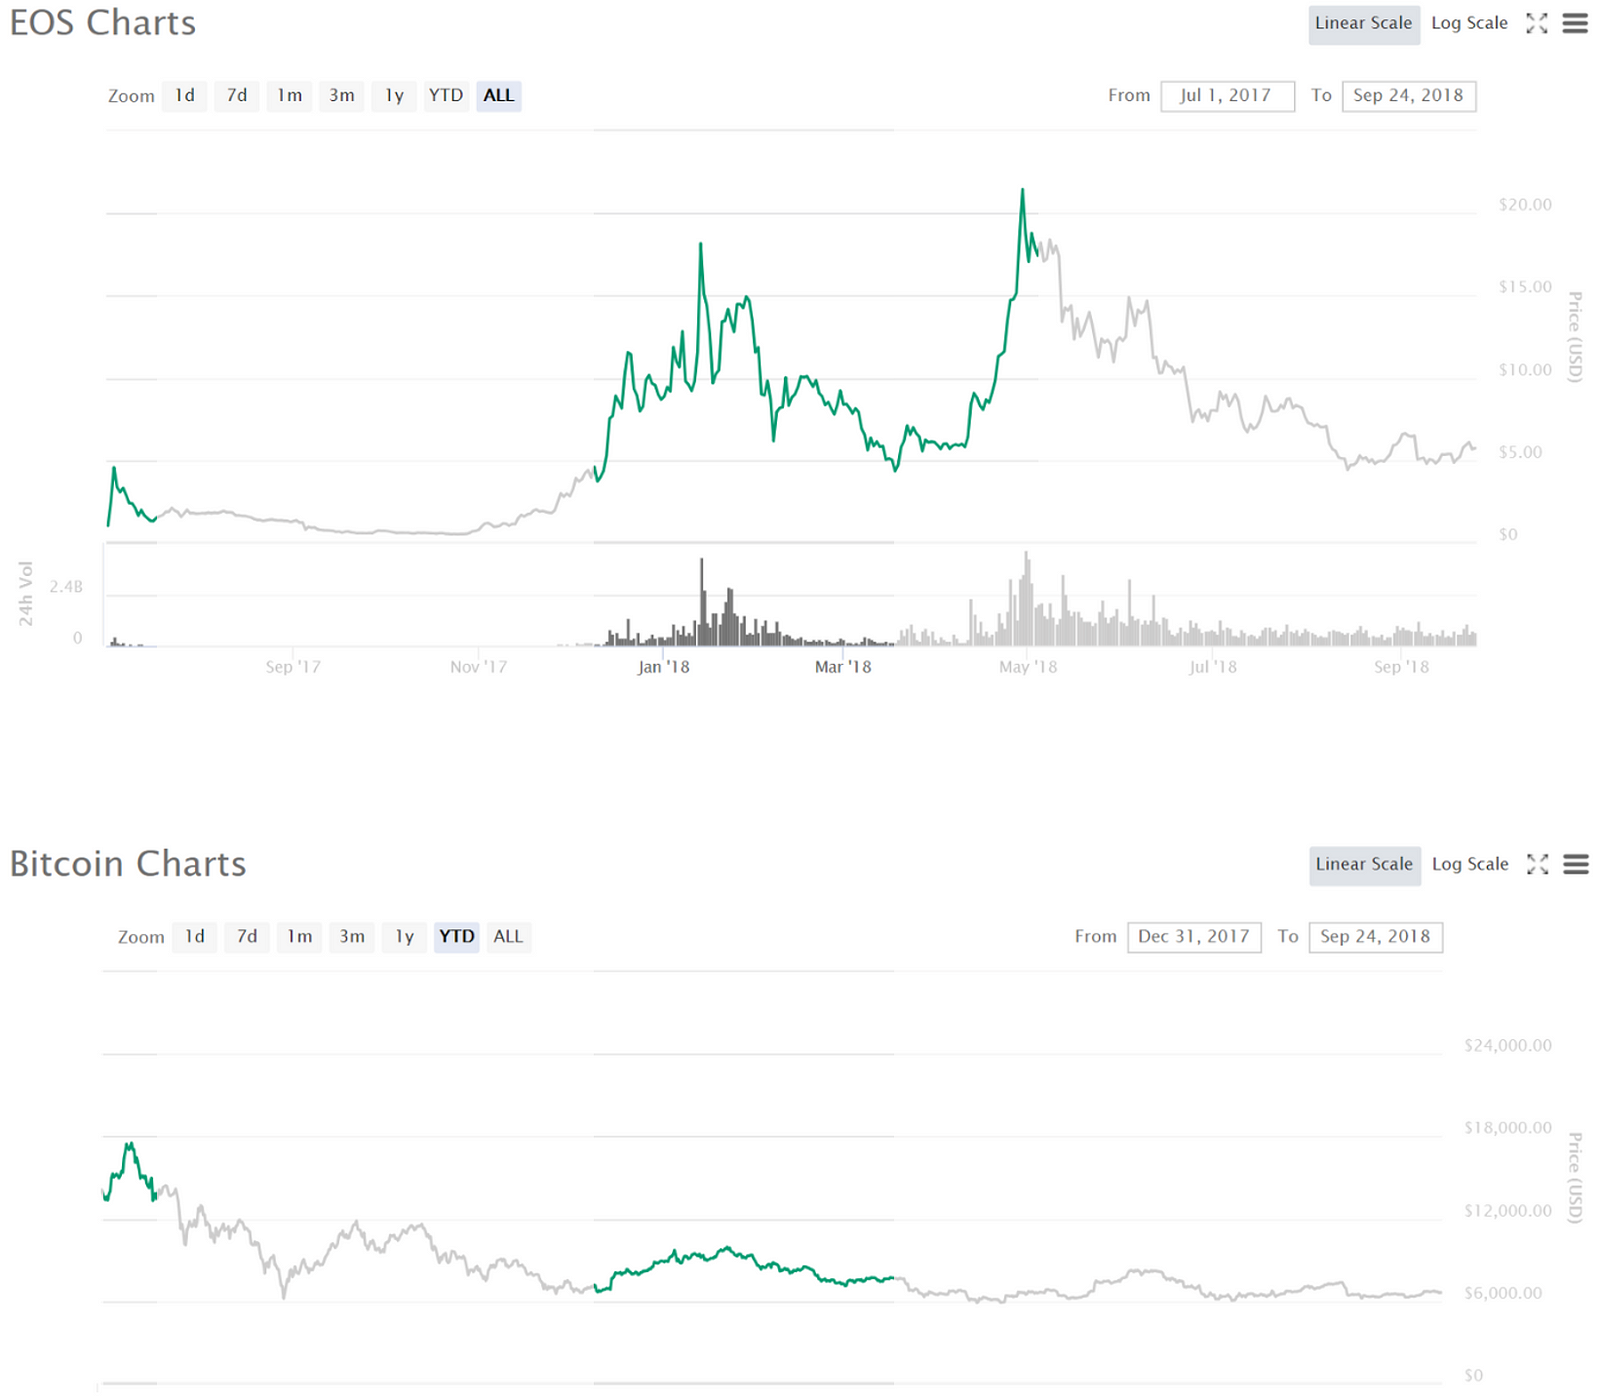
In 2018, EOS has been one of the few coins that has managed to remain above its January price. If I had to attribute this pattern to a reason, my wild guess would be that it is at least partly due to a combination of a few Bitcoin bull runs and the year-long nature of the EOS ICO.


With each bull market for Bitcoin in 2017, there was a larger bull market available for EOS as it rolled closer. In April 2018, a major spike occurred yet again, which was uncorrelated with Bitcoin prices, as the ICO date comes closer to meet the end and the EOS main net prepares for launch.
While critics may argue a cult-of-personality, where prices can be attributed to public approval of its leader (Dan Larimer), the cult-of-personality case would be extremely hard to argue considering other cryptocurrencies, like Ethereum and Bitcoin Cash, have leading personalities (Vitalik Buterin and Roger Ver, respectively). And if you examine the Ethereum and Bitcoin Cash correlation, you’d notice that both demonstrate strong correlation with Bitcoin prices. So if you do believe in the cult-of-personality argument, then you would also have to believe that for some reason or another Dan Larimer has a strong cult following than the others.
So What Does This All Mean?
Data is interesting, but as many people warn, it is really only an indicator of past patterns. Especially in this volatile market, there is no guarantee that these correlation patterns will hold a year, a month, or even a day from now.
Some interesting points, though, are that the idea of a diversified cryptocurrency portfolio to spread risk is, in my opinion, a myth. You can certainly diversify for reasons such as interest and trying to potentially maximize the upside, but as the correlation patterns have shown, there isn’t really any less risk in holding other coins, especially since Bitcoin drags it all down. While I haven’t quantified a value for this statement, from eyeballing and personal experience I’ve observed that, often, price drops on Bitcoin actually results in harder drops in altcoins.
With such a strong correlation to Bitcoin prices, anyone not actively investing or day trading cryptocurrencies could have a fairly decent return in relation to a diversified portfolio — especially one diversified in the $1B+ market cap coins. While we have seen an outlier with EOS, because the main net is out now and the blockchain has to deliver on its promise, if the hype doesn’t align with realities, it could become just another Bitcoin-pegged cryptocurrency very quickly.
Where Did I Get My Data?
No, I didn’t pay CoinMarketCap to access all this pricing data. I collected from 2016 to 2018 and I used the CoinGecko API, which is free and contains just as much quality data — way more than I needed to do this analysis.
