
Find your desired fishing site in Ontario Canada
Find your desired fishing site in Ontario Canada
Once, I was talking with my colleague about outdoor activities, and he told me that he is a fishing enthusiast. It didn’t bring up my attention at first since I am not a fishing guy. However, he propose a idea to use Google Map to search for all those fishing sites due to the hard time of playing around with the official fishing website. The idea is brilliant and it attract me as well. In the end, that’s how we start our first project at
The first part of the project is to collect all the data from Fishing Ontario website, which is also the most challenge part. We have to use a package called selenium to extract the data since the web page is dynamic. To be more specific, selenium is a package which allows you to do the automation. We basically did some coding in python and run some automated tests on the Fishing Ontario website, which it can automatically extract all 669 lakes in zone 16 along with its key information. You can check the following videos in order to have a better understanding of selenium.
This demo shows you how the selenium get into the page of data storage.
This demo shows you how the selenium extract the information from each lake.
We did some data processing since not all the information are required. There are multiple features for each lake and only the essential information has been extracted. For each extracted lake, it contains seven key features which are Lake Name, Municipality, Geographic Township, MNRF District, Coordinates, Waterbody and Fish Species. During the process of extracting data, the feature of each lake was stored into a data frame where the columns are those features and it was ordered by the Lake Name in alphabetical order. Due to the loading time issue of the website, we extracted the data separately and save it as a CSV file. Once we got all the data, we combined them as a final CSV file.
Furthermore, the second part of the project is to do data visualization and we used three packages for completion which are gmaps, googlemaps and folium. First of all, folium is a package for people to do map visualization on the open street map that everyone can edit and contribute to it. The reason we use folium is that it has various fancy features such as marker clustering. To demonstrate it, let’s check the following images.
This is marker clustering by using folium.

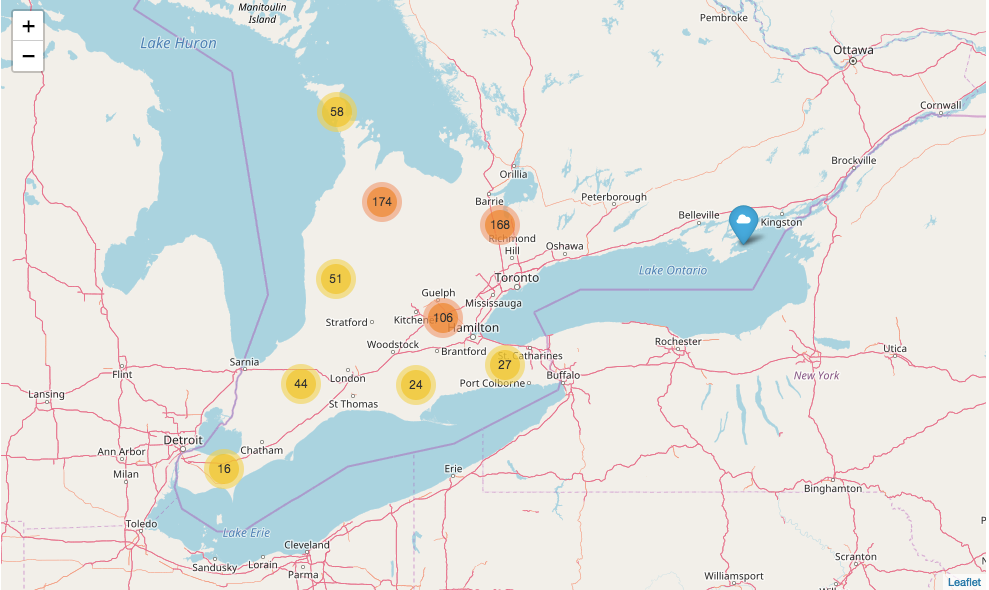
You can click the cluster.

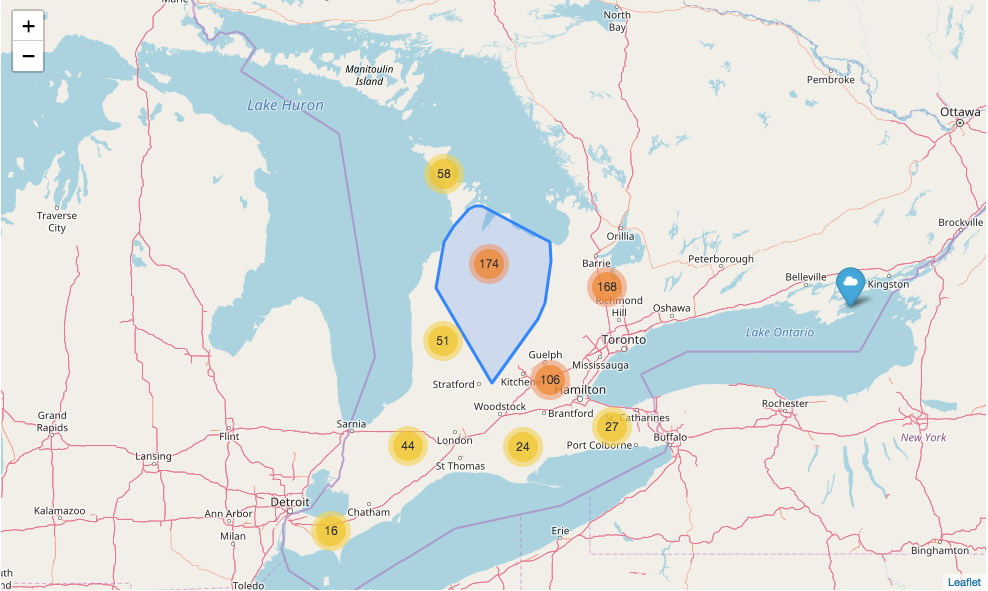
More clusters inside.

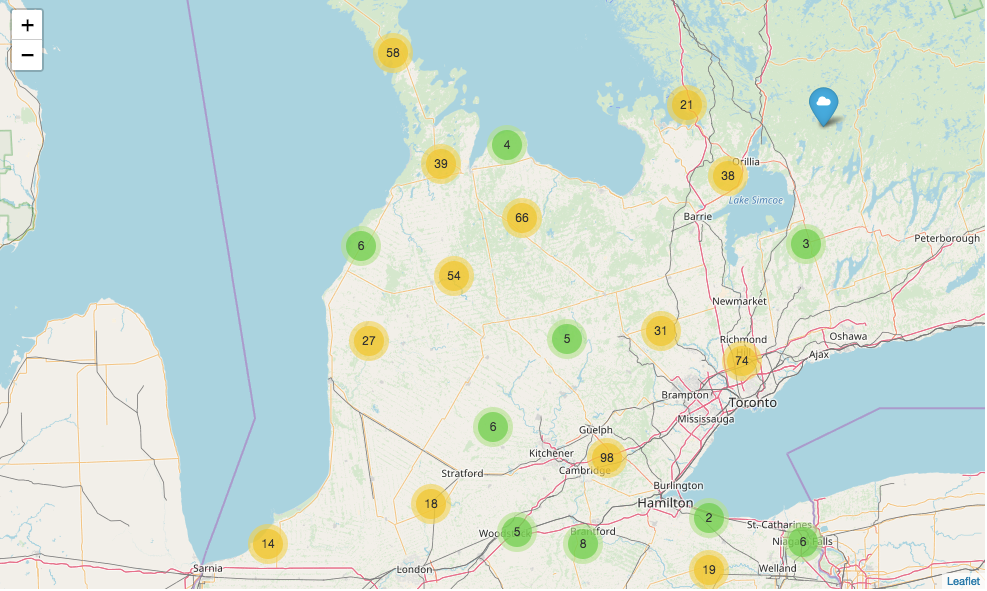
On the other hand, you might notice that there is a blue marker on the map which is actually the outlier not included in the cluster.
Overall, this is just a brief interlude where the exciting part is on the Google map.
Firstly, we have to configure the Google map with its api key in order to do the map visualization on python and the api key can be obtained from Google console. Once the configuration part has completed, we are good to go. The Google map visualization contains three parts where each of them is correlated.
The first part is about searching lakes along with its key information. We write couples of function where allows you to enter text in the input and it will return the information and location of those lakes which contains the characters you type it. If the results not found, you will have to type it again.
It’s just work like that.

The second part is about getting the direction, distance and duration between your current location and the lakes you searched previously. It will ask you to enter the address, city and country to set up your current location. You can also select the mode from one of driving, walking, bicycling and transit to get there.
This is how it looks like.

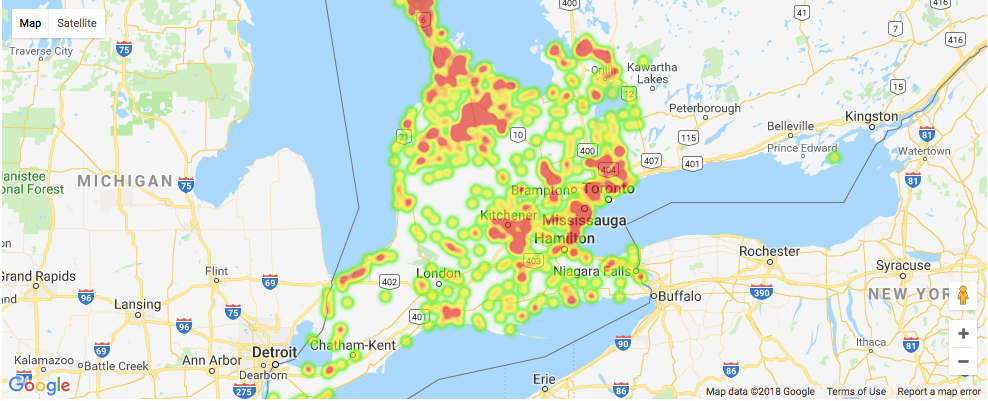
The final part is to show the density of lakes and fish species by using heat map.
Heat map for the distribution of lakes.

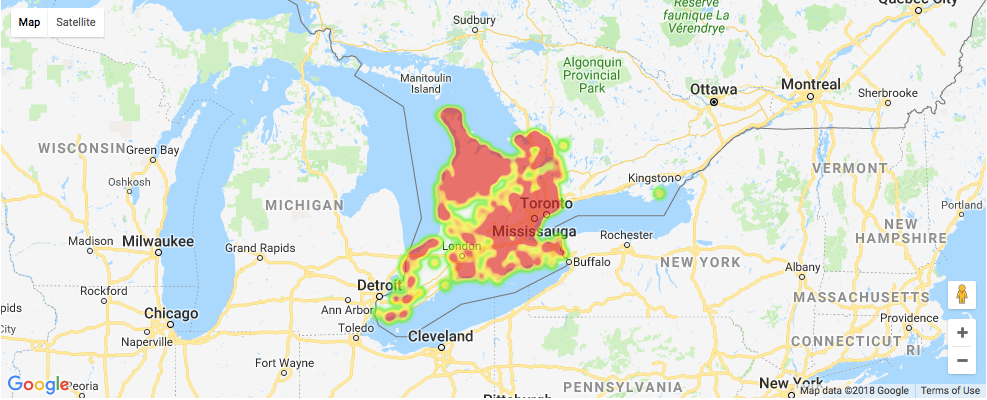
Take a closer look.

Heat map for the distribution of each fish species. You will see a dictionary where its keys are integer starting from 1 and the corresponding the values are different type of the fish species. All you need to do is to enter the integer to get the heat map for the corresponding fish species.
Here is the demo.
So, that’s pretty much all about our project
Thank you for spending your precious time on reading my blog, follow me if you like it.