
Optimized shot-based encodes: Now Streaming!
Compression Performance
In December 2016, we introduced AVCHi-Mobile and VP9-Mobile encodes for downloads. For these mobile encodes, several changes led to improved compression performance over per-title encodes, including longer GOPs, flexible encoder settings and per-chunk optimization. These streams serve as our high quality baseline for H.264/AVC and VP9 encoding with traditional rate control settings.
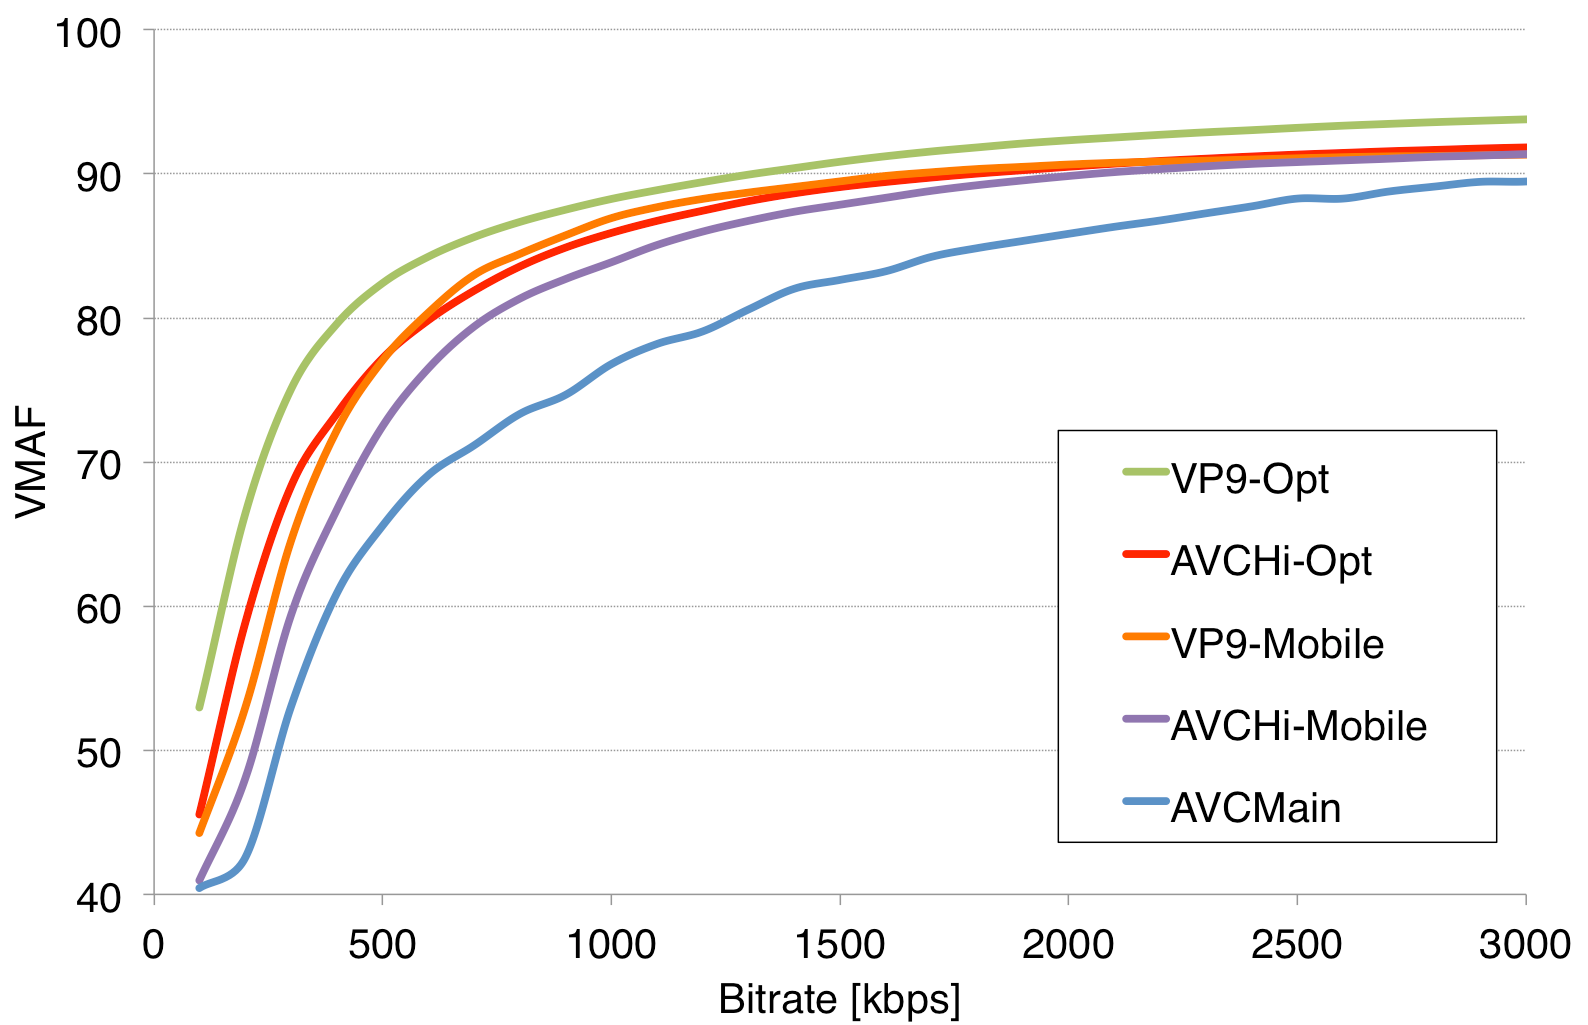
The graph below (Fig. 3) demonstrates how the combination of Dynamic Optimization with shot-based encoding further improves compression efficiency. We plot the bitrate-VMAF curves of our new optimized encodes, referred to as VP9-Opt and AVCHi-Opt, compared to
- Per-chunk encodes for downloads (VP9-Mobile and AVCHi-Mobile)
- Per-title encodes for streaming (AVCMain).
To construct this graph, we took a sample of thousands of titles from our catalog. For each bitrate, x, (on the horizontal axis), and for each title, we selected the highest quality encode (as expressed by a VMAF score) with bitrate ≤ x. We then averaged VMAF values across all the titles for the given x, which provided one point for each curve in the following figure. Sweeping over all bitrate values x, this resulted in 5 curves, corresponding to the 5 types of encodes discussed above. Assuming stable network conditions, this is the average VMAF quality you will receive on the Netflix service at that particular video bandwidth.

Let’s illustrate the reduction in bitrate at equivalent quality, by drawing a horizontal line at VMAF=80 (good quality), which gives us the following bitrates:

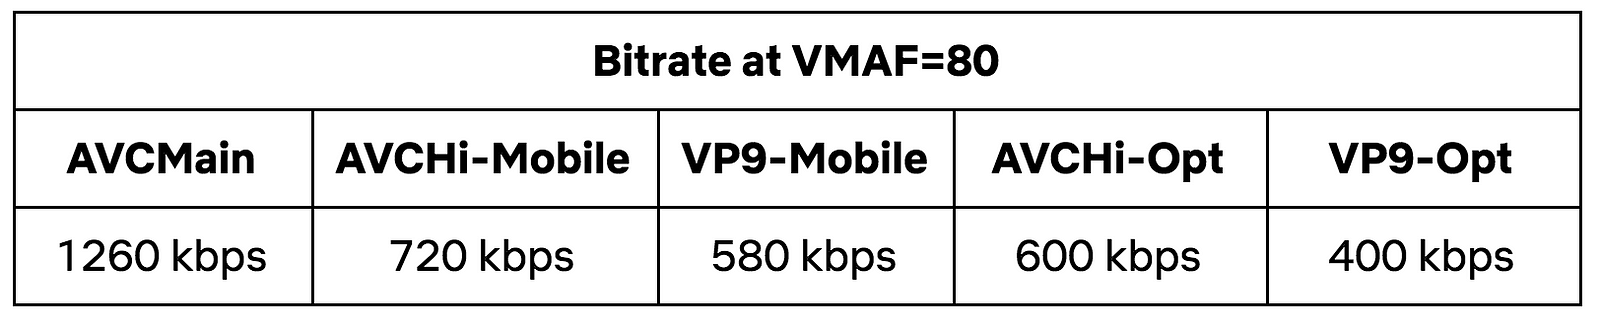
We can see that, compared to per-title encoding with AVCMain, the optimized encodes require less than half of the bits to achieve the same quality. With VP9-Opt, we can stream the same quality at less than one third of the bits of AVCMain. Compared to AVCHi-Mobile and VP9-Mobile, we save 17% and 30%, respectively.
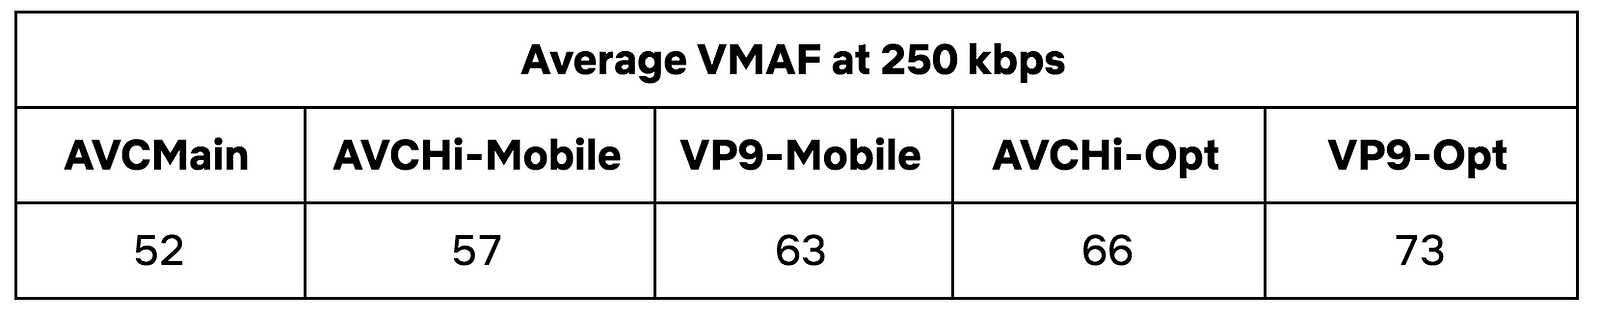
We also examine how visual quality is impacted given the same bandwidth. For example, an average cellular connection bandwidth of 250 kbps, results in the average VMAF values shown in the table below. The optimized encodes provide noticeably better video quality than AVCMain.

To illustrate the difference in visual quality, the example below shows a frame from a Chef’s Table episode, taken from different encodes with approximately 250 kbps bitrate. Immediately noticeable is the increased quality in textures (bricks, trees, rocks, water etc). A visually noticeable difference is observed between AVCMain (Fig. 4A, VMAF=58) and AVCHi-Opt (Fig. 4B, VMAF=73). The VP9-Opt frame (Fig. 4C, VMAF=79) looks sharpest.


In the following example, we show a detail of the opening scene of 13 Reasons Why, at approximately 250 kbps. For AVCMain (Fig. 5A), the text at the top is hardly legible, deserving a VMAF value of 60. For AVCHi-Opt (Fig. 5B), we see a large jump in quality to a VMAF value of 74. For VP9-Opt (Fig. 5C), the text and edges become crisp, and we get another noticeable increase in quality, which is also reflected in the VMAF value of 81.