LaTeX基本命令使用教程(清晰例項)(Overleaf平臺)(論文排版)
前言:本文是筆者在學習LaTeX的記錄文件,主要是一些常用命令,發至部落格分享給大家,筆者的感受是熟悉這些常用命令後即可上手編輯簡單的論文,效率很高,體驗比word好很多。希望本文能夠對LaTeX的初學者有所幫助,有任何問題可以在評論區留言,筆者寫的一個小例項在文末。(我使用的是Overleaf平臺,具體使用哪個平臺進行LaTeX排版屬於個人習慣問題,但是語法是通用的)
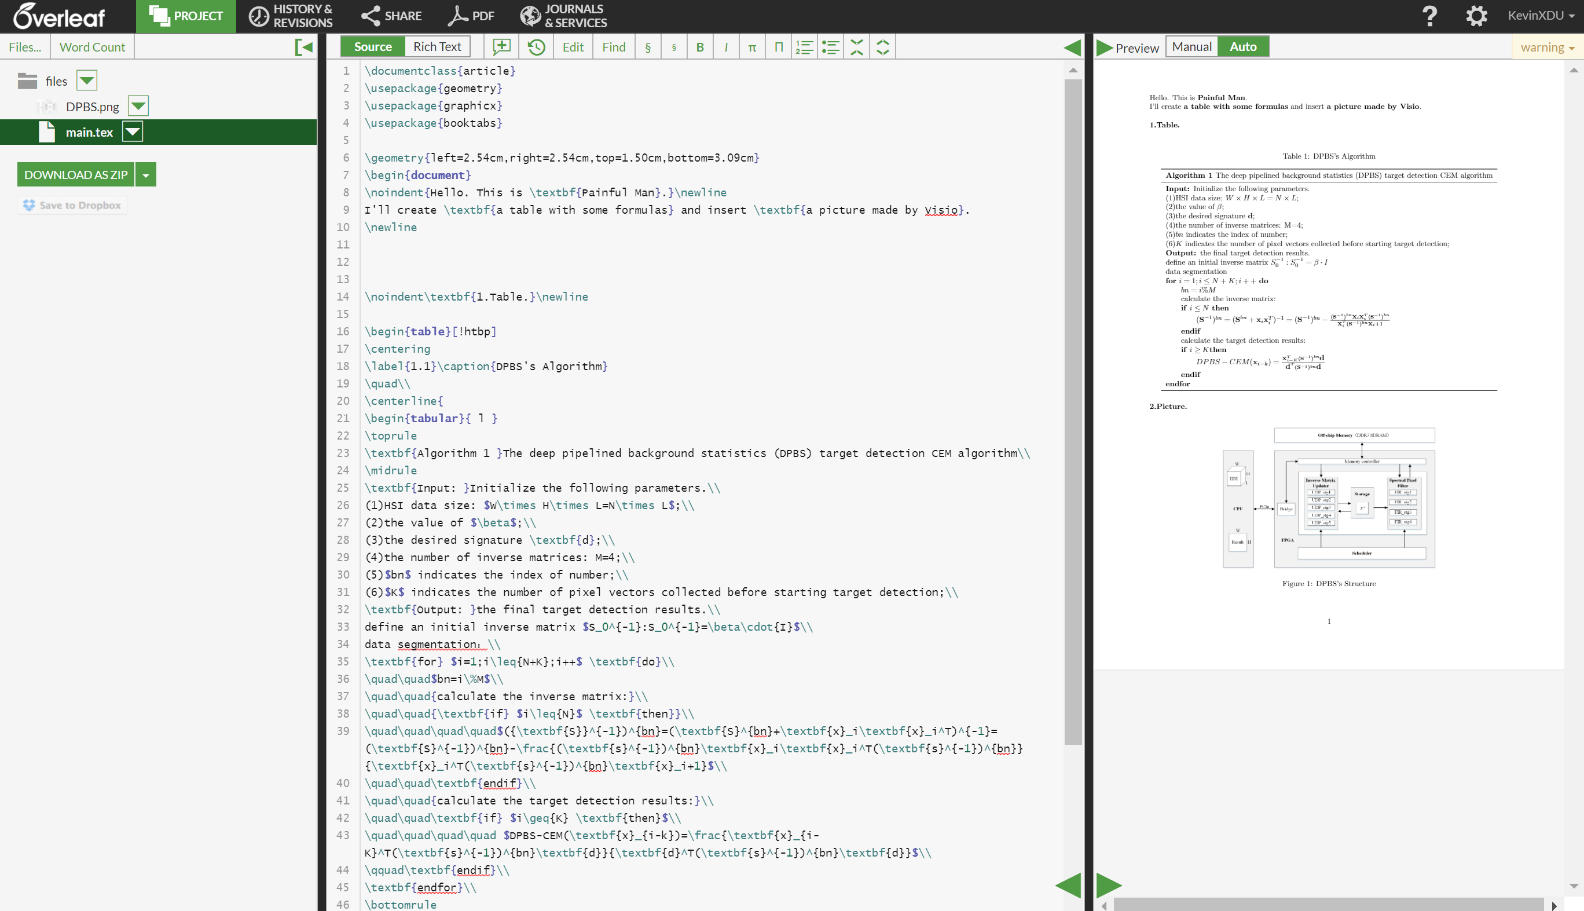
Overleaf
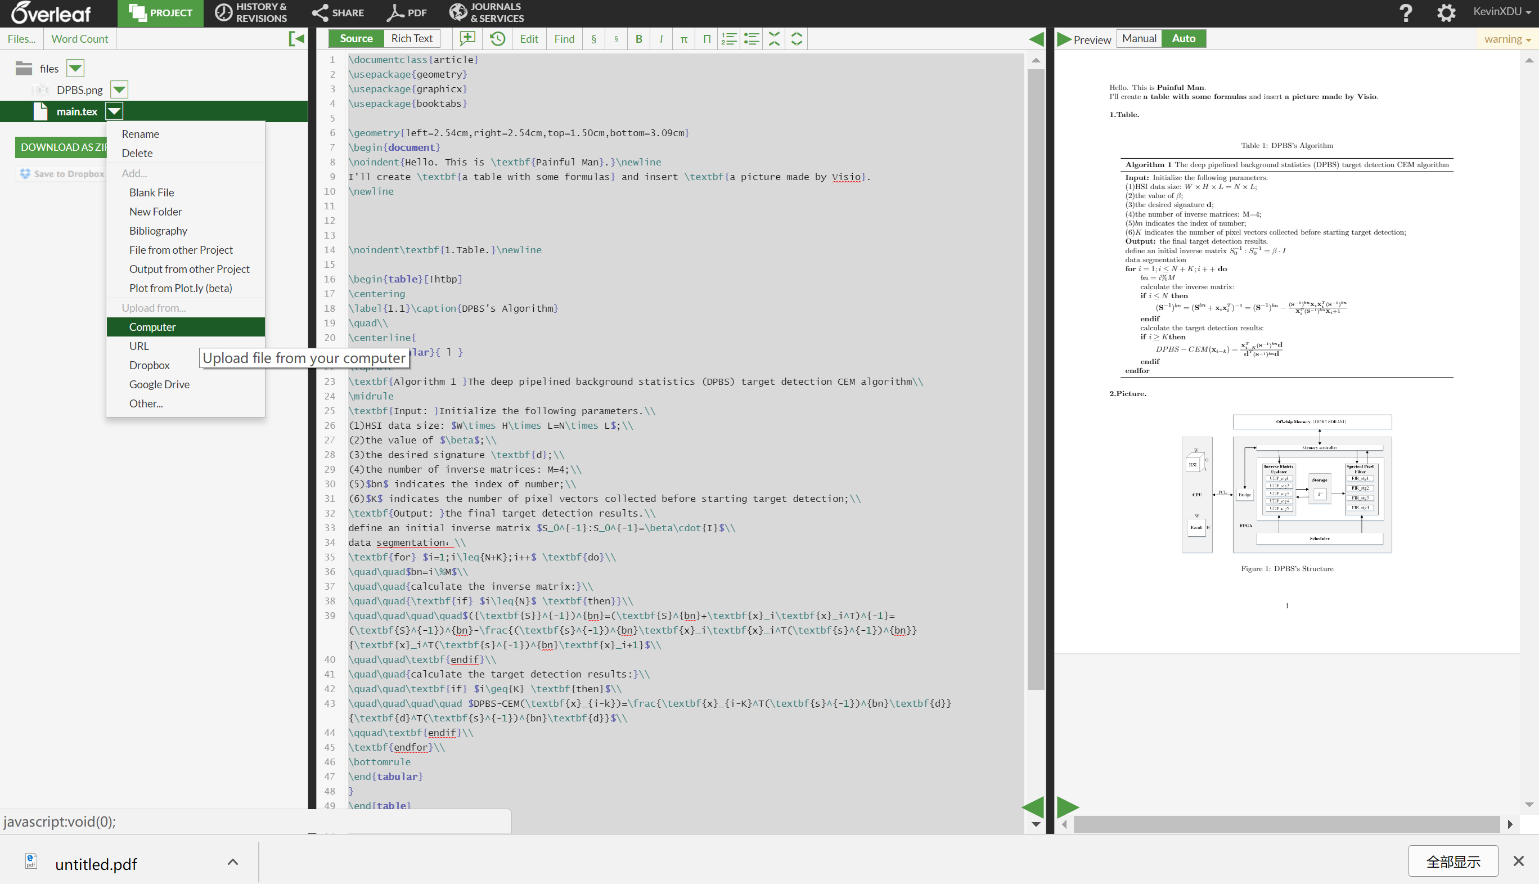
Overleaf是一個使用LaTeX進行多人協同編輯的平臺,可以免費註冊和使用,不用下載LaTeX軟體,是最為著名的LaTeX線上協作系統。主要特色是有LaTeX外掛,編輯功能十分完善,有實時預覽(即編即看,無需手動編譯)的功能。科研工作者可以在各大期刊的網站上下載到其Overleaf模板,進行論文寫作(不同模板的排版方式(比如“作者”和“地址”)的格式不同)。在註冊Overleaf後會有詳細的指引,在此不再贅述,平臺是純英文的,需要使用者適應,這也是科研工作者的必備素質。
Overleaf開發介面
一、文字/排版:
1、定版型:
documentclass [A] {B}
A:①字型10pt(預設值),11pt,12pt,例子:\documentclass[11pt]{article};
②紙張大小有幾個,最常見的就是a4paper,letterpaper(預設值),例子:\documentclass[a4paper]{article};
③單雙面oneside(article,report預設值),twoside(book預設值),例子:\documentclass[twoside]{article};
④組合實現:\documentclass[a4paper,twoside,11pt]{article}順序隨意;
B:①常用:Article(英文科研文章)/report/book;②ctex文件類(支援中文):ctexart/ctexrep/ctexbook;
2、加標題/日期/作者:
在\begin{document}之前輸入:\title{標題}\author{作者}\date{日期} ; %輸入空格即為空
在\begin{document}之前輸入:\maketitle ;%輸入後,前三者才生效
3、修改頁邊距:
\Usepackage{ geometry };
\Gemometry(left
4、文字加粗: \textbf{ };
5、左對齊: \noindent; %本行左對齊不縮排
6、換行: \newline或者 \\;
7、空格: 單格\quad 雙格\\quad;
8、居中/左對齊/右對齊:
①部分居中:
\centering; %小範圍內(比如表格)居中後面部分內容
②全部居中/左對齊/右對齊:
\begin{center/flushleft/flushright}要居中的內容\end{center/flushleft/flushright };
二、公式編輯(2-8均是在1的條件下使用):
1、(1)行中插入公式: $公式$,例子:$\frac{L^4}{2}+\frac{L^3}{6}-\frac{4L}{3}$;
(2)行間插入公式(自動帶上公式標號),\begin{equation}公式\end{equation},
例子:\begin{equation}\frac{L^4}{2}+\frac{L^3}{6}-\frac{4L}{3}\end{equation};
2、粗體(向量或矩陣):用\mathbf{}(有時\textbf{}仍然有用);
3、上標:字母^上標;下標:字母_下標;
4、括號:\left(括號內容\right) 或者直接輸入();
5、分數:\frac{分子}{分母};
6、求和:\sum_{下標}^{上標};
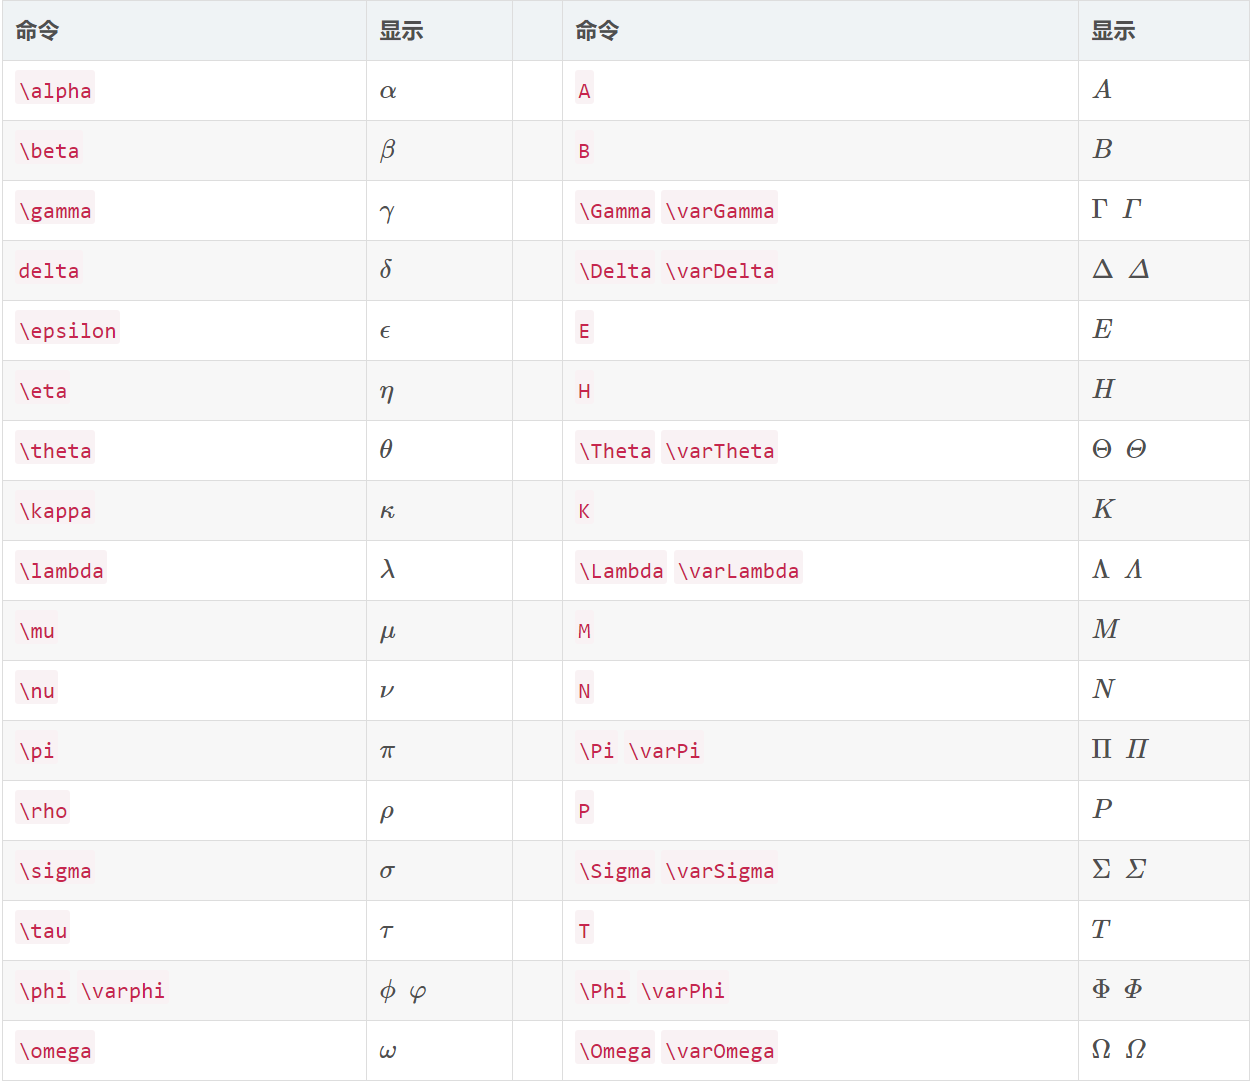
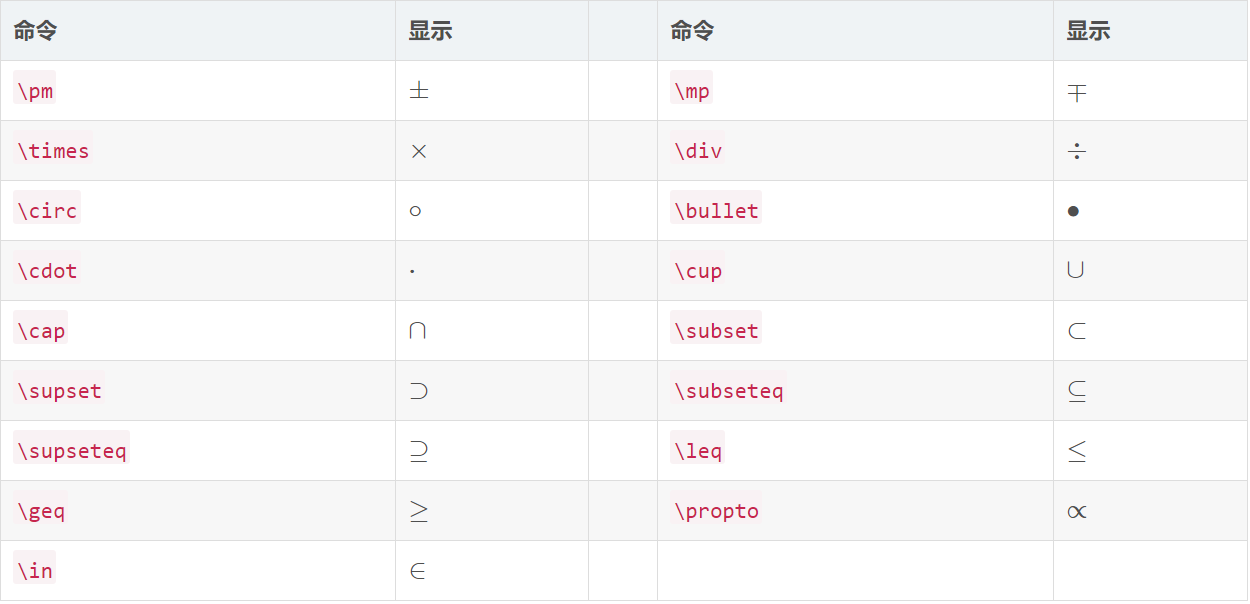
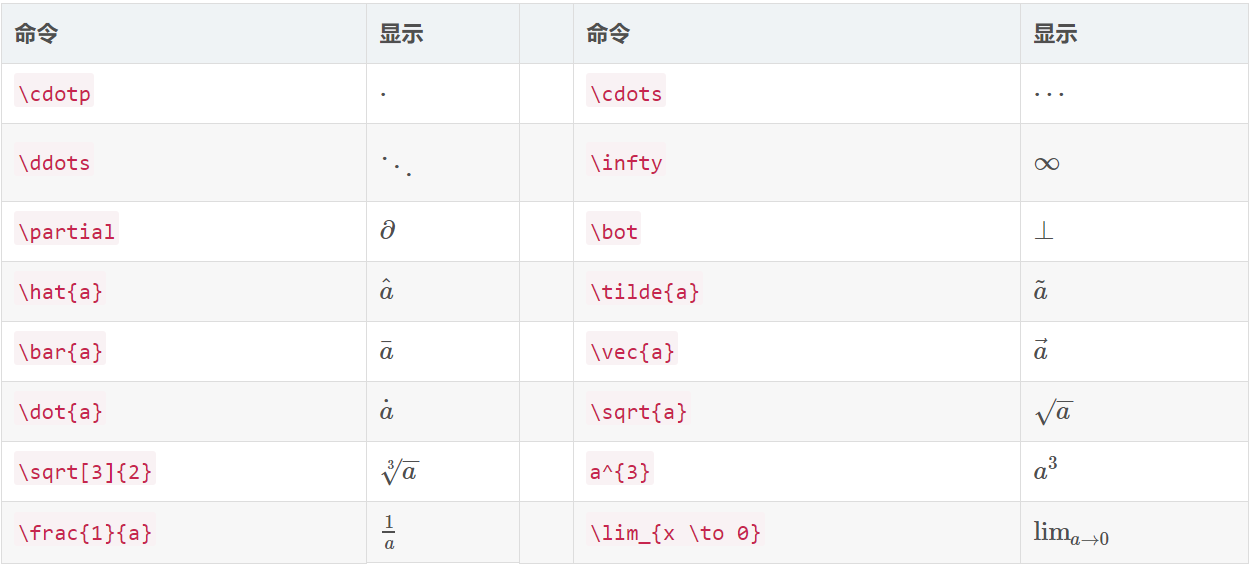
7、符號(求餘符號為\%):
(1)希臘字母:
(2)基本運算子:
(3)積分運算子:
(4)其他符號:
三、插入圖片:
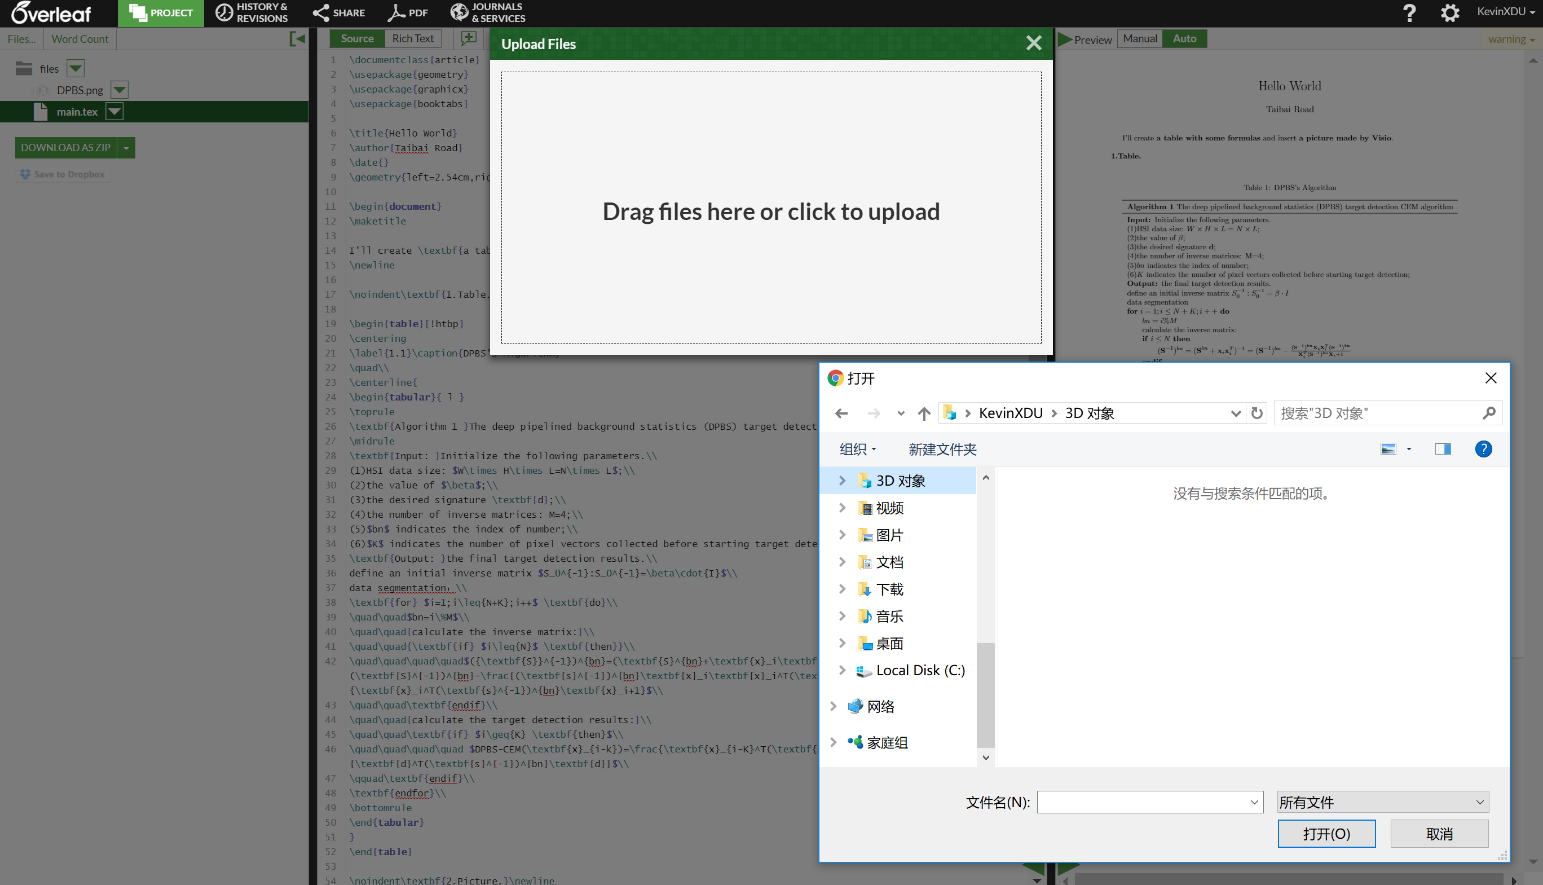
1、首先將需要插入的圖片上傳到當前編輯檔案的雲端庫中;
2、其次開始程式設計:
\usepackage{graphicx} %加入標頭檔案
\begin{figure}[!htpb]/[H] %[htbp]是自動排版;[H]固定位置
\centering %圖片居中
\includegraphics[scale=0.3]/[width=4.5in]{DPBS.png} %設定大小和名稱
\caption{DPBS}\label{1} %圖片名稱和圖片標號
\end{figure} %結束
其中,{figure}的可選引數[!htbp]:
h代表here,將表格排在當前文字位置 ;t表示將表格放在下一頁的top (頁首);p表示p-page-of-its-own;
b表示將表格放在當前頁的 bottom(底部);!表示忽略美觀因素,儘可能按照引數指定的方式來處理圖片浮動位置;
四、插入表格:
1、粗線(表格的第一根線和最後一根線比表格中的橫線更粗一些):\usepackage{booktabs}
\toprule %第一根線
\midrule %中間的線
\bottomrule %最後一根線
2、調整位置:
\begin{table}[!htbp]
\end{table}
其中,{table}有若干可選引數[!htbp]
h代表here,將表格排在當前文字位置 ;t表示將表格放在下一頁的 top (頁首) ;p表示p-page-of-its-own;
b表示將表格放在當前頁的 bottom (底部) ;!表示忽略美觀因素,儘可能按照引數指定的方式來處理表格浮動位置;
3、居中:
長度不長時\centering
長度過長時\centerline{} %把tabular的所有內容放進去
4、製表:
\begin{tabular}{|l |c | r |} %“|”表示豎線,“l/c/r”表示格內居左/中/右,
A & B & C\\%“&”分隔不同列內的內容,“\\”表示換行
E & F & G\\
\end{tabular}
5、標籤和名稱:\label{label}\caption{name}
6、普通線:\hline或\cline{2-5} %後者可以畫如下圖這種表格:
7、行高:
\renewcommand\arraystretch{2} %表格行高設定為預設的2倍
五、參考文獻:
1、格式:
(1)期刊:作者名.題目.期刊(縮寫,斜體)年份(加粗),卷(斜體),頁碼.
(2)會議:作者名.題目.會議名稱(不縮寫,斜體),年份(不加粗);pp. 頁碼.
2、函式:
\begin{thebibliography}{}
\bibitem{ref label}
內容 %{\em要斜體的內容} {\bf要加粗的內容}
\end{thebibliography}
3、例子:
(1)效果圖:
(2)程式碼:
\begin{thebibliography}{}

     \bibitem{ref 1 }

       Li, J.; Bioucas-Dias, J.M.; Plaza, A. Spectral–spatial hyperspectral image segmentation using subspace multinomial

       logistic regression and Markov random fields. {\em IEEE Trans. Geosci. Remote Sens.} {\bf 2012}, {\em 50}, 809-823.

\end{thebibliography}六、引用:(label是為了方便之後直接引用):
1、參考文獻加label:在命令\bibitem寫{ref A }
引用:\cite{ref A }
2、表格/圖片加label:\label{ A }
引用:\ref{ A }
七、筆者的例項:
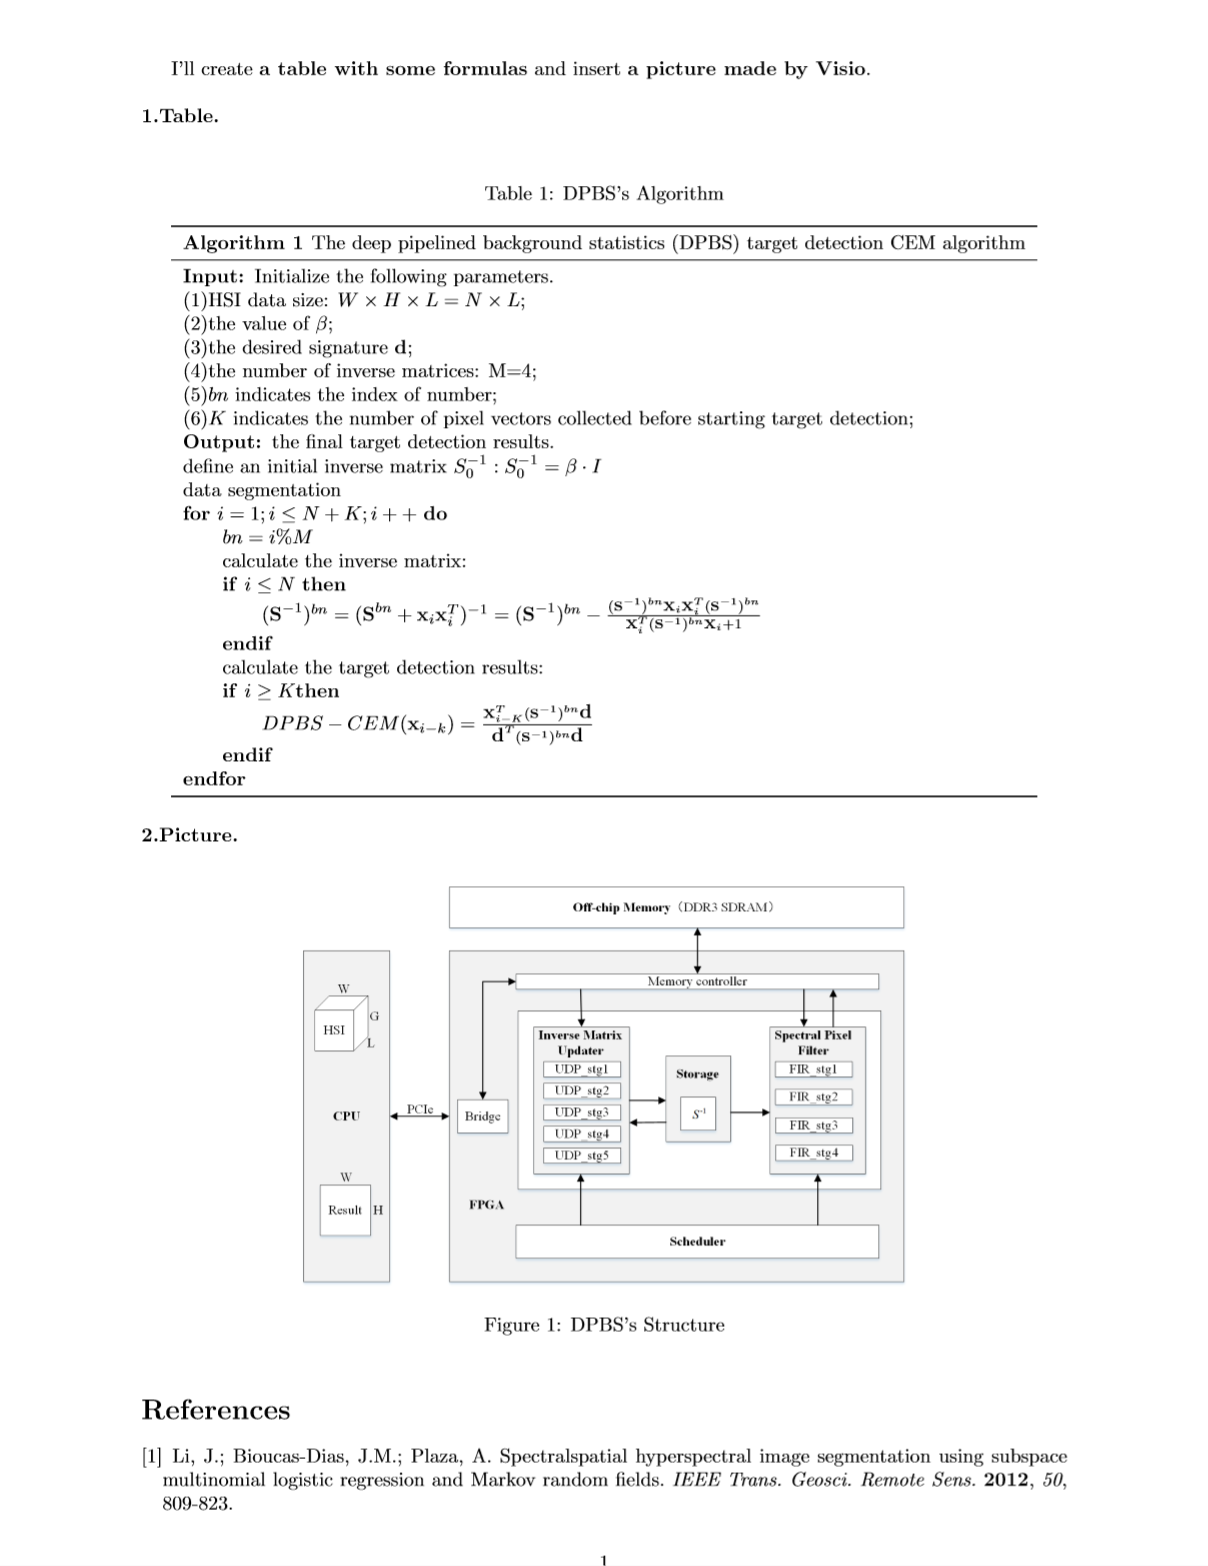
1、效果圖:
2、程式碼:
\documentclass{article}                %英文科研文獻常用型別
\usepackage{geometry}                  %更改頁邊距所需
\usepackage{graphicx}                  %插入圖片所需
\usepackage{booktabs}                  %表格線條加粗所需

\geometry{left=2.54cm,right=2.54cm,top=1.0cm,bottom=1.0cm}              %更改頁邊距

\begin{document}                                                        %開始正文
I'll create \textbf{a table with some formulas} and insert \textbf{a picture made by Visio}.
\newline\newline                                                        %換行
\noindent\textbf{1.Table.}\newline                                      %加粗左對齊顯示標題

\begin{table}[!htbp]                                                    %開始製表
\label{1.1}\caption{DPBS's Algorithm}                                   %加標籤和名稱
\\                                                                      %換行
\centerline{                                                            %表格居中開始
\begin{tabular}{ l }                                                    %構造只有一列的左對齊的表格
\toprule                                                                %第一條粗線
\textbf{Algorithm 1 }The deep pipelined background statistics (DPBS) target detection CEM algorithm\\   %第一行標題
\midrule                                                                %中間普通粗細的線
\textbf{Input: }Initialize the following parameters.\\                  %以下為第二條線和第三條線之間的內容
(1)HSI data size: $W\times H\times L=N\times L$;\\
(2)the value of $\beta$;\\
(3)the desired signature \textbf{d};\\
(4)the number of inverse matrices: M=4;\\
(5)$bn$ indicates the index of number;\\
(6)$K$ indicates the number of pixel vectors collected before starting target detection;\\
\textbf{Output: }the final target detection results.\\
define an initial inverse matrix $S_0^{-1}:S_0^{-1}=\beta\cdot{I}$\\
data segmentation:\\
\textbf{for} $i=1;i\leq{N+K};i++$ \textbf{do}\\
\quad\quad$bn=i\%M$\\
\quad\quad{calculate the inverse matrix:}\\
\quad\quad{\textbf{if} $i\leq{N}$ \textbf{then}}\\
\quad\quad\quad\quad$({\textbf{S}}^{-1})^{bn}=(\textbf{S}^{bn}+\textbf{x}_i\textbf{x}_i^T)^{-1}=(\textbf{S}^{-1})^{bn}-\frac{(\textbf{s}^{-1})^{bn}\textbf{x}_i\textbf{x}_i^T(\textbf{s}^{-1})^{bn}}{\textbf{x}_i^T(\textbf{s}^{-1})^{bn}\textbf{x}_i+1}$\\
\quad\quad\textbf{endif}\\
\quad\quad{calculate the target detection results:}\\
\quad\quad\textbf{if} $i\geq{K} \textbf{then}$\\
\quad\quad\quad\quad $DPBS-CEM(\textbf{x}_{i-k})=\frac{\textbf{x}_{i-K}^T(\textbf{s}^{-1})^{bn}\textbf{d}}{\textbf{d}^T(\textbf{s}^{-1})^{bn}\textbf{d}}$\\
\qquad\textbf{endif}\\
\textbf{endfor}\\
\bottomrule                                                               %最後一條粗線
\end{tabular}                                                             %構造表格結束
}                                                                         %表格居中結束
\end{table}                                                               %製表結束

\noindent\textbf{2.Picture.}\newline                                      %加粗左對齊顯示標題

\begin{figure}[!htbp]                                                     %開始插圖
\centering                                                                %圖片居中
\includegraphics[scale=0.55]{DPBS.png}                                    %確定圖片大小/位置
\caption{DPBS's Structure}\label{1.1}                                     %加名稱和標籤
\end{figure}                                                              %結束插圖

\begin{thebibliography}{}                                                 %開始編輯參考文獻
\bibitem{ref1.1}                                                          %加標籤
Li, J.; Bioucas-Dias,J.M.; Plaza, A. Spectral–spatial hyperspectral image segmentation usingsubspace multinomial logistic regression and Markov random fields. {\em IEEETrans. Geosci. Remote Sens.} {\bf 2012}, {\em 50}, 809-823.
\end{thebibliography}                                                     %結束編輯參考文獻
\end{document}                                                            %結束正文
####### 轉載請註明出處 https://blog.csdn.net/gentleman_qin/article/details/79963396 ########

