1. 程式人生 > >echarts圖表庫 實現簡單 雷達圖

echarts圖表庫 實現簡單 雷達圖

<script type='text/javascript' src="js/echarts.js" charset='utf-8'></script>

2.核心程式碼

<div id="sixStart" style="width:1323px; height:1300px;text-align: center;"></div>
<!-- 注意:div一定要設定寬 和 高,原因不明,不信你試試 -->

<script type="text/javascript">
    var myChart = echarts.init(document.getElementById('sixStart'
)); var option = { title : { }, tooltip : { trigger: 'axis' }, calculable : true, polar : [ { name: { show: true,textStyle:{fontSize:16,color:"#32cd32"}}, indicator : [ {text : '解決問題'
, max : 100}, {text : '學習能力', max : 100}, {text : '綜合', max : 100}, {text : '技術能力', max : 100}, {text : '業務能力', max : 100}, {text : '思維模式', max : 100} ],center : ['50%'
,'50%'], radius : 500 //半徑,可放大放小雷達圖 } ], series : [ { name:'', type: 'radar',//圖表型別 radar為雷達圖 itemStyle: { normal: { lineStyle: { color :"#87cefa", width : 2 }, areaStyle: { color:"#87cefa", type: 'default' } } }, symbolSize :6, data : [{ value:[100,80,80,80,80,80] }] } ] }; $(function(){ myChart.setOption(option); });
</script>

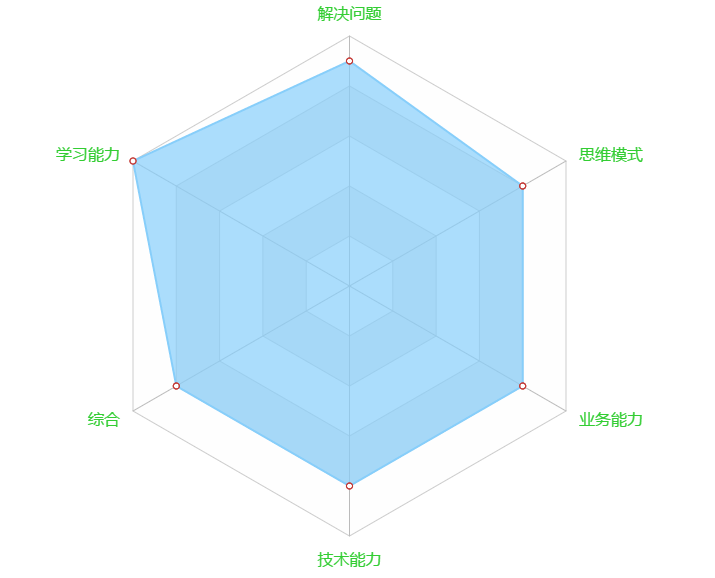
3.效果圖
雷達圖