【Keras】從兩個實際任務掌握影象分類
我們一般用深度學習做圖片分類的入門教材都是MNIST或者CIFAR-10,因為資料都是別人準備好的,有的甚至是一個函式就把所有資料都load進來了,所以跑起來都很簡單,但是跑完了,好像自己還沒掌握圖片分類的完整流程,因為他們沒有經歷資料處理的階段,所以談不上走過一遍深度學習的分類實現過程。今天我想給大家分享兩個比較貼近實際的分類專案,從資料分析和處理說起,以Keras為工具,徹底掌握影象分類任務。
這兩個分類專案就是:交通標誌分類和票據分類。交通標誌分類在無人駕駛或者與交通相關專案都有應用,而票據分類任務就更加貼切生活了,同時該專案也是我現在做的一個大專案中的子任務。這兩個分類任務都是很貼近實際的練手好專案,希望經過這兩個實際任務可以掌握好Keras這個工具,並且搭建一個用於影象分類的通用框架,以後做其他影象分類專案也可以得心應手。
先說配置環境:
- Python 3.5
- Keras==2.0.1,TesnsorFlow後端,CPU訓練
一、交通標誌分類
首先是觀察資料,看看我們要識別的交通標誌種類有多少,以及每一類的圖片有多少。開啟一看,這個交通標誌的資料集已經幫我們分出了訓練集和資料集。

每個資料夾的名字就是其標籤。

每一類的標誌圖片數量在十來張到數十張,是一個小資料集,總的類別是62。

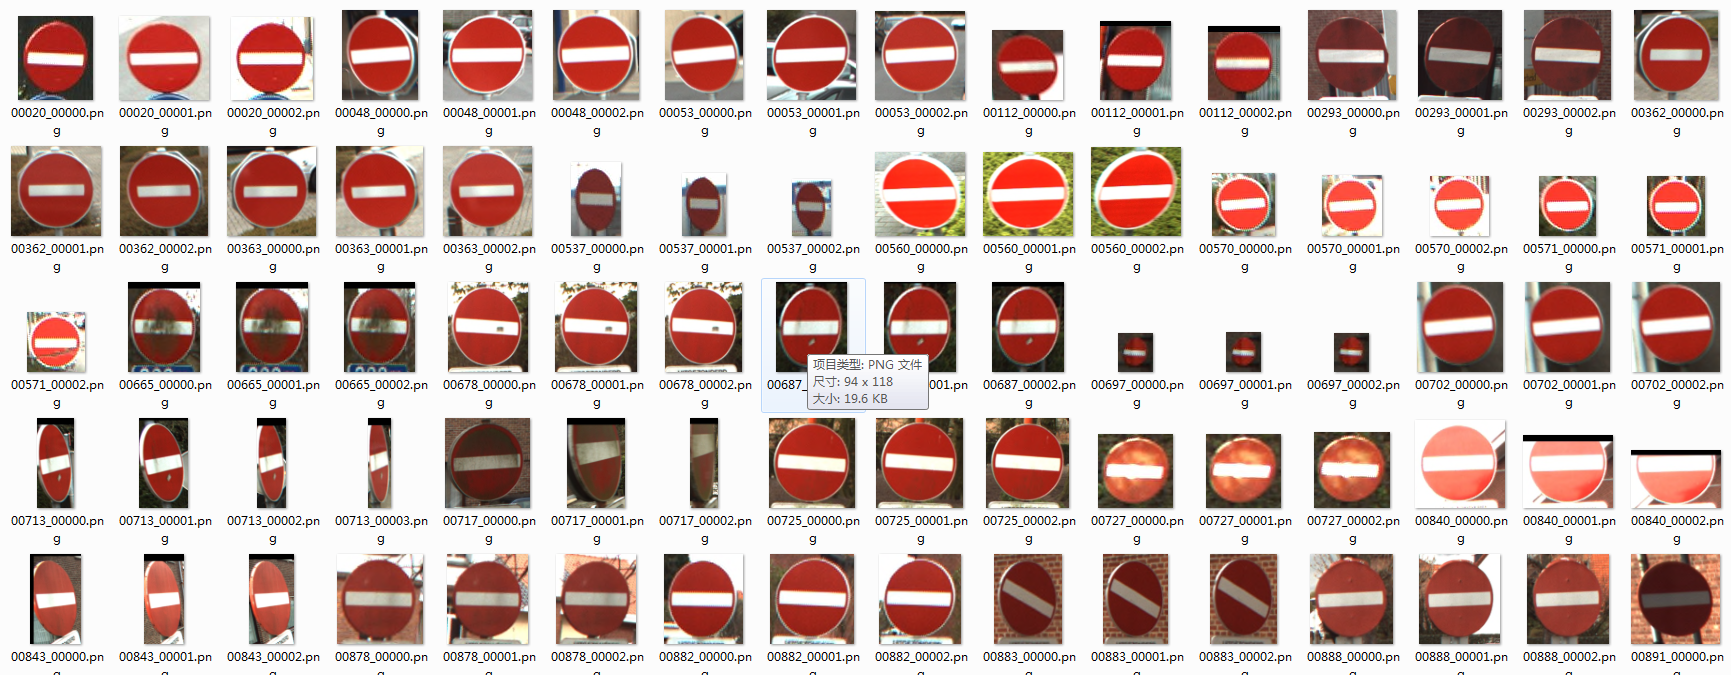

那我們開始以Keras為工具搭建一個圖片分類器通用框架。
搭建CNN
用深度學習做圖片分類選的網路肯定是卷積神經網路,但是現在CNN的種類這麼多,哪一個會在我們這個標誌分類任務表現最好?在實驗之前,沒有人會知道。一般而言,先選一個最簡單又最經典的網路跑一下看看分類效果是的策略是明智的選擇,那麼LeNet肯定是最符合以上的要求啦,實現簡單,又相當經典。那我們先單獨寫一個lenet.py的檔案,然後實現改進版的LeNet類。

# import the necessary packages
from keras.models import Sequential
from keras.layers.convolutional import Conv2D
from keras.layers.convolutional import MaxPooling2D
from keras.layers.core import Activation
from keras.layers.core import Flatten
from keras.layers.core import Dense
from keras import backend as 其中conv2d表示執行卷積,maxpooling2d表示執行最大池化,Activation表示特定的啟用函式型別,Flatten層用來將輸入“壓平”,用於卷積層到全連線層的過渡,Dense表示全連線層(500個神經元)。
引數解析器和一些引數的初始化
首先我們先定義好引數解析器。
# set the matplotlib backend so figures can be saved in the background
import matplotlib
matplotlib.use("Agg")

# import the necessary packages
from keras.preprocessing.image import ImageDataGenerator
from keras.optimizers import Adam
from sklearn.model_selection import train_test_split
from keras.preprocessing.image import img_to_array
from keras.utils import to_categorical
from imutils import paths
import matplotlib.pyplot as plt
import numpy as np
import argparse
import random
import cv2
import os
import sys
sys.path.append('..')
from net.lenet import LeNet


def args_parse():
    # construct the argument parse and parse the arguments
    ap = argparse.ArgumentParser()
    ap.add_argument("-dtest", "--dataset_test", required=True,
        help="path to input dataset_test")
    ap.add_argument("-dtrain", "--dataset_train", required=True,
        help="path to input dataset_train")
    ap.add_argument("-m", "--model", required=True,
        help="path to output model")
    ap.add_argument("-p", "--plot", type=str, default="plot.png",
        help="path to output accuracy/loss plot")
    args = vars(ap.parse_args())
    return args
我們還需要為訓練設定一些引數,比如訓練的epoches,batch_szie等。這些引數不是隨便設的,比如batch_size的數值取決於你電腦記憶體的大小,記憶體越大,batch_size就可以設為大一點。又比如norm_size(圖片歸一化尺寸)是根據你得到的資料集,經過分析後得出的,因為我們這個資料集大多數圖片的尺度都在這個範圍內,所以我覺得32這個尺寸應該比較合適,但是不是最合適呢?那還是要通過實驗才知道的,也許64的效果更好呢?
# initialize the number of epochs to train for, initial learning rate,
# and batch size
EPOCHS = 35
INIT_LR = 1e-3
BS = 32
CLASS_NUM = 62
norm_size = 32
載入資料
接下來我們需要讀入圖片和對應標籤資訊。
def load_data(path):
    print("[INFO] loading images...")
    data = []
    labels = []
    # grab the image paths and randomly shuffle them
    imagePaths = sorted(list(paths.list_images(path)))
    random.seed(42)
    random.shuffle(imagePaths)
    # loop over the input images
    for imagePath in imagePaths:
        # load the image, pre-process it, and store it in the data list
        image = cv2.imread(imagePath)
        image = cv2.resize(image, (norm_size, norm_size))
        image = img_to_array(image)
        data.append(image)

        # extract the class label from the image path and update the
        # labels list
        label = int(imagePath.split(os.path.sep)[-2])
        labels.append(label)

    # scale the raw pixel intensities to the range [0, 1]
    data = np.array(data, dtype="float") / 255.0
    labels = np.array(labels)

    # convert the labels from integers to vectors
    labels = to_categorical(labels, num_classes=CLASS_NUM)
    return data,labels
函式返回的是圖片和其對應的標籤。
訓練
def train(aug,trainX,trainY,testX,testY,args):
    # initialize the model
    print("[INFO] compiling model...")
    model = LeNet.build(width=norm_size, height=norm_size, depth=3, classes=CLASS_NUM)
    opt = Adam(lr=INIT_LR, decay=INIT_LR / EPOCHS)
    model.compile(loss="categorical_crossentropy", optimizer=opt,
        metrics=["accuracy"])

    # train the network
    print("[INFO] training network...")
    H = model.fit_generator(aug.flow(trainX, trainY, batch_size=BS),
        validation_data=(testX, testY), steps_per_epoch=len(trainX) // BS,
        epochs=EPOCHS, verbose=1)

    # save the model to disk
    print("[INFO] serializing network...")
    model.save(args["model"])

    # plot the training loss and accuracy
    plt.style.use("ggplot")
    plt.figure()
    N = EPOCHS
    plt.plot(np.arange(0, N), H.history["loss"], label="train_loss")
    plt.plot(np.arange(0, N), H.history["val_loss"], label="val_loss")
    plt.plot(np.arange(0, N), H.history["acc"], label="train_acc")
    plt.plot(np.arange(0, N), H.history["val_acc"], label="val_acc")
    plt.title("Training Loss and Accuracy on traffic-sign classifier")
    plt.xlabel("Epoch #")
    plt.ylabel("Loss/Accuracy")
    plt.legend(loc="lower left")
    plt.savefig(args["plot"])
在這裡我們使用了Adam優化器,由於這個任務是一個多分類問題,可以使用類別交叉熵(categorical_crossentropy)。但如果執行的分類任務僅有兩類,那損失函式應更換為二進位制交叉熵損失函式(binary cross-entropy)
主函式
#python train.py --dataset_train ../../traffic-sign/train --dataset_test ../../traffic-sign/test --model traffic_sign.model
if __name__=='__main__':
    args = args_parse()
    train_file_path = args["dataset_train"]
    test_file_path = args["dataset_test"]
    trainX,trainY = load_data(train_file_path)
    testX,testY = load_data(test_file_path)
    # construct the image generator for data augmentation
    aug = ImageDataGenerator(rotation_range=30, width_shift_range=0.1,
        height_shift_range=0.1, shear_range=0.2, zoom_range=0.2,
        horizontal_flip=True, fill_mode="nearest")
    train(aug,trainX,trainY,testX,testY,args)
在正式訓練之前我們還使用了資料增廣技術(ImageDataGenerator)來對我們的小資料集進行資料增強(對資料集影象進行隨機旋轉、移動、翻轉、剪下等),以加強模型的泛化能力。
訓練程式碼已經寫好了,接下來開始訓練(圖片歸一化尺寸為32,batch_size為32,epoches為35)。
python train.py --dataset_train ../../traffic-sign/train --dataset_test ../../traffic-sign/test --model traffic_sign.model訓練過程:
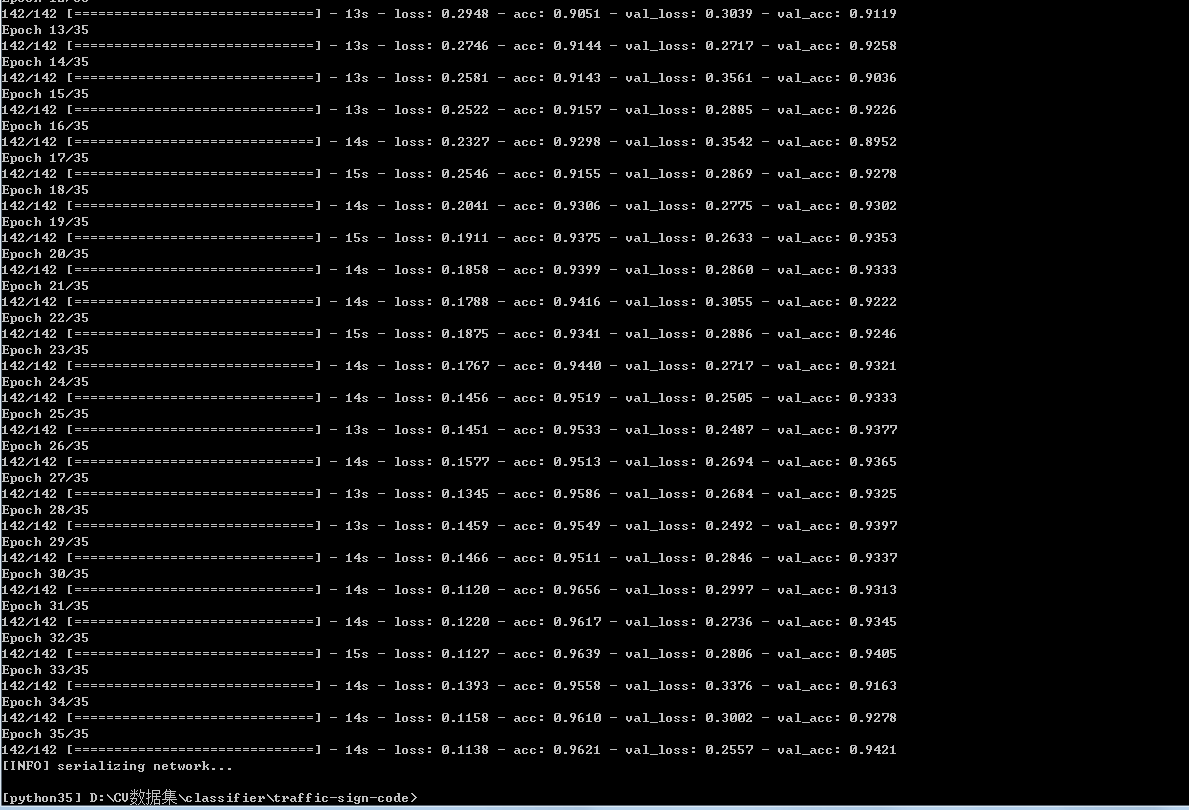
Loss和Accuracy:

從訓練效果看來,準確率在94%左右,效果不錯了。
預測單張圖片
現在我們已經得到了我們訓練好的模型traffic_sign.model,然後我們編寫一個專門用於預測的指令碼predict.py。
# import the necessary packages
from keras.preprocessing.image import img_to_array
from keras.models import load_model
import numpy as np
import argparse
import imutils
import cv2

norm_size = 32

def args_parse():
# construct the argument parse and parse the arguments
    ap = argparse.ArgumentParser()
    ap.add_argument("-m", "--model", required=True,
        help="path to trained model model")
    ap.add_argument("-i", "--image", required=True,
        help="path to input image")
    ap.add_argument("-s", "--show", action="store_true",
        help="show predict image",default=False)
    args = vars(ap.parse_args())
    return args


def predict(args):
    # load the trained convolutional neural network
    print("[INFO] loading network...")
    model = load_model(args["model"])

    #load the image
    image = cv2.imread(args["image"])
    orig = image.copy()

    # pre-process the image for classification
    image = cv2.resize(image, (norm_size, norm_size))
    image = image.astype("float") / 255.0
    image = img_to_array(image)
    image = np.expand_dims(image, axis=0)

    # classify the input image
    result = model.predict(image)[0]
    #print (result.shape)
    proba = np.max(result)
    label = str(np.where(result==proba)[0])
    label = "{}: {:.2f}%".format(label, proba * 100)
    print(label)

    if args['show']:
        # draw the label on the image
        output = imutils.resize(orig, width=400)
        cv2.putText(output, label, (10, 25),cv2.FONT_HERSHEY_SIMPLEX,
            0.7, (0, 255, 0), 2)
        # show the output image
        cv2.imshow("Output", output)
        cv2.waitKey(0)


#python predict.py --model traffic_sign.model -i ../2.png -s
if __name__ == '__main__':
    args = args_parse()
    predict(args)
預測指令碼中的程式碼編寫思路是:引數解析器-》載入訓練好的模型-》讀入圖片資訊-》預測-》展示預測效果。值得注意的是,引數-s是用於視覺化結果的,加上他的話我們就可以看出我們輸入的圖片以及模型預測的分類結果,很直觀。如果只需要得到分類結果,不加-s就可以了。
單張圖片的預測:
python predict.py --model traffic_sign.model -i ../2.png -s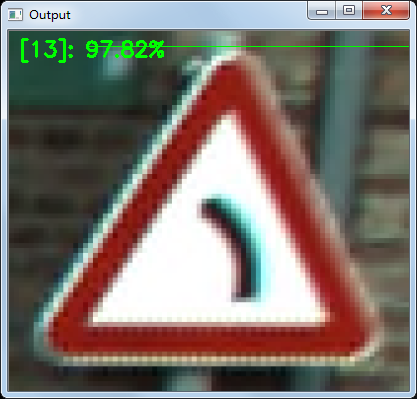
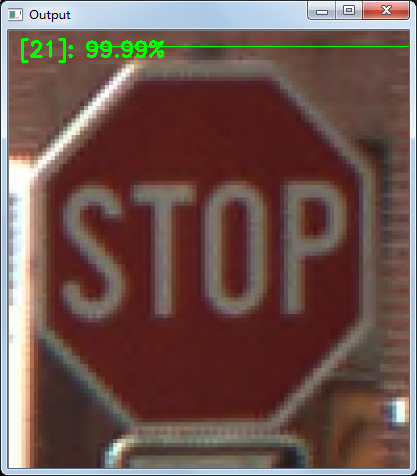
至此,交通分類任務完成。
這裡分享一下這個專案的資料集來源:
你可以點選這裡下載資料集。在下載頁面上面有很多的資料集,但是你只需要下載 BelgiumTS for Classification (cropped images) 目錄下面的兩個檔案:
- BelgiumTSC_Training (171.3MBytes)
- BelgiumTSC_Testing (76.5MBytes)
值得注意的是,原始資料集的圖片格式是ppm,這是一種很老的圖片儲存格式,很多的工具都已經不支援它了。這也就意味著,我們不能很方便的檢視這些資料夾裡面的圖片。
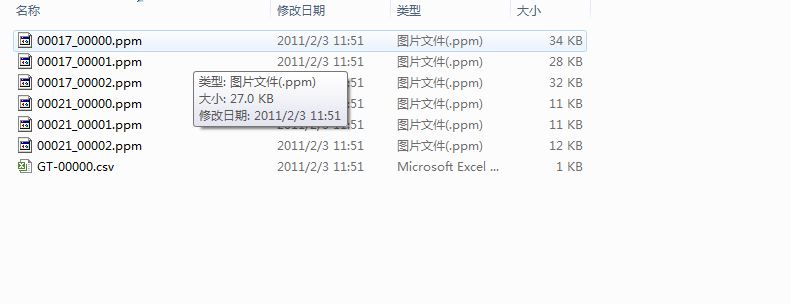
為了解決這個問題,我用opencv重新將這些圖片轉換為png格式,這樣子我們就能很直觀地看到資料圖片了。

轉換指令碼在這裡
同時我也把轉換好的資料集傳到百度雲了,不想自己親自轉換的童鞋可以自行獲取。
二、票據分類
先分析任務和觀察資料。我們這次的分類任務是票據分類,現在我們手頭上的票據種類一共有14種,我們的任務就是訓練一個模型將他們一一分類。先看看票據的影象吧。
票據種類一共14種,其圖片名字就是其label。

票據是以下面所示的資料夾排布儲存的。

然後我們再看一下每類圖片資料的情況,看一下可利用的資料有多少。
有的票據資料比較少,也就十來張

有的票據比較多,有上百張
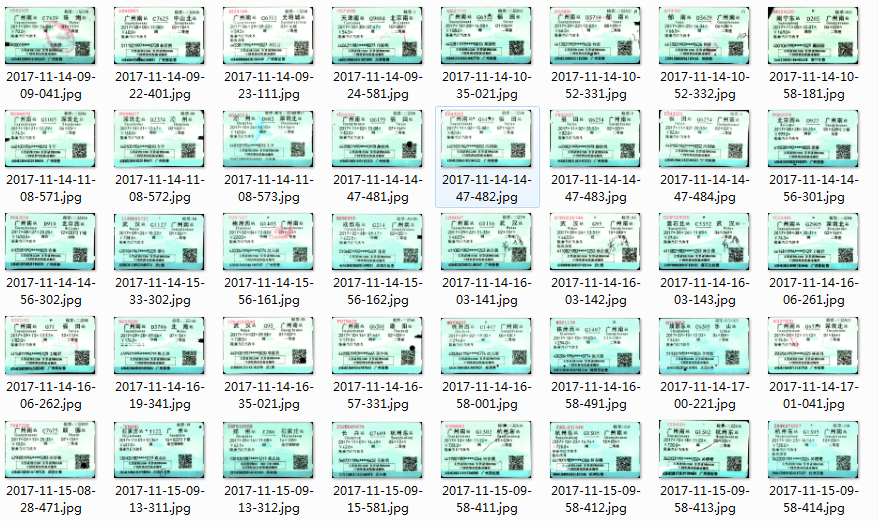
這樣的資料分佈直接拿去去訓練的話,效果可能不會太好(這就是不平衡問題),但是這是後期模型調優時才需要考慮的問題,現在先放一邊。那我們繼續使用上面的圖片分類框架完成本次的票據分類任務。
這次的資料集的儲存方式與交通標誌分類任務的資料儲存不太一樣,這個資料集沒有把資料分成train和test兩個資料夾,所以我們在程式碼中讀取資料時寫的函式應作出相應修改:我們先讀取所有圖片,再借助sklearn的“train_test_split”函式將資料集以一定比例分為訓練集和測試集。
我寫了個load_data2()函式來適應這種資料儲存。
def load_data2(path):
    print("[INFO] loading images...")
    data = []
    labels = []
    # grab the image paths and randomly shuffle them
    imagePaths = sorted(list(paths.list_images(path)))
    random.seed(42)
    random.shuffle(imagePaths)
    # loop over the input images
    for imagePath in imagePaths:
        # load the image, pre-process it, and store it in the data list
        image = cv2.imread(imagePath)
        image = cv2.resize(image, (norm_size, norm_size))
        image = img_to_array(image)
        data.append(image)

        # extract the class label from the image path and update the
        # labels list
        label = int(imagePath.split(os.path.sep)[-2])
        labels.append(label)

    # scale the raw pixel intensities to the range [0, 1]
    data = np.array(data, dtype="float") / 255.0
    labels = np.array(labels)


    # partition the data into training and testing splits using 75% of
    # the data for training and the remaining 25% for testing
    (trainX, testX, trainY, testY) = train_test_split(data,
            labels, test_size=0.25, random_state=42)

    # convert the labels from integers to vectors
    trainY = to_categorical(trainY, num_classes=CLASS_NUM)
    testY = to_categorical(testY, num_classes=CLASS_NUM)
    return trainX,trainY,testX,testY
我們使用了sklearn中的神器train_test_split做了資料集的切分,非常方便。可以看出,load_data2()的返回值就是訓練集圖片和標註+測試集圖片和標註。
在主函式也只需做些許修改就可以完成本次票據分類任務。
if __name__=='__main__':
    args = args_parse()
    file_path = args["dataset"]
    trainX,trainY,testX,testY = load_data2(file_path)
    # construct the image generator for data augmentation
    aug = ImageDataGenerator(rotation_range=30, width_shift_range=0.1,
        height_shift_range=0.1, shear_range=0.2, zoom_range=0.2,
        horizontal_flip=True, fill_mode="nearest")
    train(aug,trainX,trainY,testX,testY,args)
然後設定一些引數,比如圖片歸一化尺寸為64*64,訓練35個epoches。設定完引數後我們開始訓練。
python train.py --dataset ../../invoice_all/train --model invoice.model訓練的過程不算久,大概十來分鐘。訓練過程如下:

繪製出Loss和Accuracy曲線,可以看出,我們訓練後的模型的準確率可以達到97%。直接使用一個LeNet網路就可以跑出這個準確率還是讓人很開心的。

最後再用訓練好的模型預測單張票據,看看效果:
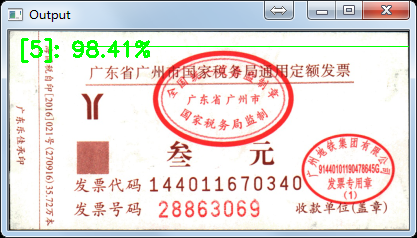
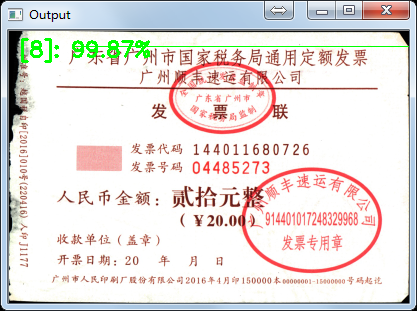
預測正確,deep learning 票據分類任務完成!
三、總結
我們使用了Keras搭建了一個基於LeNet的圖片分類器的通用框架,並用它成功完成兩個實際的分類任務。最後再說說我們現有的模型的一些改進的地方吧。第一,圖片歸一化的尺寸是否合適?比如票據分類任務中,圖片歸一化為64,可能這個尺寸有點小,如果把尺寸改為128或256,效果可能會更好;第二,可以考慮更深的網路,比如VGG,GoogLeNet等;第三,資料增強部分還可以再做一做。
完整程式碼和測試圖片可以在我的github上獲取。
參考資料:
