
grafana + influxdb + telegraf , 伺服器監控
阿新 • • 發佈:2019-01-06
1.grafana安裝
yum install https://s3-us-west-2.amazonaws.com/grafana-releases/release/grafana-4.6.3-1.x86_64.rpm

 #啟動服務
 service grafana-server start
 #檢視服務狀態
 service grafana-server status
2.influxdb安裝 #新建一個源倉庫 vi /etc/yum.repos.d/influxdata.repo #輸入以下內容 [influxdb] name = InfluxData Repository - RHEL $releasever baseurl = https://repos.influxdata.com/rhel/$releasever/$basearch/stable enabled = 1 gpgcheck = 1 gpgkey = https://repos.influxdata.com/influxdb.key #安裝 yum install influxdb #啟動服務 service influxdb start #檢視服務狀態 service influxdb status
3.Telegraf 安裝

yum install telegraf

vi /etc/telegraf/telegraf.conf

 [[outputs.influxdb]]
      ## The full HTTP or UDP endpoint URL for your InfluxDB instance.
      ## Multiple urls can be specified as part of the same cluster,
      ## this means that only ONE of the urls will be written to each interval.
      # urls = ["udp://localhost:8089"] # UDP endpoint example
      urls = ["http://localhost:8086"] # required,這個url可以改成自己host
      ## The target database for metrics (telegraf will create it if not exists).
      database = "telegraf" # required,這個會在influx庫建立一個庫

#啟動服務
service telegraf start
檢視服務狀態
service telegraf status
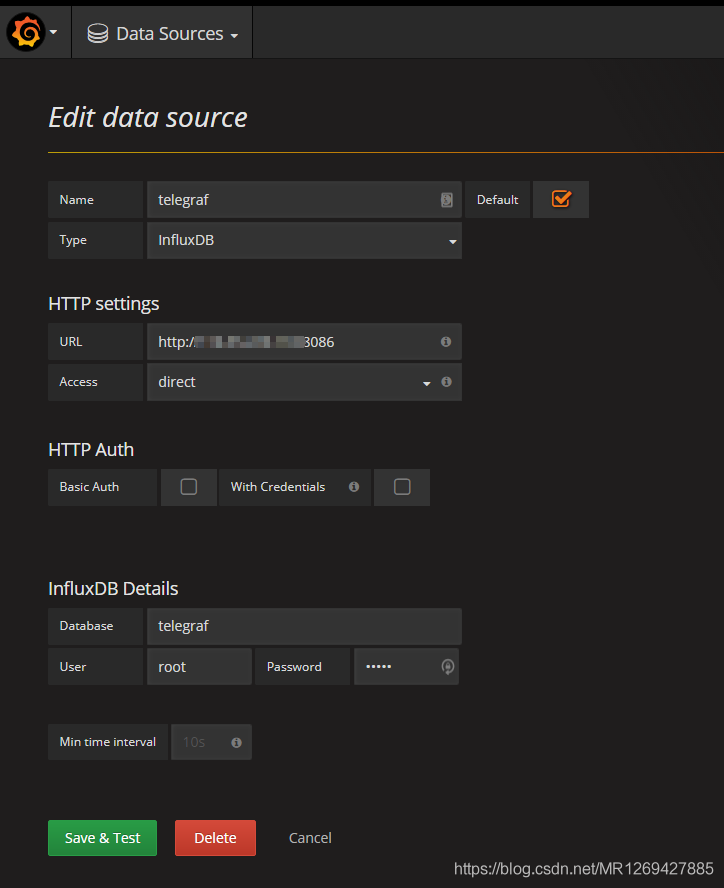
grafana 配置資料來源
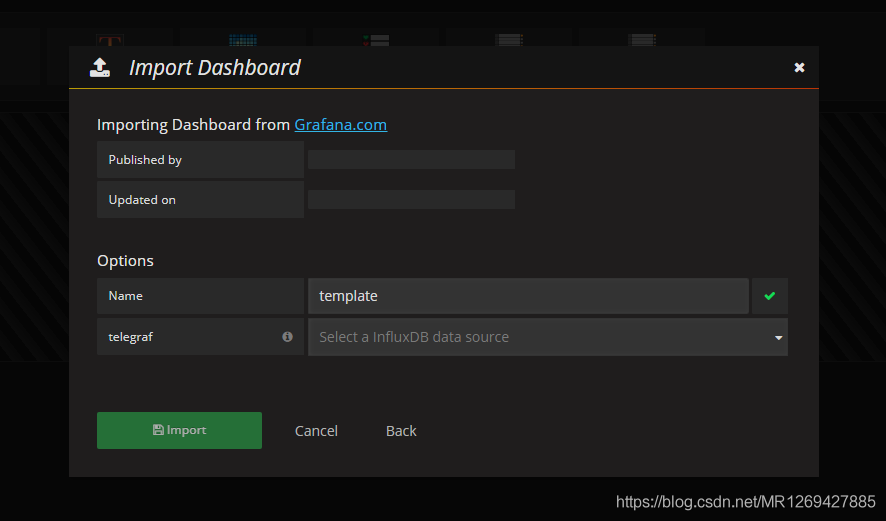
匯入面板模板Json
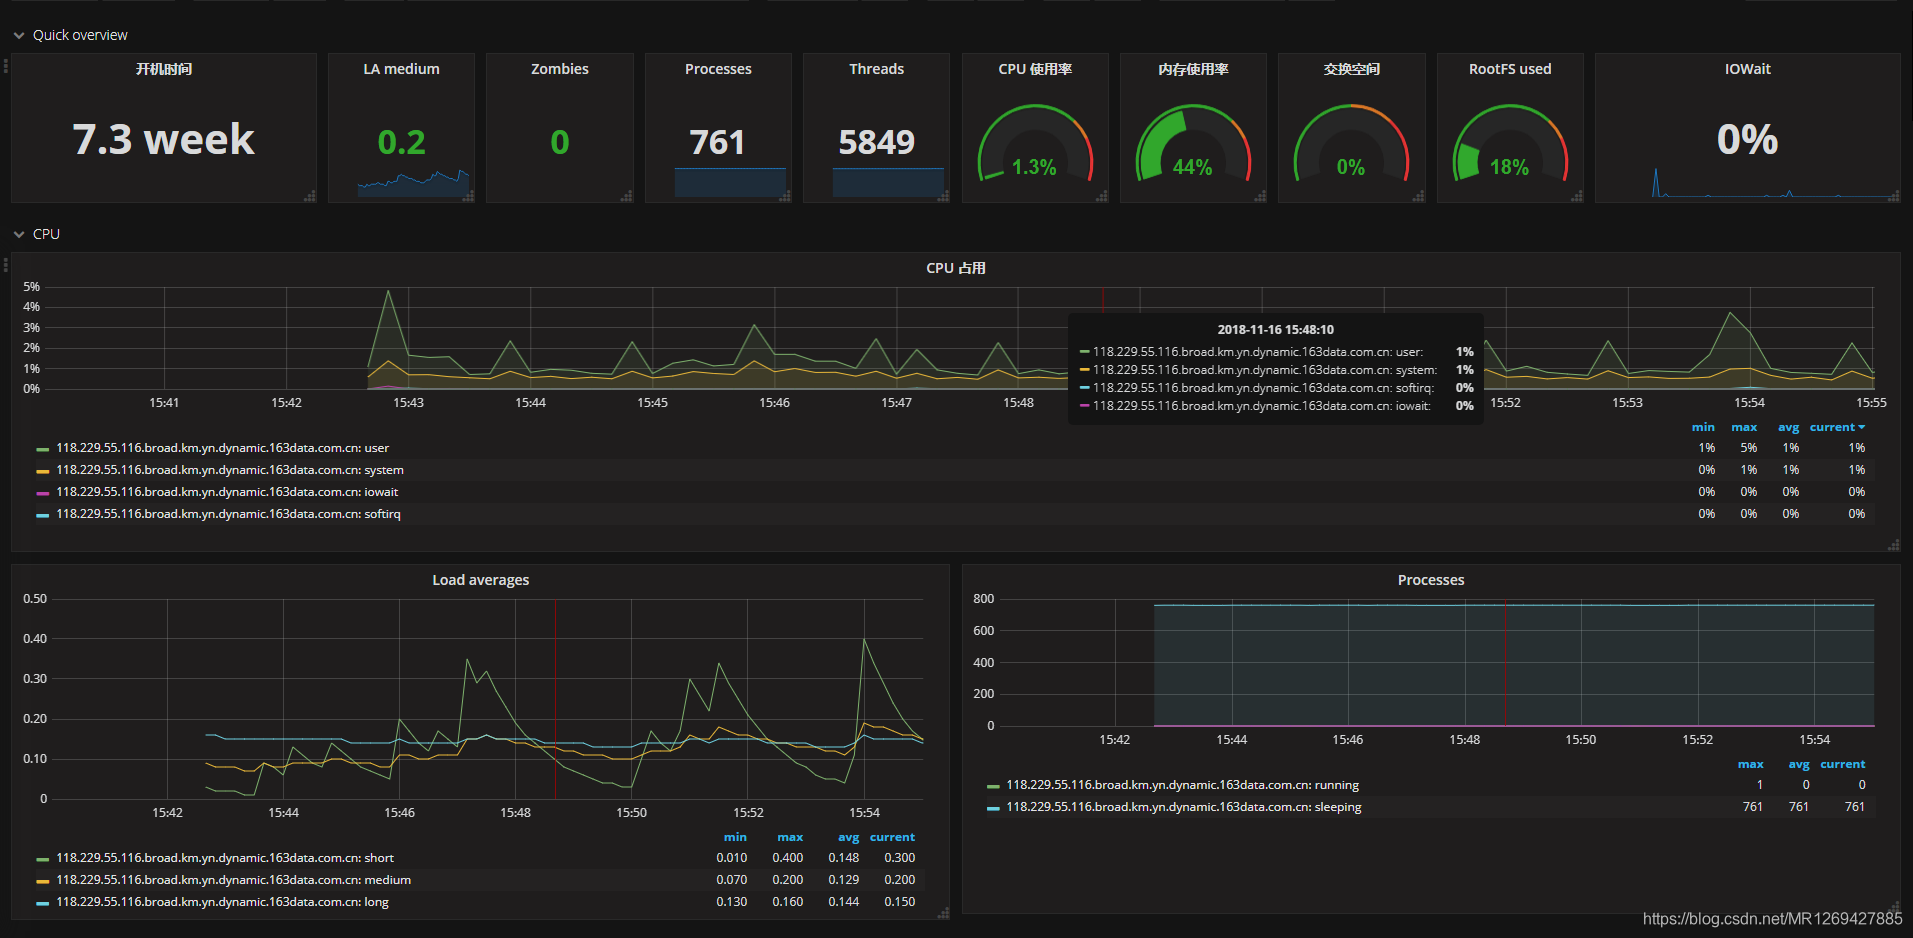
效果示例:
面板Json模板
{
"__inputs": [
{
"name": "DS_TELEGRAF",
"label": "telegraf",
"description": "",
"type": "datasource",
"pluginId": "influxdb",
"pluginName": "InfluxDB"
}
],
"__requires": [
{
"type": "grafana",
"id": "grafana",
"name": "Grafana",
"version": "4.6.3"
},
{
"type": "panel",
"id": "graph",
"name": "Graph",
"version": ""
},
{
"type": "datasource",
"id": "influxdb",
"name": "InfluxDB",
"version": "1.0.0"
},
{
"type": "panel",
"id": "singlestat",
"name": "Singlestat",
"version": ""
}
],
"annotations": {
"list": [
{
"builtIn": 1,
"datasource": "-- Grafana --",
"enable": true,
"hide": true,
"iconColor": "rgba(0, 211, 255, 1)",
"name": "Annotations & Alerts",
"type": "dashboard"
}
]
},
"description": "InfluxDB dashboards for telegraf metrics",
"editable": true,
"gnetId": 928,
"graphTooltip": 1,
"hideControls": false,
"id": null,
"links": [
{
"icon": "external link",
"tags": [],
"targetBlank": true,
"title": "伺服器任務排程管理",
"tooltip": "",
"type": "link",
"url": "http://116.55.229.118:8000/task/list"
}
],
"refresh": "3s",
"rows": [
{
"collapse": false,
"height": "100",
"panels": [
{
"cacheTimeout": null,
"colorBackground": false,
"colorValue": false,
"colors": [
"rgba(245, 54, 54, 0.9)",
"rgba(237, 129, 40, 0.89)",
"rgba(50, 172, 45, 0.97)"
],
"datasource": "${DS_TELEGRAF}",
"decimals": 1,
"editable": true,
"error": false,
"format": "s",
"gauge": {
"maxValue": 100,
"minValue": 0,
"show": false,
"thresholdLabels": false,
"thresholdMarkers": true
},
"height": "150",
"id": 61858,
"interval": null,
"links": [],
"mappingType": 1,
"mappingTypes": [
{
"name": "value to text",
"value": 1
},
{
"name": "range to text",
"value": 2
}
],
"maxDataPoints": 100,
"nullPointMode": "connected",
"nullText": null,
"postfix": "",
"postfixFontSize": "50%",
"prefix": "",
"prefixFontSize": "50%",
"rangeMaps": [
{
"from": "null",
"text": "N/A",
"to": "null"
}
],
"span": 2,
"sparkline": {
"fillColor": "rgba(31, 118, 189, 0.18)",
"full": false,
"lineColor": "rgb(31, 120, 193)",
"show": false
},
"tableColumn": "",
"targets": [
{
"dsType": "influxdb",
"groupBy": [
{
"params": [
"$interval"
],
"type": "time"
},
{
"params": [
"null"
],
"type": "fill"
}
],
"measurement": "system",
"orderByTime": "ASC",
"policy": "default",
"refId": "A",
"resultFormat": "time_series",
"select": [
[
{
"params": [
"uptime"
],
"type": "field"
},
{
"params": [],
"type": "last"
}
]
],
"tags": [
{
"key": "host",
"operator": "=~",
"value": "/^$server$/"
}
]
}
],
"thresholds": "",
"title": "開機時間",
"type": "singlestat",
"valueFontSize": "100%",
"valueMaps": [
{
"op": "=",
"text": "N/A",
"value": "null"
}
],
"valueName": "current"
},
{
"cacheTimeout": null,
"colorBackground": false,
"colorValue": true,
"colors": [
"rgba(50, 172, 45, 0.97)",
"rgba(237, 129, 40, 0.89)",
"rgba(245, 54, 54, 0.9)"
],
"datasource": "${DS_TELEGRAF}",
"decimals": 1,
"editable": true,
"error": false,
"format": "none",
"gauge": {
"maxValue": 100,
"minValue": 0,
"show": false,
"thresholdLabels": false,
"thresholdMarkers": true
},
"height": "150",
"id": 61859,
"interval": null,
"links": [],
"mappingType": 1,
"mappingTypes": [
{
"name": "value to text",
"value": 1
},
{
"name": "range to text",
"value": 2
}
],
"maxDataPoints": 100,
"nullPointMode": "connected",
"nullText": null,
"postfix": "",
"postfixFontSize": "50%",
"prefix": "",
"prefixFontSize": "50%",
"rangeMaps": [
{
"from": "null",
"text": "N/A",
"to": "null"
}
],
"span": 1,
"sparkline": {
"fillColor": "rgba(31, 118, 189, 0.18)",
"full": false,
"lineColor": "rgb(31, 120, 193)",
"show": true
},
"tableColumn": "",
"targets": [
{
"dsType": "influxdb",
"groupBy": [
{
"params": [
"$interval"
],
"type": "time"
},
{
"params": [
"null"
],
"type": "fill"
}
],
"measurement": "system",
"orderByTime": "ASC",
"policy": "default",
"refId": "A",
"resultFormat": "time_series",
"select": [
[
{
"params": [
"load5"
],
"type": "field"
},
{
"params": [],
"type": "last"
}
]
],
"tags": [
{
"key": "host",
"operator": "=~",
"value": "/^$server$/"
}
]
}
],
"thresholds": "4,8,12",
"title": "LA medium",
"type": "singlestat",
"valueFontSize": "80%",
"valueMaps": [
{
"op": "=",
"text": "N/A",
"value": "null"
}
],
"valueName": "current"
},
{
"cacheTimeout": null,
"colorBackground": false,
"colorValue": true,
"colors": [
"rgba(50, 172, 45, 0.97)",
"rgba(237, 129, 40, 0.89)",
"rgba(245, 54, 54, 0.9)"
],
"datasource": "${DS_TELEGRAF}",
"decimals": 0,
"editable": true,
"error": false,
"format": "none",
"gauge": {
"maxValue": 100,
"minValue": 0,
"show": false,
"thresholdLabels": false,
"thresholdMarkers": true
},
"height": "150",
"id": 61862,
"interval": null,
"links": [],
"mappingType": 1,
"mappingTypes": [
{
"name": "value to text",
"value": 1
},
{
"name": "range to text",
"value": 2
}
],
"maxDataPoints": 100,
"nullPointMode": "connected",
"nullText": null,
"postfix": "",
"postfixFontSize": "50%",
"prefix": "",
"prefixFontSize": "50%",
"rangeMaps": [
{
"from": "null",
"text": "N/A",
"to": "null"
}
],
"span": 1,
"sparkline": {
"fillColor": "rgba(31, 118, 189, 0.18)",
"full": false,
"lineColor": "rgb(31, 120, 193)",
"show": false
},
"tableColumn": "",
"targets": [
{
"dsType": "influxdb",
"groupBy": [
{
"params": [
"$interval"
],
"type": "time"
},
{
"params": [
"null"
],
"type": "fill"
}
],
"measurement": "processes",
"policy": "default",
"refId": "A",
"resultFormat": "time_series",
"select": [
[
{
"params": [
"zombies"
],
"type": "field"
},
{
"params": [],
"type": "last"
}
]
],
"tags": [
{
"key": "host",
"operator": "=~",
"value": "/^$server$/"
}
]
}
],
"thresholds": "1,5,10",
"title": "Zombies",
"type": "singlestat",
"valueFontSize": "80%",
"valueMaps": [
{
"op": "=",
"text": "N/A",
"value": "null"
}
],
"valueName": "current"
},
{
"cacheTimeout": null,
"colorBackground": false,
"colorValue": true,
"colors": [
"rgba(50, 172, 45, 0.97)",
"rgba(237, 129, 40, 0.89)",
"rgba(245, 54, 54, 0.9)"
],
"datasource": "${DS_TELEGRAF}",
"decimals": 0,
"editable": true,
"error": false,
"format": "none",
"gauge": {
"maxValue": 100,
"minValue": 0,
"show": false,
"thresholdLabels": false,
"thresholdMarkers": true
},
"height": "150",
"id": 61864,
"interval": null,
"links": [],
"mappingType": 1,
"mappingTypes": [
{
"name": "value to text",
"value": 1
},
{
"name": "range to text",
"value": 2
}
],
"maxDataPoints": 100,
"nullPointMode": "connected",
"nullText": null,
"postfix": "",
"postfixFontSize": "50%",
"prefix": "",
"prefixFontSize": "50%",
"rangeMaps": [
{
"from": "null",
"text": "N/A",
"to": "null"
}
],
"span": 1,
"sparkline": {
"fillColor": "rgba(31, 118, 189, 0.18)",
"full": false,
"lineColor": "rgb(31, 120, 193)",
"show": true
},
"tableColumn": "",
"targets": [
{
"dsType": "influxdb",
"groupBy": [
{
"params": [
"$interval"
],
"type": "time"
},
{
"params": [
"null"
],
"type": "fill"
}
],
"measurement": "processes",
"policy": "default",
"refId": "A",
"resultFormat": "time_series",
"select": [
[
{
"params": [
"total"
],
"type": "field"
},
{
"params": [],
"type": "last"
}
]
],
"tags": [
{
"key": "host",
"operator": "=~",
"value": "/^$server$/"
}
]
}
],
"thresholds": "1,5,10",
"title": "Processes",
"type": "singlestat",
"valueFontSize": "80%",
"valueMaps": [
{
"op": "=",
"text": "N/A",
"value": "null"
}
],
"valueName": "current"
},
{
"cacheTimeout": null,
"colorBackground": false,
"colorValue": true,
"colors": [
"rgba(50, 172, 45, 0.97)",
"rgba(237, 129, 40, 0.89)",
"rgba(245, 54, 54, 0.9)"
],
"datasource": "${DS_TELEGRAF}",
"decimals": 0,
"editable": true,
"error": false,
"format": "none",
"gauge": {
"maxValue": 100,
"minValue": 0,
"show": false,
"thresholdLabels": false,
"thresholdMarkers": true
},
"height": "150",
"id": 61865,
"interval": null,
"links": [],
"mappingType": 1,
"mappingTypes": [
{
"name": "value to text",
"value": 1
},
{
"name": "range to text",
"value": 2
}
],
"maxDataPoints": 100,
"nullPointMode": "connected",
"nullText": null,
"postfix": "",
"postfixFontSize": "50%",
"prefix": "",
"prefixFontSize": "50%",
"rangeMaps": [
{
"from": "null",
"text": "N/A",
"to": "null"
}
],
"span": 1,
"sparkline": {
"fillColor": "rgba(31, 118, 189, 0.18)",
"full": false,
"lineColor": "rgb(31, 120, 193)",
"show": true
},
"tableColumn": "",
"targets": [
{
"dsType": "influxdb",
"groupBy": [
{
"params": [
"$interval"
],
"type": "time"
},
{
"params": [
"null"
],
"type": "fill"
}
],
"measurement": "processes",
"policy": "default",
"refId": "A",
"resultFormat": "time_series",
"select": [
[
{
"params": [
"total_threads"
],
"type": "field"
},
{
"params": [],
"type": "last"
}
]
],
"tags": [
{
"key": "host",
"operator": "=~",
"value": "/^$server$/"
}
]
}
],
"thresholds": "1,5,10",
"title": "Threads",
"type": "singlestat",
"valueFontSize": "80%",
"valueMaps": [
{
"op": "=",
"text": "N/A",
"value": "null"
}
],
"valueName": "current"
},
{
"cacheTimeout": null,
"colorBackground": false,
"colorValue": true,
"colors": [
"rgba(50, 172, 45, 0.97)",
"rgba(237, 129, 40, 0.89)",
"rgba(245, 54, 54, 0.9)"
],
"datasource": "${DS_TELEGRAF}",
"editable": true,
"error": false,
"format": "percent",
"gauge": {
"maxValue": 100,
"minValue": 0,
"show": true,
"thresholdLabels": false,
"thresholdMarkers": true
},
"height": "150",
"id": 61861,
"interval": null,
"links": [],
"mappingType": 1,
"mappingTypes": [
{
"name": "value to text",
"value": 1
},
{
"name": "range to text",
"value": 2
}
],
"maxDataPoints": 100,
"nullPointMode": "connected",
"nullText": null,
"postfix": "",
"postfixFontSize": "50%",
"prefix": "",
"prefixFontSize": "50%",
"rangeMaps": [
{
"from": "null",
"text": "N/A",
"to": "null"
}
],
"span": 1,
"sparkline": {
"fillColor": "rgba(31, 118, 189, 0.18)",
"full": false,
"lineColor": "rgb(31, 120, 193)",
"show": false
},
"tableColumn": "",
"targets": [
{
"dsType": "influxdb",
"groupBy": [
{
"params": [
"$interval"
],
"type": "time"
},
{
"params": [
"null"
],
"type": "fill"
}
],
"measurement": "cpu",
"orderByTime": "ASC",
"policy": "default",
"refId": "A",
"resultFormat": "time_series",
"select": [
[
{
"params": [
"usage_idle"
],
"type": "field"
},
{
"params": [],
"type": "last"
},
{
"params": [
"* -1 + 100"
],
"type": "math"
}
]
],
"tags": [
{
"key": "host",
"operator": "=~",
"value": "/^$server$/"
},
{
"condition": "AND",
"key": "cpu",
"operator": "=",
"value": "cpu-total"
}
]
}
],
"thresholds": "70,80,90",
"title": "CPU 使用率",
"type": "singlestat",
"valueFontSize": "80%",
"valueMaps": [
{
"op": "=",
"text": "N/A",
"value": "null"
}
],
"valueName": "current"
},
{
"cacheTimeout": null,
"colorBackground": false,
"colorValue": true,
"colors": [
"rgba(50, 172, 45, 0.97)",
"rgba(237, 129, 40, 0.89)",
"rgba(245, 54, 54, 0.9)"
],
"datasource": "${DS_TELEGRAF}",
"editable": true,
"error": false,
"format": "percent",
"gauge": {
"maxValue": 100,
"minValue": 0,
"show": true,
"thresholdLabels": false,
"thresholdMarkers": true
},
"height": "150",
"id": 61860,
"interval": null,
"links": [],
"mappingType": 1,
"mappingTypes": [
{
"name": "value to text",
"value": 1
},
{
"name": "range to text",
"value": 2
}
],
"maxDataPoints": 100,
"nullPointMode": "connected",
"nullText": null,
"postfix": "",
"postfixFontSize": "50%",
"prefix": "",
"prefixFontSize": "50%",
"rangeMaps": [
{
"from": "null",
"text": "N/A",
"to": "null"
}
],
"span": 1,
"sparkline": {
"fillColor": "rgba(31, 118, 189, 0.18)",
"full": false,
"lineColor": "rgb(31, 120, 193)",
"show": false
},
"tableColumn": "",
"targets": [
{
"dsType": "influxdb",
"groupBy": [
{
"params": [
"$interval"
],
"type": "time"
},
{
"params": [
"null"
],
"type": "fill"
}
],
"measurement": "mem",
"orderByTime": "ASC",
"policy": "default",
"refId": "A",
"resultFormat": "time_series",
"select": [
[
{
"params": [
"used_percent"
],
"type": "field"
},
{
"params": [],
"type": "last"
}
]
],
"tags": [
{
"key": "host",
"operator": "=~",
"value": "/^$server$/"
}
]
}
],
"thresholds": "70,80,90",
"title": "記憶體使用率",
"type": "singlestat",
"valueFontSize": "80%",
"valueMaps": [
{
"op": "=",
"text": "N/A",
"value": "null"
}
],
"valueName": "current"
},
{
"cacheTimeout": null,
"colorBackground": false,
"colorValue": true,
"colors": [
"rgba(50, 172, 45, 0.97)",
"rgba(237, 129, 40, 0.89)",
"rgba(245, 54, 54, 0.9)"
],
"datasource": "${DS_TELEGRAF}",
"decimals": 0,
"editable": true,
"error": false,
"format": "percent",
"gauge": {
"maxValue": 100,
"minValue": 0,
"show": true,
"thresholdLabels": false,
"thresholdMarkers": true
},
"height": "150",
"id": 61863,
"interval": null,
"links": [],
"mappingType": 1,
"mappingTypes": [
{
"name": "value to text",
"value": 1
},
{
"name": "range to text",
"value": 2
}
],
"maxDataPoints": 100,
"nullPointMode": "connected",
"nullText": null,
"postfix": "",
"postfixFontSize": "50%",
"prefix": "",
"prefixFontSize": "50%",
"rangeMaps": [
{
"from": "null",
"text": "N/A",
"to": "null"
}
],
"span": 1,
"sparkline": {
"fillColor": "rgba(31, 118, 189, 0.18)",
"full": false,
"lineColor": "rgb(31, 120, 193)",
"show": false
},
"tableColumn": "",
"targets": [
{
"dsType": "influxdb",
"groupBy": [
{
"params": [
"$interval"
],
"type": "time"
},
{
"params": [
"null"
],
"type": "fill"
}
],
"measurement": "swap",
"orderByTime": "ASC",
"policy": "default",
"refId": "A",
"resultFormat": "time_series",
"select": [
[
{
"params": [
"used_percent"
],
"type": "field"
},
{
"params": [],
"type": "last"
}
]
],
"tags": [
{
"key": "host",
"operator": "=~",
"value": "/^$server$/"
}
]
}
],
"thresholds": "50,70,90",
"title": "交換空間",
"type": "singlestat",
"valueFontSize": "80%",
"valueMaps": [
{
"op": "=",
"text": "N/A",
"value": "null"
}
],
"valueName": "current"
},
{
"cacheTimeout": null,
"colorBackground": false,
"colorValue": true,
"colors": [
"rgba(50, 172, 45, 0.97)",
"rgba(237, 129, 40, 0.89)",
"rgba(245, 54, 54, 0.9)"
],
"datasource": "${DS_TELEGRAF}",
"decimals": 0,
"editable": true,
"error": false,
"format": "percent",
"gauge": {
"maxValue": 100,
"minValue": 0,
"show": true,
"thresholdLabels": false,
"thresholdMarkers": true
},
"height": "150",
"id": 61866,
"interval": null,
"links": [],
"mappingType": 1,
"mappingTypes": [
{
"name": "value to text",
"value": 1
},
{
"name": "range to text",
"value": 2
}
],
"maxDataPoints": 100,
"nullPointMode": "connected",
"nullText": null,
"postfix": "",
"postfixFontSize": "50%",
"prefix": "",
"prefixFontSize": "50%",
"rangeMaps": [
{
"from": "null",
"text": "N/A",
"to": "null"
}
],
"span": 1,
"sparkline": {
"fillColor": "rgba(31, 118, 189, 0.18)",
"full": false,
"lineColor": "rgb(31, 120, 193)",
"show": false
},
"tableColumn": "",
"targets": [
{
"dsType": "influxdb",
"groupBy": [
{
"params": [
"$interval"
],
"type": "time"
},
{
"params": [
"null"
],
"type": "fill"
}
],
"measurement": "disk",
"policy": "default",
"refId": "A",
"resultFormat": "time_series",
"select": [
[
{
"params": [
"used_percent"
],
"type": "field"
},
{
"params": [],
"type": "last"
}
]
],
"tags": [
{
"key": "host",
"operator": "=~",
"value": "/^$server$/"
},
{
"condition": "AND",
"key": "path",
"operator": "=",
"value": "/"
}
]
}
],
"thresholds": "70,80,90",
"title": "RootFS used",
"type": "singlestat",
"valueFontSize": "80%",
"valueMaps": [
{
"op": "=",
"text": "N/A",
"value": "null"
}
],
"valueName": "current"
},
{
"cacheTimeout": null,
"colorBackground": false,
"colorValue": false,
"colors": [
"rgba(245, 54, 54, 0.9)",
"rgba(237, 129, 40, 0.89)",
"rgba(50, 172, 45, 0.97)"
],
"datasource": "${DS_TELEGRAF}",
"decimals": 2,
"editable": true,
"error": false,
"format": "percent",
"gauge": {
"maxValue": 100,
"minValue": 0,
"show": false,
"thresholdLabels": false,
"thresholdMarkers": true
},
"height": "150",
"id": 61867,
"interval": null,
"links": [],
"mappingType": 1,
"mappingTypes": [
{
"name": "value to text",
"value": 1
},
{
"name": "range to text",
"value": 2
}
],
"maxDataPoints": 100,
"nullPointMode": "connected",
"nullText": null,
"postfix": "",
"postfixFontSize": "50%",
"prefix": "",
"prefixFontSize": "50%",
"rangeMaps": [
{
"from": "null",
"text": "N/A",
"to": "null"
}
],
"span": 2,
"sparkline": {
"fillColor": "rgba(31, 118, 189, 0.18)",
"full": false,
"lineColor": "rgb(31, 120, 193)",
"show": true
},
"tableColumn": "",
"targets": [
{
"dsType": "influxdb",
"groupBy": [
{
"params": [
"$interval"
],
"type": "time"
},
{
"params": [
"null"
],
"type": "fill"
}
],
"measurement": "cpu",
"policy": "default",
"query": "SELECT non_negative_derivative(mean(\"usage_iowait\"), 1s) FROM \"cpu\" WHERE \"host\" =~ /^$server$/ AND \"cpu\" = 'cpu-total' AND $timeFilter GROUP BY time($interval) fill(null)",
"rawQuery": false,
"refId": "A",
"resultFormat": "time_series",
"select": [
[
{
"params": [
"usage_iowait"
],
"type": "field"
},
{
"params": [],
"type": "last"
}
]
],
"tags": [
{
"key": "host",
"operator": "=~",
"value": "/^$server$/"
},
{
"condition": "AND",
"key": "cpu",
"operator": "=",
"value": "cpu-total"
}
]
}
],
"thresholds": "30,40,50",
"title": "IOWait",
"transparent": false,
"type": "singlestat",
"valueFontSize": "100%",
"valueMaps": [
{
"op": "=",
"text": "N/A",
"value": "null"
}
],
"valueName": "current"
}
],
"repeat": null,
"repeatIteration": null,
"repeatRowId": null,
"showTitle": true,
"title": "Quick overview",
"titleSize": "h6"
},
{
"collapse": false,
"height": 224,
"panels": [
{
"aliasColors": {},
"bars": false,
"dashLength": 10,
"dashes": false,
"datasource": "${DS_TELEGRAF}",
"editable": true,
"error": false,
"fill": 1,
"grid": {},
"height": "300",
"id": 28239,
"interval": "$inter",
"legend": {
"alignAsTable": true,
"avg": true,
"current": true,
"hideEmpty": true,
"hideZero": true,
"max": true,
"min": true,
"rightSide": false,
"show": true,
"sort": "current",
"sortDesc": true,
"total": false,
"values": true
},
"lines": true,
"linewidth": 1,
"links": [],
"nullPointMode": "connected",
"percentage": false,
"pointradius": 5,
"points": false,
"renderer": "flot",
"seriesOverrides": [],
"spaceLength": 10,
"span": 12,
"stack": false,
"steppedLine": false,
"targets": [
{
"alias": "$tag_host: $col",
"dsType": "influxdb",
"function": "mean",
"groupBy": [
{
"interval": "auto",
"params": [
"auto"
],
"type": "time"
},
{
"key": "host",
"params": [
"tag"
],
"type": "tag"
}
],
"hide": false,
"measurement": "cpu_percentageBusy",
"orderByTime": "ASC",
"policy": "default",
"query": "SELECT mean(usage_user) as \"user\", mean(usage_system) as \"system\", mean(usage_softirq) as \"softirq\", mean(usage_steal) as \"steal\", mean(usage_nice) as \"nice\", mean(usage_irq) as \"irq\", mean(usage_iowait) as \"iowait\", mean(usage_guest) as \"guest\", mean(usage_guest_nice) as \"guest_nice\" FROM \"cpu\" WHERE \"host\" =~ /$server$/ and cpu = 'cpu-total' AND $timeFilter GROUP BY time($interval), *",
"rawQuery": true,
"refId": "B",
"resultFormat": "time_series",
"select": [
[
{
"params": [
"value"
],
"type": "field"
},
{
"params": [],
"type": "mean"
}
]
],
"tags": []
}
],
"thresholds": [],
"timeFrom": null,
"timeShift": null,
"title": "CPU 佔用",
"tooltip": {
"msResolution": false,
"shared": true,
"sort": 0,
"value_type": "cumulative"
},
"type": "graph",
"xaxis": {
"buckets": null,
"mode": "time",
"name": null,
"show": true,
"values": []
},
"yaxes": [
{
"format": "percent",
"logBase": 1,
"max": null,
"min": null,
"show": true
},
{
"format": "short",
"logBase": 1,
"max": null,
"min": null,
"show": true
}
]
},
{
"aliasColors": {},
"bars": false,
"dashLength": 10,
"dashes": false,
"datasource": "${DS_TELEGRAF}",
"editable": true,
"error": false,
"fill": 0,
"grid": {},
"height": "350",
"id": 54694,
"interval": "$inter",
"legend": {
"alignAsTable": true,
"avg": true,
"current": true,
"max": true,
"min": true,
"show": true,
"total": false,
"values": true
},
"lines": true,
"linewidth": 1,
"links": [],
"nullPointMode": "connected",
"percentage": false,
"pointradius": 5,
"points": false,
"renderer": "flot",
"seriesOverrides": [],
"spaceLength": 10,
"span": 6,
"stack": false,
"steppedLine": false,
"targets": [
{
"alias": "$tag_host: $col",
"dsType": "influxdb",
"function": "mean",
"groupBy": [
{
"interval": "auto",
"params": [
"auto"
],
"type": "time"
},
{
"key": "host",
"params": [
"tag"
],
"type": "tag"
}
],
"measurement": "system_load1",
"policy": "default",
"query": "SELECT mean(load1) as short,mean(load5) as medium,mean(load15) as long FROM \"system\" WHERE host =~ /$server$/ AND $timeFilter GROUP BY time($interval), * ORDER BY asc",
"rawQuery": true,
"refId": "A",
"resultFormat": "time_series",
"select": [
[
{
"params": [
"value"
],
"type": "field"
},
{
"params": [],
"type": "mean"
}
]
],
"tags": []
}
],
"thresholds": [],
"timeFrom": null,
"timeShift": null,
"title": "Load averages",
"tooltip": {
"msResolution": false,
"shared": true,
"sort": 0,
"value_type": "cumulative"
},
"type": "graph",
"xaxis": {
"buckets": null,
"mode": "time",
"name": null,
"show": true,
"values": []
},
"yaxes": [
{
"format": "short",
"logBase": 1,
"max": null,
"min": 0,
"show": true
},
{
"format": "short",
"logBase": 1,
"max": null,
"min": null,
"show": true
}
]
},
{
"aliasColors": {},
"bars": false,
"dashLength": 10,
"dashes": false,
"datasource": "${DS_TELEGRAF}",
"editable": true,
"error": false,
"fill": 1,
"height": "350",
"id": 61852,
"legend": {
"alignAsTable": true,
"avg": true,
"current": true,
"hideEmpty": true,
"hideZero": true,
"max": true,
"min": false,
"rightSide": false,
"show": true,
"total": false,
"values": true
},
"lines": true,
"linewidth": 1,
"links": [],
"nullPointMode": "connected",
"percentage": false,
"pointradius": 5,
"points": false,
"renderer": "flot",
"seriesOverrides": [],
"spaceLength": 10,
"span": 6,
"stack": false,
"steppedLine": false,
"targets": [
{
"alias": "$tag_host: $col",
"dsType": "influxdb",
"groupBy": [
{
"params": [
"$interval"
],
"type": "time"
},
{
"params": [
"null"
],
"type": "fill"
}
],
"measurement": "processes",
"policy": "default",
"query": "SELECT mean(running) as running, mean(blocked) as blocked, mean(sleeping) as sleeping, mean(stopped) as stopped, mean(zombies) as zombies, mean(paging) as paging, mean(unknown) as unknown FROM \"processes\" WHERE host =~ /$server$/ AND $timeFilter GROUP BY time($interval), host ORDER BY asc",
"rawQuery": true,
"refId": "B",
"resultFormat": "time_series",
"select": [
[
{
"params": [
"blocked"
],
"type": "field"
},
{
"params": [],
"type": "mean"
}
]
],
"tags": [
{
"key": "host",
"operator": "=~",
"value": "/^$server$/"
}
]
}
],
"thresholds": [],
"timeFrom": null,
"timeShift": null,
"title": "Processes",
"tooltip": {
"msResolution": false,
"shared": true,
"sort": 0,
"value_type": "individual"
},
"type": "graph",
"xaxis": {
"buckets": null,
"mode": "time",
"name": null,
"show": true,
"values": []
},
"yaxes": [
{
"format": "short",
"label": null,
"logBase": 1,
"max": null,
"min": null,
"show": true
},
{
"format": "short",
"label": null,
"logBase": 1,
"max": null,
"min": null,
"show": true
}
]
}
],
"repeat": null,
"repeatIteration": null,
"repeatRowId": null,
"showTitle": true,
"title": "CPU",
"titleSize": "h6"
},
{
"collapse": false,
"height": 250,
"panels": [
{
"aliasColors": {},
"bars": false,
"dashLength": 10,
"dashes": false,
"datasource": "${DS_TELEGRAF}",
"editable": true,
"error": false,
"fill": 1,
"grid": {},
"height": "400",
"id": 12054,
"interval": "$inter",
"legend": {
"alignAsTable": true,
"avg": true,
"current": true,
"max": true,
"min": true,
"show": true,
"sort": "current",
"sortDesc": true,
"total": false,
"values": true
},
"lines": true,
"linewidth": 1,
"links": [],
"nullPointMode": "connected",
"percentage": false,
"pointradius": 5,
"points": false,
"renderer": "flot",
"seriesOverrides": [
{
"alias": "/total/",
"color": "#BF1B00",
"fill": 0,
"linewidth": 2
}
],
"spaceLength": 10,
"span": 12,
"stack": false,
"steppedLine": false,
"targets": [
{
"alias": "$tag_host: $col",
"dsType": "influxdb",
"function": "mean",
"groupBy": [
{
"interval": "auto",
"params": [
"auto"
],
"type": "time"
},
{
"key": "host",
"params": [
"tag"
],
"type": "tag"
}
],
"measurement": "mem_inactive",
"policy": "default",
"query": "SELECT mean(total) as total, mean(used) as used, mean(cached) as cached, mean(free) as free, mean(buffered) as buffered FROM \"mem\" WHERE host =~ /$server$/ AND $timeFilter GROUP BY time($interval), host ORDER BY asc",
"rawQuery": true,
"refId": "A",
"resultFormat": "time_series",
"select": [
[
{
"params": [
"value"
],
"type": "field"
},
{
"params": [],
"type": "mean"
}
]
],
"tags": []
}
],
"thresholds": [],
"timeFrom": null,
"timeShift": null,
"title": "Memory usage",
"tooltip": {
"msResolution": false,
"shared": true,
"sort": 0,
"value_type": "cumulative"
},
"type": "graph",
"xaxis": {
"buckets": null,
"mode": "time",
"name": null,
"show": true,
"values": []
},
"yaxes": [
{
"format": "bytes",
"logBase": 1,
"max": null,
"min": 0,
"show": true
},
{
"format": "short",
"logBase": 1,
"max": null,
"min": null,
"show": true
}
]
}
],
"repeat": null,
"repeatIteration": null,
"repeatRowId": null,
"showTitle": true,
"title": "Memory",
"titleSize": "h6"
},
{
"collapse": false,
"height": 250,
"panels": [
{
"aliasColors": {},
"bars": false,
"dashLength": 10,
"dashes": false,
"datasource": "${DS_TELEGRAF}",
"editable": true,
"error": false,
"fill": 1,
"height": "",
"id": 61855,
"legend": {
"alignAsTable": true,
"avg": true,
"current": true,
"max": true,
"min": true,
"rightSide": false,
"show": true,
"total": false,
"values": true
},
"lines": true,
"linewidth": 1,
"links": [],
"nullPointMode": "connected",
"percentage": false,
"pointradius": 5,
"points": false,
"renderer": "flot",
"seriesOverrides": [],
"spaceLength": 10,
"span": 4,
"stack": false,
"steppedLine": false,
"targets": [
{
"alias": "$tag_host: $col",
"dsType": "influxdb",
"groupBy": [
{
"params": [
"$interval"
],
"type": "time"
},
{
"params": [
"null"
],
"type": "fill"
}
],
"measurement": "processes",
"policy": "default",
"query": "SELECT non_negative_derivative(mean(context_switches),1s)as \"context switches\" FROM \"kernel\" WHERE host =~ /$server$/ AND $timeFilter GROUP BY time($interval), host ORDER BY asc",
"rawQuery": true,
"refId": "B",
"resultFormat": "time_series",
"select": [
[
{
"params": [
"blocked"
],
"type": "field"
},
{
"params": [],
"type": "mean"
}
]
],
"tags": [
{
"key": "host",
"operator": "=~",
"value": "/^$server$/"
}
]
}
],
"thresholds": [],
"timeFrom": null,
"timeShift": null,
"title": "Context switches",
"tooltip": {
"msResolution": false,
"shared": true,
"sort": 0,
"value_type": "individual"
},
"type": "graph",
"xaxis": {
"buckets": null,
"mode": "time",
"name": null,
"show": true,
"values": []
},
"yaxes": [
{
"format": "ops",
"label": null,
"logBase": 1,
"max": null,
"min": null,
"show": true
},
{
"format": "short",
"label": null,
"logBase": 1,
"max": null,
"min": null,
"show": true
}
]
},
{
"aliasColors": {},
"bars": false,
"dashLength": 10,
"dashes": false,
"datasource": "${DS_TELEGRAF}",
"editable": true,
"error": false,
"fill": 1,
"height": "",
"id": 61960,
"legend": {
"alignAsTable": true,
"avg": true,
"current": true,
"max": true,
"min": true,
"rightSide": false,
"show": true,
"total": false,
"values": true
},
"lines": true,
"linewidth": 1,
"links": [],
"nullPointMode": "connected",
"percentage": false,
"pointradius": 5,
"points": false,
"renderer": "flot",
"seriesOverrides": [],
"spaceLength": 10,
"span": 4,
"stack": false,
"steppedLine": false,
"targets": [
{
"alias": "$tag_host: $col",
"dsType": "influxdb",
"groupBy": [
{
"params": [
"$interval"
],
"type": "time"
},
{
"params": [
"null"
],
"type": "fill"
}
],
"measurement": "kernel",
"policy": "default",
"query": "SELECT non_negative_derivative(mean(processes_forked),1s) as forks FROM \"kernel\" WHERE \"host\" =~ /^$server$/ AND $timeFilter GROUP BY time($interval), host fill(null)",
"rawQuery": true,
"refId": "B",
"resultFormat": "time_series",
"select": [
[
{
"params": [
"processes_forked"
],
"type": "field"
},
{
"params": [],
"type": "mean"
}
]
],
"tags": [
{
"key": "host",
"operator": "=~",
"value": "/^$server$/"
}
]
}
],
"thresholds": [],
"timeFrom": null,
"timeShift": null,
"title": "Forks",
"tooltip": {
"msResolution": false,
"shared": true,
"sort": 0,
"value_type": "individual"
},
"type": "graph",
"xaxis": {
"buckets": null,
"mode": "time",
"name": null,
"show": true,
"values": []
},
"yaxes": [
{
"format": "ops",
"label": null,
"logBase": 1,
"max": null,
"min": null,
"show": true
},
{
"format": "short",
"label": null,
"logBase": 1,
"max": null,
"min": null,
"show": true
}
]
},
{
"aliasColors": {},
"bars": false,
"dashLength": 10,
"dashes": false,
"datasource": "${DS_TELEGRAF}",
"editable": true,
"error": false,
"fill": 1,
"height": "",
"id": 62042,
"legend": {
"alignAsTable": true,
"avg": true,
"current": true,
"max": true,
"min": true,
"rightSide": false,
"show": true,
"total": false,
"values": true
},
"lines": true,
"linewidth": 1,
"links": [],
"nullPointMode": "connected",
"percentage": false,
"pointradius": 5,
"points": false,
"renderer": "flot",
"seriesOverrides": [
{
"alias": "/max/",
"color": "#890F02",
"fill": 0
},
{
"alias": "/opened/",
"color": "#0A437C"
}
],
"spaceLength": 10,
"span": 4,
"stack": false,
"steppedLine": false,
"targets": [
{
"alias": "$tag_host: $col",
"dsType": "influxdb",
"groupBy": [
{
"params": [
"$interval"
],
"type": "time"
},
{
"params": [
"null"
],
"type": "fill"
}
],
"measurement": "kernel",
"orderByTime": "ASC",
"policy": "default",
"query": "SELECT mean(\"file-max\") as max FROM \"linux_sysctl_fs\" WHERE \"host\" =~ /^$server$/ AND $timeFilter GROUP BY time($interval), host fill(null)",
"rawQuery": true,
"refId": "B",
"resultFormat": "time_series",
"select": [
[
{
"params": [
"processes_forked"
],
"type": "field"
},
{
"params": [],
"type": "mean"
}
]
],
"tags": [
{
"key": "host",
"operator": "=~",
"value": "/^$server$/"
}
]
},
{
"alias": "$tag_host: $col",
"dsType": "influxdb",
"groupBy": [
{
"params": [
"$interval"
],
"type": "time"
},
{
"params": [
"null"
],
"type": "fill"
}
],
"measurement": "kernel",
"orderByTime": "ASC",
"policy": "default",
"query": "SELECT mean(\"file-nr\") as opened FROM \"linux_sysctl_fs\" WHERE \"host\" =~ /^$server$/ AND $timeFilter GROUP BY time($interval), host fill(null)",
"rawQuery": true,
"refId": "A",
"resultFormat": "time_series",
"select": [
[
{
"params": [
"processes_forked"
],
"type": "field"
},
{
"params": [],
"type": "mean"
}
]
],
"tags": [
{
"key": "host",
"operator": "=~",
"value": "/^$server$/"
}
]
}
],
"thresholds": [],
"timeFrom": null,
"timeShift": null,
"title": "File descriptors",
"tooltip": {
"msResolution": false,
"shared": true,
"sort": 0,
"value_type": "individual"
},
"type": "graph",
"xaxis": {
"buckets": null,
"mode": "time",
"name": null,
"show": true,
"values": []
},
"yaxes": [
{
"format": "short",
"label": null,
"logBase": 1,
"max": null,
"min": null,
"show": true
},
{
"format": "short",
"label": null,
"logBase": 1,
"max": null,
"min": null,
"show": true
}
]
}
],
"repeat": null,
"repeatIteration": null,
"repeatRowId": null,
"showTitle": true,
"title": "Kernel",
"titleSize": "h6"
},
{
"collapse": false,
"height": 250,
"panels": [
{
"aliasColors": {},
"bars": false,
"dashLength": 10,
"dashes": false,
"datasource": "${DS_TELEGRAF}",
"editable": true,
"error": false,
"fill": 1,
"grid": {},
"height": "",
"id": 61868,
"interval": "$inter",
"legend": {
"alignAsTable": true,
"avg": true,
"current": true,
"hideEmpty": true,
"hideZero": true,
"max": true,
"min": false,
"rightSide": false,
"show": true,
"sort": "current",
"sortDesc": true,
"total": false,
"values": true
},
"lines": true,
"linewidth": 1,
"links": [],
"minSpan": 6,
"nullPointMode": "connected",
"percentage": false,
"pointradius": 5,
"points": false,
"renderer": "flot",
"repeat": "cpu",
"seriesOverrides": [],
"spaceLength": 10,
"span": 6,
"stack": false,
"steppedLine": false,
"targets": [
{
"alias": "$tag_host: $cpu $col",
"dsType": "influxdb",
"function": "mean",
"groupBy": [
{
"interval": "auto",
"params": [
"auto"
],
"type": "time"
},
{
"key": "host",
"params": [
"tag"
],
"type": "tag"
}
],
"hide": false,
"measurement": "cpu_percentageBusy",
"policy": "default",
"query": "SELECT mean(usage_user) as \"user\", mean(usage_system) as \"system\", mean(usage_softirq) as \"softirq\", mean(usage_steal) as \"steal\", mean(usage_nice) as \"nice\", mean(usage_irq) as \"irq\", mean(usage_iowait) as \"iowait\", mean(usage_guest) as \"guest\", mean(usage_guest_nice) as \"guest_nice\" FROM \"cpu\" WHERE \"host\" =~ /$server$/ and cpu = '$cpu' AND $timeFilter GROUP BY time($interval), *",
"rawQuery": true,
"refId": "B",
"resultFormat": "time_series",
"select": [
[
{
"params": [
"value"
],
"type": "field"
},
{
"params": [],
"type": "mean"
}
]
],
"tags": []
}
],
"thresholds": [],
"timeFrom": null,
"timeShift": null,
"title": "CPU usage for $cpu",
"tooltip": {
"msResolution": false,
"shared": true,
"sort": 0,
"value_type": "cumulative"
},
"type": "graph",
"xaxis": {
"buckets": null,
"mode": "time",
"name": null,
"show": true,
"values": []
},
"yaxes": [
{
"format": "percent",
"logBase": 1,
"max": 100,
"min": 0,
"show": true
},
{
"format": "short",
"logBase": 1,
"max": null,
"min": null,
"show": true
}
]
}
],
"repeat": null,
"repeatIteration": null,
"repeatRowId": null,
"showTitle": true,
"title": "Per-cpu usage",
"titleSize": "h6"
},
{
"collapse": false,
"height": 250,
"panels": [
{
"aliasColors": {},
"bars": false,
"dashLength": 10,
"dashes": false,
"datasource": "${DS_TELEGRAF}",
"editable": true,