jsp中使用echarts簡單示例
阿新 • • 發佈:2019-01-06
使用echarts的簡單步驟:
1. 下載echarts,可到官網上下載echarts。
2. 新建一個web project工程。
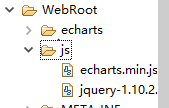
3. 在webRoot下新建一個js資料夾,放入echarts.min.js和jquery.js(具體情況具體操作)下圖中echarts資料夾放的是bar.jsp(柱狀圖顯示)
4.新建一個class,本例中新建的是一個Product.java
public class Product {
	private String name;
	private int num;

	public Product(String name, int num) {
		super();
		this.name = name;
		this.num = num;
	}
	public Product() {
		super();
	}
	public String getName() {
		return name;
	}
	public void setName(String name) {
		this.name = name;
	}
	public int getNum() {
		return num;
	}
	public void setNum(int num) {
		this.num = num;
	}
	@Override
	public String toString() {
		return "Product [name=" + name + ", num=" + num + "]";
	}

}
5.新建一個servlet,本例中新建的servlet命為ProductServlet
public void doPost(HttpServletRequest request, HttpServletResponse response)
			throws ServletException, IOException {
		response.setCharacterEncoding("utf-8");
		List<Product> list = new ArrayList<Product>();
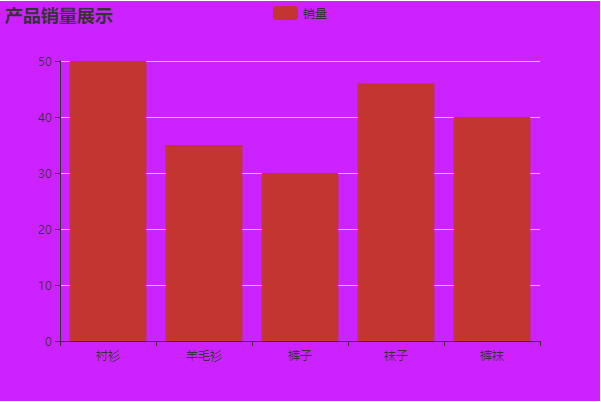
		list.add(new Product("襯衫",50));
		list.add(new Product("羊毛衫",35));
		list.add(new Product("褲子",30));
		list.add(new Product("襪子",46));
		list.add(new Product("褲襪",40));

		Gson json = new Gson();
		String result = json.toJson(list);
		System.out.println(result);
		response.getWriter().write(result);
	}
注意:此處進行了json的轉換,本例子中使用的是谷歌的json包,名為gson.jar
6.新建一個名為bar.jsp的頁面(本例中放在webRoot/echarts/bar.jsp)
<%@ page language="java" import="java.util.*" pageEncoding="UTF-8"%>
<%
String path = request.getContextPath();
String basePath = request.getScheme()+"://"+request.getServerName()+":"+request.getServerPort()+path+"/";
%>

<!DOCTYPE HTML PUBLIC "-//W3C//DTD HTML 4.01 Transitional//EN">
<html>
  <head>
    <base href="<%=basePath%>">

    <title>柱狀圖演示</title>

	<meta http-equiv="pragma" content="no-cache">
	<meta http-equiv="cache-control" content="no-cache">
	<meta http-equiv="expires" content="0">
	<meta http-equiv="keywords" content="keyword1,keyword2,keyword3">
	<meta http-equiv="description" content="This is my page">
	<!--
	<link rel="stylesheet" type="text/css" href="styles.css">
	-->
	<script type="text/javascript" src="js/echarts.min.js"></script>
	<script type="text/javascript" src="js/jquery-1.10.2.min.js"></script>
  </head>

  <body>
  		<a href="index.jsp">首頁</a><br>
  		<a href="echarts/line.jsp">折線圖演示</a><br>
  		<a href="echarts/pie.jsp">餅圖演示</a><br>
  		<div id = "main" style="width: 600px;height: 400px;"></div>
  		<script type="text/javascript">
  			var myecharts = echarts.init(document.getElementById('main'));
  			var option = {
  					backgroundColor:'#CC22FF',
  					title:{
  						text:'產品銷量展示'
  					},
  					tooltip:{},
  					legend:{
  						data:['銷量']
  					},
  					xAxis:{
  						data:[]
  					},
  					yAxis:{},
  					series:[{
  						name:'銷量',
  						type:'bar',
  						data:[]
  					}]
  			};
  			myecharts.setOption(option);
  			myecharts.showLoading();
  			var names = [];
  			var nums = [];
  			$.ajax({
  				url:'ProductServlet',
  				type:'post',
  				async:'true',
  				data:{},
  				dataType:'json',
  				success:function(data){
  					for(var i = 0 ; i < data.length ; i++){
  						names.push(data[i].name);
  						nums.push(data[i].num);
  					}
  					myecharts.hideLoading();
  					myecharts.setOption({
  						xAxis:{
  	  						data:names
  	  					},
  	  				series:[{
  						name:'銷量',
  						data:nums
  					}]
  					});
  				},
  				error:function(){
  					alert("圖表資料載入失敗");
  					myecharts.hideLoading();
  				}
  			});
  		</script>
  </body>
</html>
7.測試,結果


