一步一步教你寫股票走勢圖——分時圖五(自定義標記)
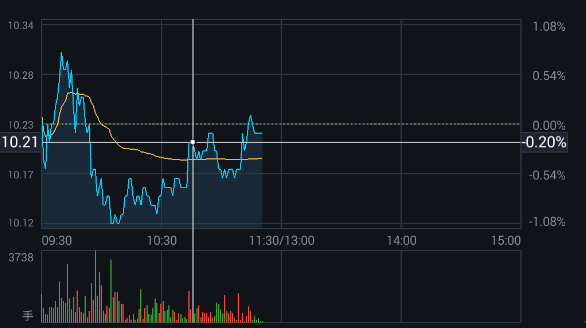
分時圖開發到現在,基本已經完成了,這部分開發完,就會開始著手k線圖部分的開發。於是我們做了最後的對比,看下還有什麼地方需要增加修改,最後發現,還有標記檢視沒有,先看下什麼是標記檢視(博主不知道這個名字叫啥,自己起的):
我們可以看到高亮線的左右兩邊分別標記了y軸的左右兩邊的資料, 而且左右滑動的時候,他們位置會隨著交界點的變化而變。
本節將會介紹下如何去自定義左右兩個標記,相信小夥伴們理解之後,中間的白點也是可以自己任意新增的,不妨在本篇結束後,自己動手試一試!
好了,我們開始本章節的內容吧!
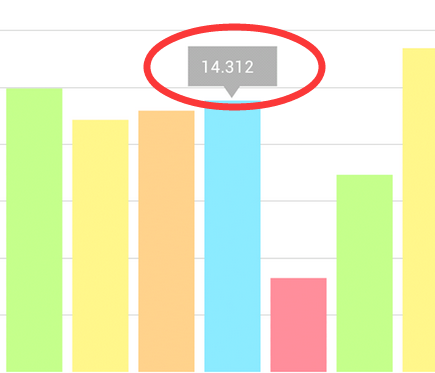
相信有的小夥伴們在剛使用MP這個庫的時候,一定見過如下的東東:
沒錯,這就是標記檢視,選中某條資料的情況下,出現的檢視,我們就仿照它就沒錯。
看原始碼
MarkerView
public abstract class MarkerView extends RelativeLayout {
/**
* Constructor. Sets up the MarkerView with a custom layout resource.
*
* @param context
* @param layoutResource the layout resource to use for the MarkerView
*/
public MarkerView(Context context, int 建構函式中要傳入顯示的佈局檔案,draw會根據傳入的position定位,refreshContent更新裡面的文字。原始碼讀起來很簡單,只有幾個方法而已,我們在例項的時候只需傳入我們的佈局即可,於是我們模仿了一個寫法:
public class MyMarkerView extends MarkerView {
    private TextView markerTv;
    public MyMarkerView(Context context, int layoutResource) {
        super(context, layoutResource);
        markerTv = (TextView) findViewById(R.id.marker_tv);
    }

    @Override
    public void refreshContent(Entry e, Highlight highlight) {
   }

    @Override
    public int getXOffset(float xpos) {
        return 0;
    }

    @Override
    public int getYOffset(float ypos) {
        return 0;
    }
}


……

 private void setMarkerView(){
        MyMarkerView myMarkerView = new MyMarkerView(MinutesActivity.this, R.layout.mymarkerview);
        lineChart.setMarkerView(myMarkerView);
    }
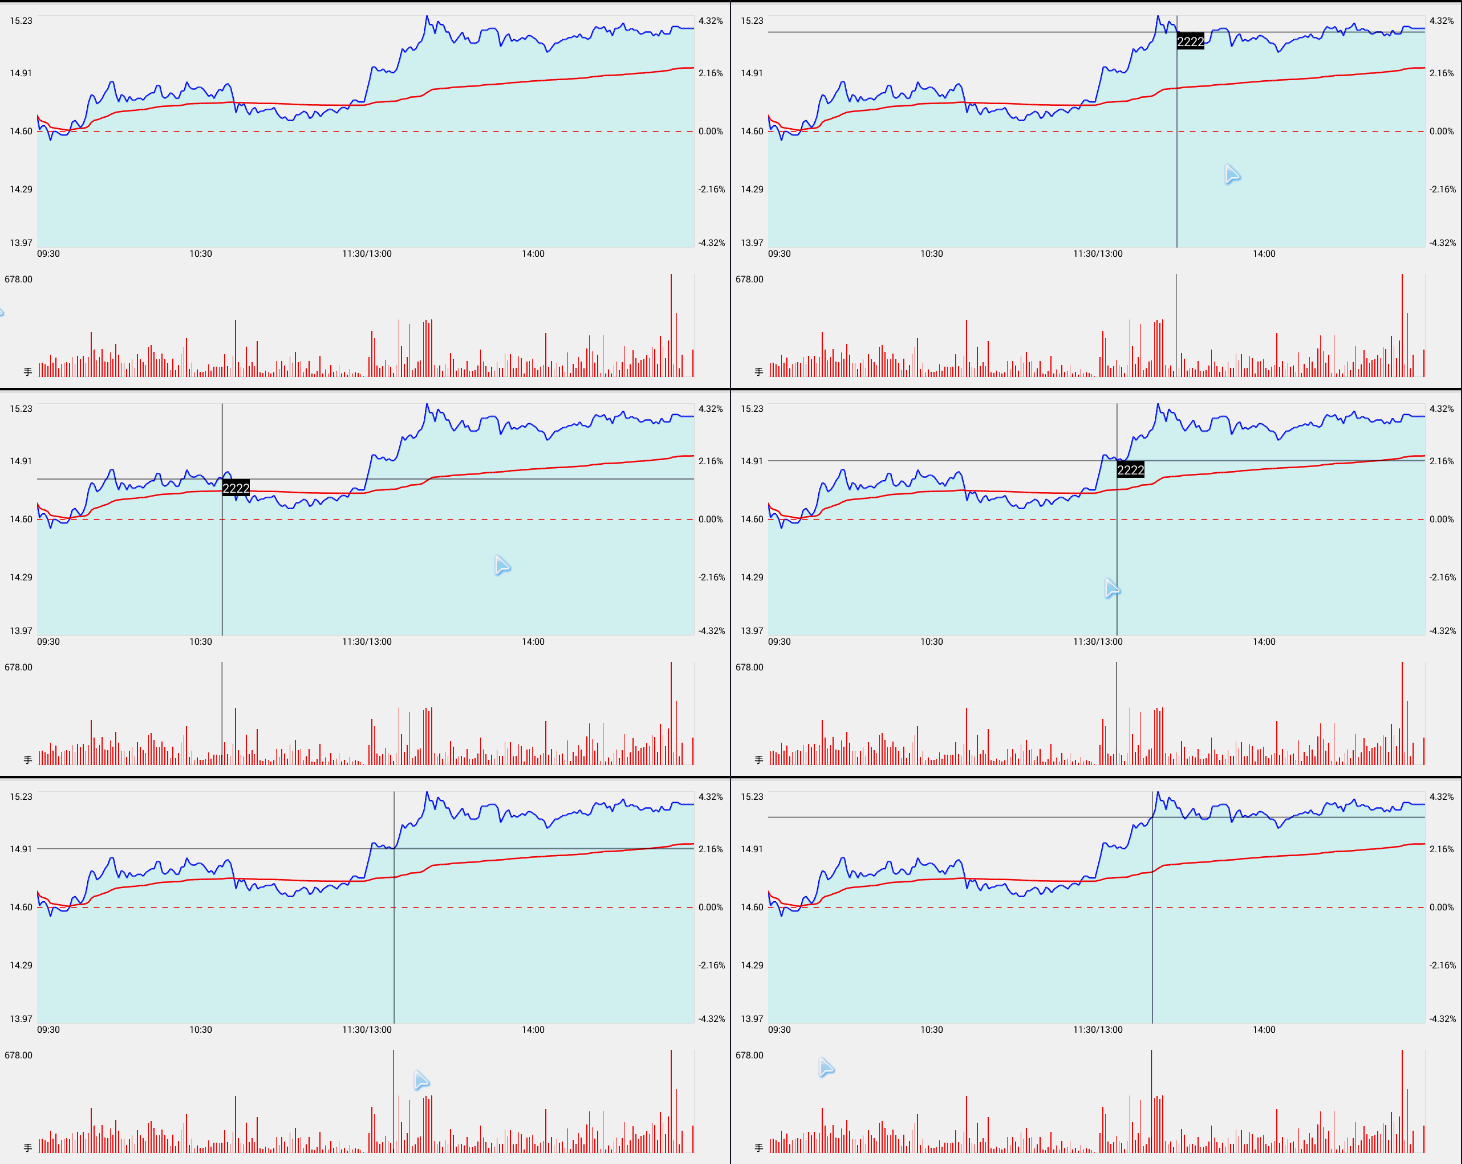
最後圖表進行設定markerview,我們看下效果圖:
問題:
- 位置不對,預設只有一個,要顯示兩個標記
觸控柱狀圖時,上面不顯示標記
MrrkerView自身偏離Offset完成不了這樣的需求,那麼我們只能從表的重寫入手了。
在MyLineChart中重寫drawMarkerw方法
public void setHighlightValue(Entry e, Highlight h) {
        this.e = e;
        if (mData == null)
            mIndicesToHighlight = null;
        else {
            mIndicesToHighlight = new Highlight[]{
                    h};
        }
        invalidate();
    }
  @Override
    protected void drawMarkers(Canvas canvas) {
          if (!mDrawMarkerViews || !valuesToHighlight())
            return;
        for (int i = 0; i < mIndicesToHighlight.length; i++) {
            Highlight highlight = mIndicesToHighlight[i];
            int xIndex = mIndicesToHighlight[i].getXIndex();
            int dataSetIndex = mIndicesToHighlight[i].getDataSetIndex();
            float deltaX = mXAxis != null
                    ? mXAxis.mAxisRange
                    : ((mData == null ? 0.f : mData.getXValCount()) - 1.f);
            if (xIndex <= deltaX && xIndex <= deltaX * mAnimator.getPhaseX()) {
                Entry e = mData.getEntryForHighlight(mIndicesToHighlight[i]);
                // make sure entry not null
                if (e == null || e.getXIndex() != mIndicesToHighlight[i].getXIndex())
                    continue;
                float[] pos = getMarkerPosition(e, highlight);
                // check bounds
                if (!mViewPortHandler.isInBounds(pos[0], pos[1]))
                    continue;

                float yValForXIndex1 = minuteHelper.getDatas().get(mIndicesToHighlight[i].getXIndex()).cjprice;
                float yValForXIndex2 = minuteHelper.getDatas().get(mIndicesToHighlight[i].getXIndex()).per;

                myMarkerViewLeft.setData(yValForXIndex1);
                myMarkerViewRight.setData(yValForXIndex2);
                myMarkerViewLeft.refreshContent(e, mIndicesToHighlight[i]);
                myMarkerViewRight.refreshContent(e, mIndicesToHighlight[i]);
                /*修復bug*/
                // invalidate();
                /*重新計算大小*/
                myMarkerViewLeft.measure(MeasureSpec.makeMeasureSpec(0, MeasureSpec.UNSPECIFIED),
                        MeasureSpec.makeMeasureSpec(0, MeasureSpec.UNSPECIFIED));
                myMarkerViewLeft.layout(0, 0, myMarkerViewLeft.getMeasuredWidth(),
                        myMarkerViewLeft.getMeasuredHeight());
                myMarkerViewRight.measure(MeasureSpec.makeMeasureSpec(0, MeasureSpec.UNSPECIFIED),
                        MeasureSpec.makeMeasureSpec(0, MeasureSpec.UNSPECIFIED));
                myMarkerViewRight.layout(0, 0, myMarkerViewRight.getMeasuredWidth(),
                        myMarkerViewRight.getMeasuredHeight());

                myMarkerViewLeft.draw(canvas, mViewPortHandler.contentLeft() - myMarkerViewLeft.getWidth(), pos[1] - myMarkerViewLeft.getHeight() / 2);
                myMarkerViewRight.draw(canvas, mViewPortHandler.contentRight(), pos[1] - myMarkerViewRight.getHeight() / 2);
            }
        }

    }
然後在activity中
 private void setMarkerView(MinuteHelper mData){
        MyLeftMarkerView leftMarkerView = new MyLeftMarkerView(MinutesActivity.this, R.layout.mymarkerview);
        MyRightMarkerView rightMarkerView = new MyRightMarkerView(MinutesActivity.this, R.layout.mymarkerview);
        lineChart.setMarker(leftMarkerView, rightMarkerView, mData);
    }
同時圖表的選中也得進行修改傳入引數
  lineChart.setOnChartValueSelectedListener(new OnChartValueSelectedListener() {
            @Override
            public void onValueSelected(Entry e, int dataSetIndex, Highlight h) {
                barChart.highlightValues(new Highlight[]{h});
                lineChart.setHighlightValue(e,h);
            }
            @Override
            public void onNothingSelected() {

            }
        });
        barChart.setOnChartValueSelectedListener(new OnChartValueSelectedListener() {
            @Override
            public void onValueSelected(Entry e, int dataSetIndex, Highlight h) {
              //  barChart.highlightValues(new Highlight[]{h});
                lineChart.setHighlightValue(e, new Highlight(h.getXIndex(),0));//此函式已經返回highlightBValues的變數,並且重新整理,故上面方法可以註釋
               // barChart.setHighlightValue(h);
            }

            @Override
            public void onNothingSelected() {

            }
        });
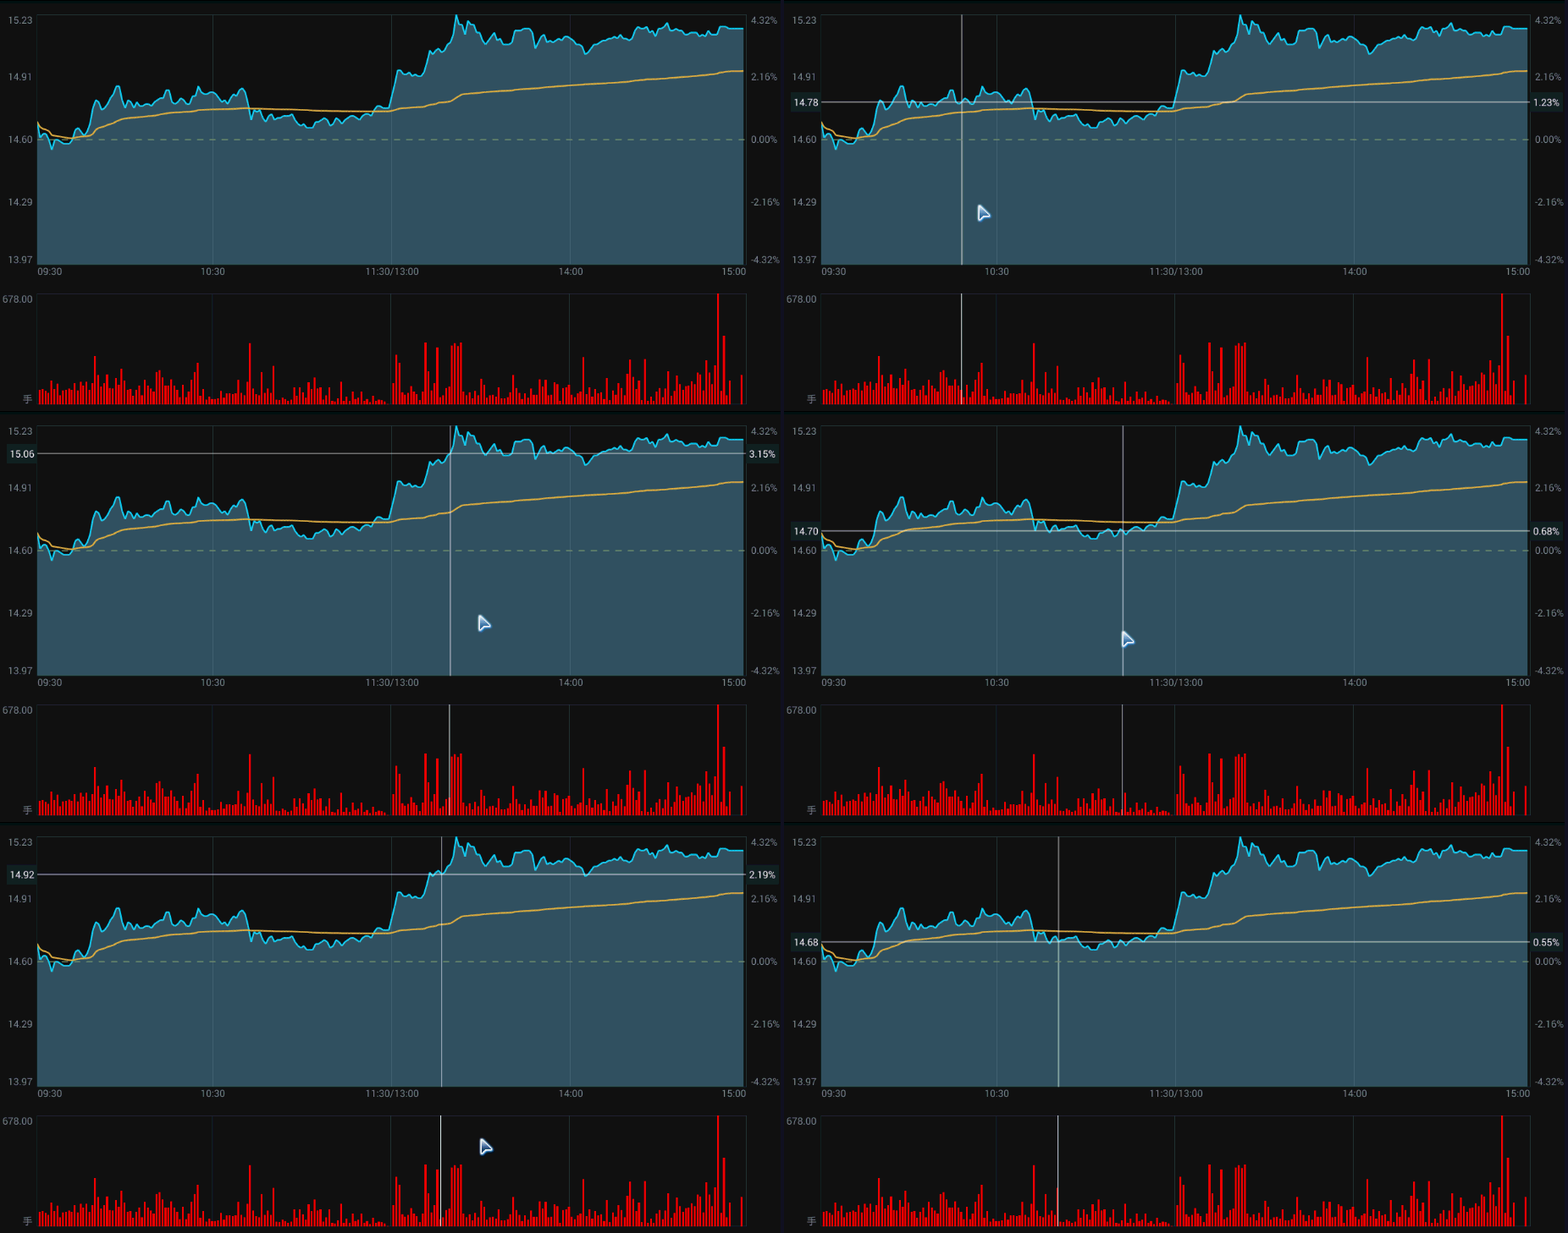
看得比較亂的同學,可以直接檢視demo程式碼,這裡只是簡單的放出程式碼而已,邏輯上估計還有點亂。博主不得不承認,在處理自定義標記的部分程式碼寫的有點渣,中間碰到很多坑,最後也是碰巧實現了效果,博主很納悶,為啥要從activity中傳入Entry的引數才行,而在MyLineChart中直接引用系統的Entry和mData卻行不通,希望哪位大神研究後能給出答案,或者在處理自定義標記這邊有更好見解的歡迎留言或者聯絡我。下面我們看下效果圖吧(考慮到是仿照自選股app,所以顏色上也基本參考了它):
(注:以上bug,6.17日已修復,上面程式碼已替換最新)
總結:分時圖寫到這裡基本告一段落了,大概的功能也都能實現了,如果有什麼問題,請留言,博主一定盡力解決,同時發現demo有bug啥的或者更好的處理方式,也歡迎聯絡我。端午後將會更新大家期待已久的K線圖,歡迎大家star我的專案https://github.com/AndroidJiang/StockChart,最後祝大家端午快樂!。


