資料視覺化-中國地圖的製作(地圖的省級聯動)
阿新 • • 發佈:2019-01-10
在資料視覺化中,地圖是很重要的一部分。很多情況會與地圖有關聯,如中國各省的人口多少,GDP多少等,都可以和地圖聯絡在一起。
一.地圖資料的獲取
2.聯絡博主,會給您共享一份地圖的JSON資料。
二.地圖的製作
第一步:定義畫板,並將畫板新增到body中
var width  = 1000;
var height = 1000;
var svg = d3.select("body")
	    .append("svg")
	    .attr("width", width)
            .attr("height", height)
	    .attr("transform", "translate(0,0)");
第二步:定義一個投影函式來轉換經緯度。因為,地球上的經度和緯度的資訊,都是三維的,而要在網頁上顯示的是二維的,所以要設定一個投影函式來轉換經緯度,本文使用d3.geo.mercator()的投影方式。各種投影函式,可以參考: https://github.com/mbostock/d3/wiki/Geo-Projections
var projection = d3.geo.mercator()
		       .center([107, 31])
		       .scale(550)
    		       .translate([width/2, height/2]);
第 2 行:center() 設定地圖的中心位置,[107,31] 指的是經度和緯度。
第 3 行:scale() 設定放大的比例。數值越大,地圖被放大的比例越大。將數值寫在括號中即可。
第 4 行:translate(x,y) 設定平移。第一個引數x為沿x軸移動的距離,第二個引數y為沿y軸移動的距離。
第三步:使用第二步定義出來的投影函式生成路徑。projection() 是設定生成器的投影函式,把上面定義的投影傳入即可。以後,當使用此生成器計算路徑時,會自己加入投影的影響。
var path = d3.geo.path()
		 .projection(projection);
第四步:向伺服器請求檔案並繪製地圖
d3.json("china.geojson", function(error, root) {
		if (error)  return console.error(error);
                svg.selectAll("path")
			.data(root.china.features)
			.enter()
			.append("path")
			.attr("stroke","#000")
			.attr("stroke-width",1)
			.attr("fill", function(d,i){
				return color;
			})
			.attr("fill", "rgba(6,85,178,0.5)")
			.attr("d", path)
			.on("mouseover",function(d,i){
                                d3.select(this)
                                  .attr("fill","yellow");
                        })
                        .on("mouseout",function(d,i){
                               d3.select(this)
                                 .attr("fill","rgba(6,85,178,0.5)");
                        })
                })
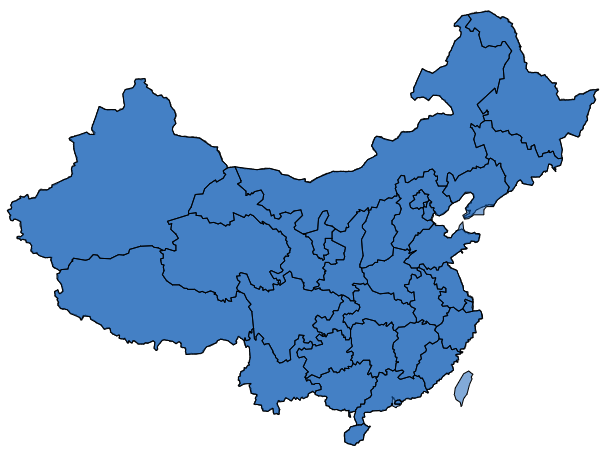
結果如圖:
再次宣告:d3.json() 不能直接讀取本地檔案,因此你需要搭建一個伺服器,例如 Apache。
三.給地圖上新增省份的名稱
  svg.selectAll("text")
            .data(root.china.features)
            .enter().append("svg:text")
            .text(function (d, i) {
                return d.properties.name
            })           .attr("fill", "rgba(6,85,178,0.5)")

            .attr("x", function (d) {
                var local = projection([d.properties.cp[0], d.properties.cp[1]])
                return local[0]
            })
            .attr("y", function (d) {
                var local = projection([d.properties.cp[0], d.properties.cp[1]])
                return local[1]
            })
            .attr("fill", "#04adff")
            .style("font-size", "10px")
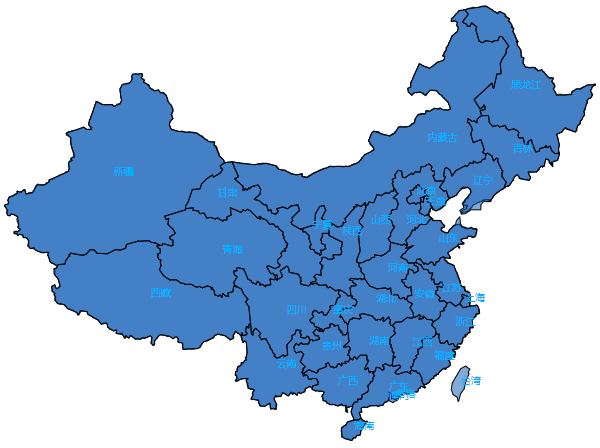
注:地圖的JSON資料中需要有省份的中心點座標。結果如下:
四.實現地圖的省級聯動(即點選某省時出現某個省份的地圖)
第一步:給每個省份的路徑新增一個屬性,屬性值為對應的省份名。以便點選時,進行判斷,是哪個省份被點選,以及需要調取哪個省份的地圖資料。
svg.selectAll("path")
        .attr("tag", function(d){
             return d.properties["name"];
    	})
第二步:新增點選事件
svg.selectAll("path")
   .on("click",function(e){
       if(this.getAttribute('tag')=="黑龍江"){
           d3.json("china.geojson", function(error, root) { //請求黑龍江地區的資料
	       if (error) return console.error(error);
	       svg.selectAll("*").remove(); //清空畫板
	           svg.selectAll("path")
		      .data(root.黑龍江.features)
		      .enter()
		      .append("path")
		      .attr("stroke","#000")
		      .attr("stroke-width",1)
		      .attr("fill", "rgba(6,85,178,0.5)")
		      .attr("d", path)
		      .on("mouseover",function(d,i){
		            d3.select(this)
			      .attr("fill","yellow");
		      })
	              .on("mouseout",function(d,i){
			   d3.select(this)
		             .attr("fill","rgba(6,85,178,0.5)");
		      })

	   })
       }   })
五.實現地圖上不同區域有不同的著色(如圖)

會用到d3中的過濾器,判斷資料當中各省份的經緯度,根據經緯度的範圍進行著色,具體程式碼如下:
d3.selectAll("path").filter(function(d,i){
    if(d.properties.id>=31&&d.properties.id<=35&&d.properties.id!=34){
        d3.select(this).attr("fill", function(d,i){
	    return "#03aefe";
	})
    }
})

