機器學習實戰-使用Matplotlib建立散點圖
這是程式2-2執行結果,d將三類資料一一列出,l則為每個人所屬型別>>> d,l = d,l = k.file2matrix('F:\\機器學習\\MLiA_SourceCode\\machinelearninginaction\\Ch02\\datingTestSet2.txt') >>> d array([[4.0920000e+04, 8.3269760e+00, 9.5395200e-01], [1.4488000e+04, 7.1534690e+00, 1.6739040e+00], [2.6052000e+04, 1.4418710e+00, 8.0512400e-01], ..., [2.6575000e+04, 1.0650102e+01, 8.6662700e-01], [4.8111000e+04, 9.1345280e+00, 7.2804500e-01], [4.3757000e+04, 7.8826010e+00, 1.3324460e+00]]) >>> l [3, 2, 1, 1, 1, 1, 3, 3, 1, 3, 1, 1, 2, 1, 1, 1, 1, 1, 2, 3, 2, 1, 2, 3, 2, 3, 2, 3, 2, 1, 3, 1, 3, 1, 2, 1, 1, 2, 3, 3, 1, 2, 3, 3, 3, 1, 1, 1, 1, 2, 2, 1, 3, 2, 2, 2, 2, 3, 1, 2, 1, 2, 2, 2, 2, 2, 3, 2, 3, 1, 2, 3, 2, 2, 1, 3, 1, 1, 3, 3, 1, 2, 3, 1, 3, 1, 2, 2, 1, 1, 3, 3, 1, 2, 1, 3, 3, 2, 1, 1, 3, 1, 2, 3, 3, 2, 3, 3, 1, 2, 3, 2, 1, 3, 1, 2, 1, 1, 2, 3, 2, 3, 2, 3, 2, 1, 3, 3, 3, 1, 3, 2, 2, 3, 1, 3, 3, 3, 1, 3, 1, 1, 3, 3, 2, 3, 3, 1, 2, 3, 2, 2, 3, 3, 3, 1, 2, 2, 1, 1, 3, 2, 3, 3, 1, 2, 1, 3, 1, 2, 3, 2, 3, 1, 1, 1, 3, 2, 3, 1, 3, 2, 1, 3, 2, 2, 3, 2, 3, 2, 1, 1, 3, 1, 3, 2, 2, 2, 3, 2, 2, 1, 2, 2, 3, 1, 3, 3, 2, 1, 1, 1, 2, 1, 3, 3, 3, 3, 2, 1, 1, 1, 2, 3, 2, 1, 3, 1, 3, 2, 2, 3, 1, 3, 1, 1, 2, 1, 2, 2, 1, 3, 1, 3, 2, 3, 1, 2, 3, 1, 1, 1, 1, 2, 3, 2, 2, 3, 1, 2, 1, 1, 1, 3, 3, 2, 1, 1, 1, 2, 2, 3, 1, 1, 1, 2, 1, 1, 2, 1, 1, 1, 2, 2, 3, 2, 3, 3, 3, 3, 1, 2, 3, 1, 1, 1, 3, 1, 3, 2, 2, 1, 3, 1, 3, 2, 2, 1, 2, 2, 3, 1, 3, 2, 1, 1, 3, 3, 2, 3, 3, 2, 3, 1, 3, 1, 3, 3, 1, 3, 2, 1, 3, 1, 3, 2, 1, 2, 2, 1, 3, 1, 1, 3, 3, 2, 2, 3, 1, 2, 3, 3, 2, 2, 1, 1, 1, 1, 3, 2, 1, 1, 3, 2, 1, 1, 3, 3, 3, 2, 3, 2, 1, 1, 1, 1, 1, 3, 2, 2, 1, 2, 1, 3, 2, 1, 3, 2, 1, 3, 1, 1, 3, 3, 3, 3, 2, 1, 1, 2, 1, 3, 3, 2, 1, 2, 3, 2, 1, 2, 2, 2, 1, 1, 3, 1, 1, 2, 3, 1, 1, 2, 3, 1, 3, 1, 1, 2, 2, 1, 2, 2, 2, 3, 1, 1, 1, 3, 1, 3, 1, 3, 3, 1, 1, 1, 3, 2, 3, 3, 2, 2, 1, 1, 1, 2, 1, 2, 2, 3, 3, 3, 1, 1, 3, 3, 2, 3, 3, 2, 3, 3, 3, 2, 3, 3, 1, 2, 3, 2, 1, 1, 1, 1, 3, 3, 3, 3, 2, 1, 1, 1, 1, 3, 1, 1, 2, 1, 1, 2, 3, 2, 1, 2, 2, 2, 3, 2, 1, 3, 2, 3, 2, 3, 2, 1, 1, 2, 3, 1, 3, 3, 3, 1, 2, 1, 2, 2, 1, 2, 2, 2, 2, 2, 3, 2, 1, 3, 3, 2, 2, 2, 3, 1, 2, 1, 1, 3, 2, 3, 2, 3, 2, 3, 3, 2, 2, 1, 3, 1, 2, 1, 3, 1, 1, 1, 3, 1, 1, 3, 3, 2, 2, 1, 3, 1, 1, 3, 2, 3, 1, 1, 3, 1, 3, 3, 1, 2, 3, 1, 3, 1, 1, 2, 1, 3, 1, 1, 1, 1, 2, 1, 3, 1, 2, 1, 3, 1, 3, 1, 1, 2, 2, 2, 3, 2, 2, 1, 2, 3, 3, 2, 3, 3, 3, 2, 3, 3, 1, 3, 2, 3, 2, 1, 2, 1, 1, 1, 2, 3, 2, 2, 1, 2, 2, 1, 3, 1, 3, 3, 3, 2, 2, 3, 3, 1, 2, 2, 2, 3, 1, 2, 1, 3, 1, 2, 3, 1, 1, 1, 2, 2, 3, 1, 3, 1, 1, 3, 1, 2, 3, 1, 2, 3, 1, 2, 3, 2, 2, 2, 3, 1, 3, 1, 2, 3, 2, 2, 3, 1, 2, 3, 2, 3, 1, 2, 2, 3, 1, 1, 1, 2, 2, 1, 1, 2, 1, 2, 1, 2, 3, 2, 1, 3, 3, 3, 1, 1, 3, 1, 2, 3, 3, 2, 2, 2, 1, 2, 3, 2, 2, 3, 2, 2, 2, 3, 3, 2, 1, 3, 2, 1, 3, 3, 1, 2, 3, 2, 1, 3, 3, 3, 1, 2, 2, 2, 3, 2, 3, 3, 1, 2, 1, 1, 2, 1, 3, 1, 2, 2, 1, 3, 2, 1, 3, 3, 2, 2, 2, 1, 2, 2, 1, 3, 1, 3, 1, 3, 3, 1, 1, 2, 3, 2, 2, 3, 1, 1, 1, 1, 3, 2, 2, 1, 3, 1, 2, 3, 1, 3, 1, 3, 1, 1, 3, 2, 3, 1, 1, 3, 3, 3, 3, 1, 3, 2, 2, 1, 1, 3, 3, 2, 2, 2, 1, 2, 1, 2, 1, 3, 2, 1, 2, 2, 3, 1, 2, 2, 2, 3, 2, 1, 2, 1, 2, 3, 3, 2, 3, 1, 1, 3, 3, 1, 2, 2, 2, 2, 2, 2, 1, 3, 3, 3, 3, 3, 1, 1, 3, 2, 1, 2, 1, 2, 2, 3, 2, 2, 2, 3, 1, 2, 1, 2, 2, 1, 1, 2, 3, 3, 1, 1, 1, 1, 3, 3, 3, 3, 3, 3, 1, 3, 3, 2, 3, 2, 3, 3, 2, 2, 1, 1, 1, 3, 3, 1, 1, 1, 3, 3, 2, 1, 2, 1, 1, 2, 2, 1, 1, 1, 3, 1, 1, 2, 3, 2, 2, 1, 3, 1, 2, 3, 1, 2, 2, 2, 2, 3, 2, 3, 3, 1, 2, 1, 2, 3, 1, 3, 2, 2, 2, 2, 2, 2, 2, 2, 2, 2, 2, 2, 3, 2, 2, 2, 2, 2, 1, 3, 3, 3]
>>> import matplotlib
>>> import matplotlib.pyplot as plt
>>> fig = plt.figure()
>>> ax = fig.add_subplot(111)
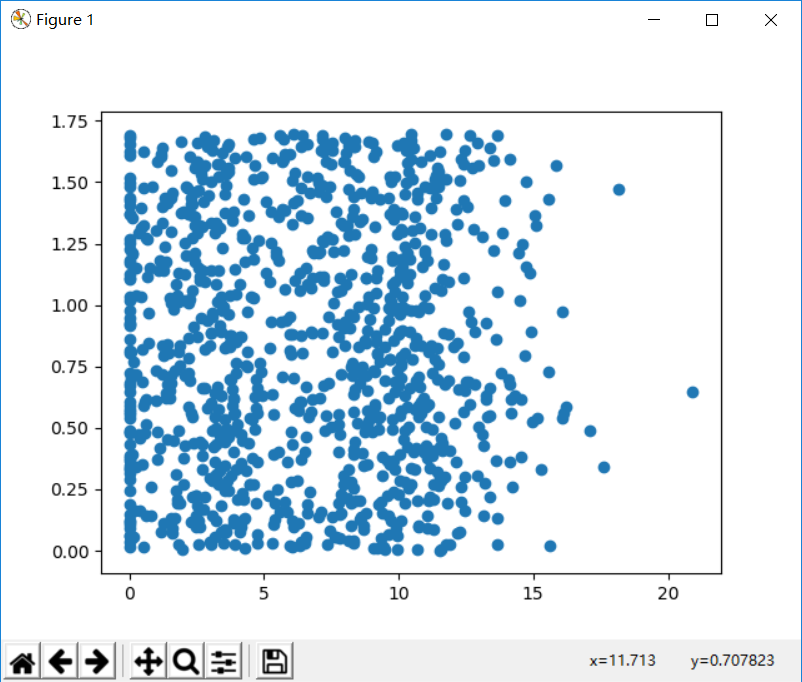
>>> ax.scatter(d[:,1],d[:,2])
<matplotlib.collections.PathCollection object at 0x000002042B3A2C50>
>>> plt.show()
看一下執行結果
執行成功,下來解釋一下程式碼。
Matplotlib 是一個 Python 的 2D繪相簿,它以各種硬拷貝格式和跨平臺的互動式環境生成出版質量級別的圖形,pyplot是Matplotlib 軟體包中子包,提供了一個類似MATLAB的繪圖框架。這是官方文件https://matplotlib.org/users/pyplot_tutorial.html。
fig = plt.figure()生成一個figure物件,是一個影象視窗
>>> fig = plt.figure()
>>> plt.show(fig)
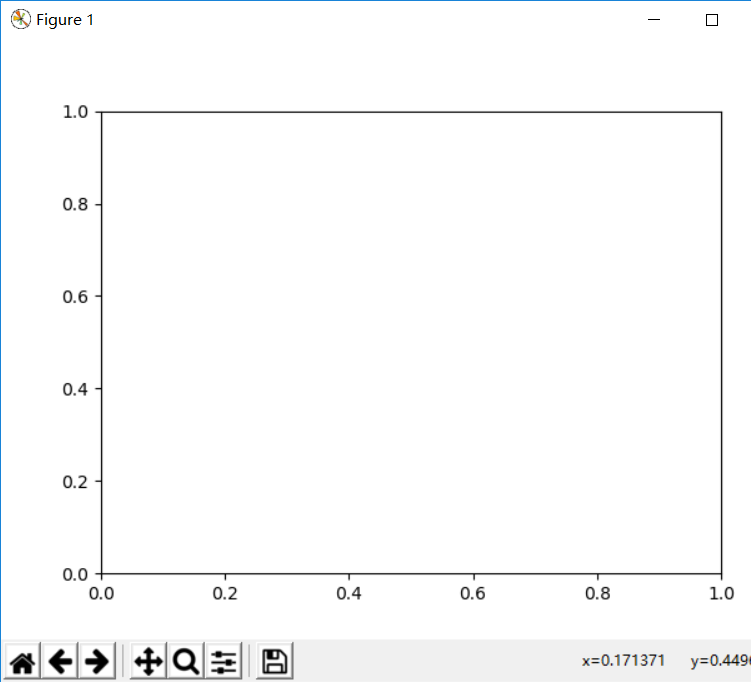
現在figure是空的,ax = fig.add_subplot(111)會在figure上建立一個子圖
引數111代表生成一行一列,一個圖。
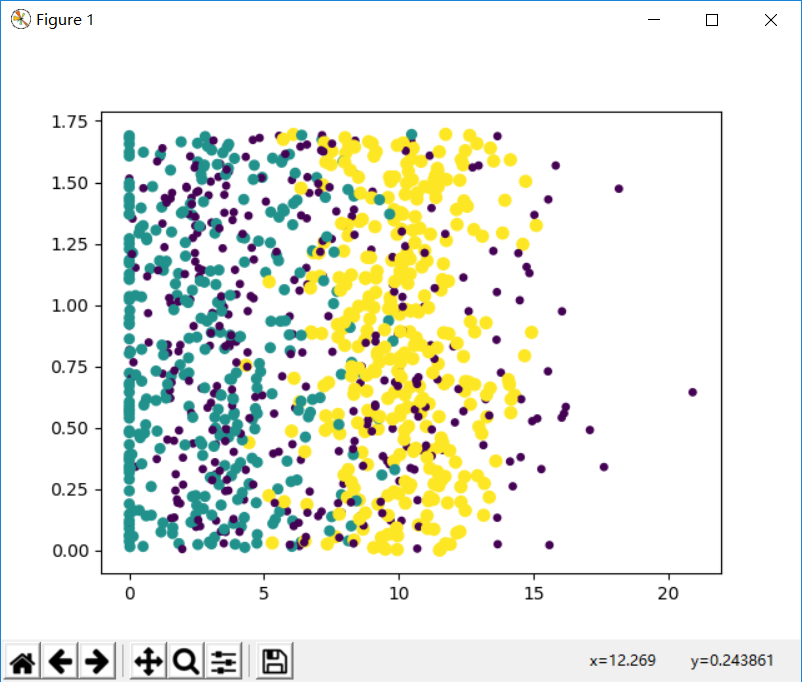
scatter函式生成散點圖,其中使用了d矩陣的第二第三列資料。顯然表中散點比較繁亂,不易看清,書中給出的程式碼ax.scatter(d[:,1],d[:,2],15.0*np.array(l),15.0*np.array(l))生成了下圖,每個型別的點大小顏色都不同
這裡用到了scatter函式陣列引數的用法,通過下面的測試來看看scatter的工作原理
>>> fig = plt.figure()

>>> ax = fig.add_subplot(111)

>>> ax.scatter(d[:,1],d[:,2],15.0*np.array(l),15.0*np.array(l))

<matplotlib.collections.PathCollection object at 0x00000263E13FEC50>
>>> plt.show()

>>> fig = plt.figure()#建立figure物件

>>> ax1 = fig.add_subplot(311)

>>> ax2 = fig.add_subplot(312)

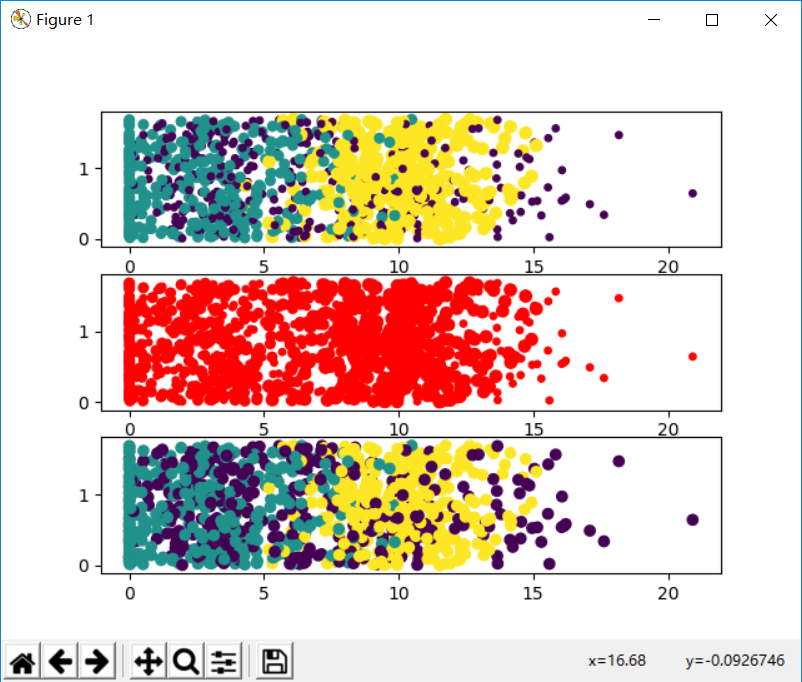
>>> ax3 = fig.add_subplot(313)#生成了三個子圖

>>> ax1.scatter(d[:,1],d[:,2],15.0*np.array(l),15.0*np.array(l))#保留原程式的設定

<matplotlib.collections.PathCollection object at 0x00000263E0FC6390>
>>> ax2.scatter(d[:,1],d[:,2],15.0*np.array(l),c='r')#改變第二個陣列

<matplotlib.collections.PathCollection object at 0x00000263E0FC6080>
>>> ax3.scatter(d[:,1],d[:,2],c = 15.0*np.array(l))#去掉第一個陣列

<matplotlib.collections.PathCollection object at 0x00000263E0E2AF28>
>>> plt.show()
這裡我建立了三個子圖,ax1保留書中引數設定,在ax2中將後一陣列改為c = 'r',因為我認為後一個數組應該是控制顏色的,姑且這麼一試(什麼,你說我根本就是早就知道?),在ax3中去掉第一個陣列,看看結果如何
果然,第二個圖中點的大小是有不同的,而顏色只有指定的紅色,第三副中點的大小沒有變化,而顏色有變化,所以一目瞭然,第一個陣列制定點的大小(看了scatter函式的幫助後瞭解到這裡我們的陣列必須與第一個引數的包含元素數相等,第二個陣列亦是),第二個陣列決定點的顏色。到這裡,程式就一目瞭然了。
matplotlib功能還是很強大的,還有很多功能修飾圖表,感興趣的話可以去看官網的文件。

