
vue中使用v-charts圖表
最近沒事研究了一下v-charts,不逼逼了,直接上圖,上程式碼,乾貨才是硬道理,程式碼複製即用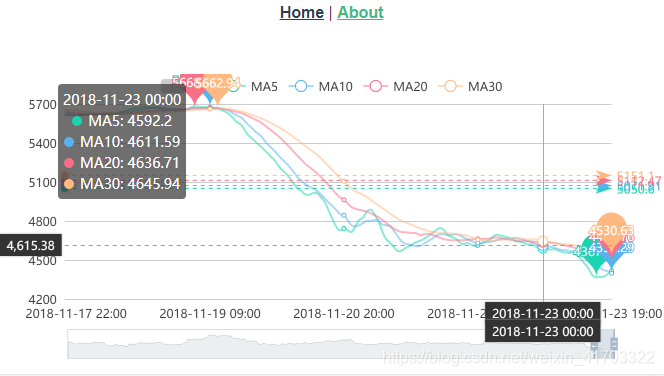
<template>
  <div class="about">
    <div class="box">
      <div class="box1" ref='res1'>
           <ve-candle :data="chartData" :settings="chartSettings" :tooltip-visible='true'
                width='100%' height='300px'
            :mark-line="markLine" :mark-point="markPoint"
           ></ve-candle>


      </div>
    </div>

  </div>
</template>
<script>
import {formatDate} from '../components/common/js/data'
import 'echarts/lib/component/markLine'
import 'echarts/lib/component/markPoint'
import 'echarts/lib/component/dataZoom'
import 'echarts/lib/component/toolbox'
import 'v-charts/lib/style.css'
export default {
  name:'aboue',

    data () {
      this.markLine = {
        data:[
          {
            name:'平均線',
            type:'average'
          }
        ]
      },
      this.markPoint = {
        data:[
          {
            name:'最大值',
            type:'max'
          },
          {
            name:'最小值',
            type:'min'
          }
        ]
      },

    this.chartSettings = {
      showMA: true,
      // showVol: true,
      showDataZoom:true,
      star:20,
      end:100,
      day:[1,2,3,4]
    }
    return {
      chartData: {
        columns: ['日期', 'open', 'close', 'lowest', 'highest', 'vol'],
        rows: [
            //  [ '2004-01-05 8:00', 10411.85, 10544.07, 10411.85,  10575.92, 221290000 ]
        ]
      },
      times:[],
    }
  },
 filters:{

 },
  created(){

  },
  mounted () {

    // console.log(formatDate,'332323')
    let form = {
      marketId:14,
      period:'1h',
      limit:10000
    }
    this.$axios.get('/trade/data/getKLineData.o?'+ this.$qs.stringify(form) )
        .then(res=>{
          // console.log(res,'res')
          let result = res.data.datas;

          let time = result.data;//時間

          let sets = []
          // console.log(time,'timer')
          time.forEach((index,data)=>{

            this.chartData.rows.push([...index])

          })


          this.chartData.rows.forEach((data,index)=>{

            var time1 = data[0];

            time = this.formatDate(time1)

            data[0] = time
          })
        })

         console.log(this.chartData.rows,"rows")
  },
  watch:{
    activName(v){
      console.log(v)
      this.$nextTrick(()=>{
        this.$refs('res1').echarts.resize()
      })
    }
  },
  methods:{
    formatDate(time){
     var date = new Date(time);
     return formatDate(date,'yyyy-MM-dd hh:mm')
   },

  }
  }

</script>
<style>

  .box{
    width: 100%;
    height: auto;
    /* background: red; */
  }
  .box1{
    width: 100%;
    text-align: center;
    line-height: 100px;
     height: auto;
     font-size: 8px;
  }
  *{
    margin: 0;
    padding:0
  }
  .about{
    position: absolute;
    top: 100px;
    left: 0;
    width: 100%;
  }
</style>
相關推薦
vue中使用v-charts圖表
最近沒事研究了一下v-charts,不逼逼了,直接上圖,上程式碼,乾貨才是硬道理,程式碼複製即用 <template> <div class="about"> <div class="box"> <div c
vue-cli+v-charts實現移動端視覺化圖表
v-charts是餓了麼團隊開源的一款基於Vue和Echarts的圖表工具,在使用 echarts 生成圖表時,經常需要做繁瑣的資料型別轉化、修改複雜的配置項,v-charts 的出現正是為了解決這個痛點。基於 Vue2.0 和 echarts 封裝的 v-charts 圖表元件,只需要統一提供一種對前後
vue中v-for索引不要用key
spa 定義 pan class col color key 特性 不出 今天發現在給元素v-for渲染的時候,想給元素添加key特性存儲索引,發現不奏效: <div class="apic" v-for="(pic,index) in msg.pics" ..
vue中v-show與v-if的區別
marked 排版 事件監聽器 復用 中一 改變 緩存 模板 進行 之前在做項目的過程中,因為有用到element-ui組件用到了v-if進行排版渲染,可能是因為v-if,會把編譯緩存起來,所以切換的過程中一直會有復用的形式,導致樣式怎麽也不對,之後換成v-show就好了。
vue 中 v-model 和 .sync修飾符
port con ava use input del lac username strong v-model 1 <input v-model="searchText"> 2 3 等價於 4 <input 5 v-bind:valu
vue中v-model的多種使用場景
案例一:HTML元素的v-model -輸入框(text) <!DOCTYPE html> <html lang="en"> <head> <meta charset="UTF-8"> <ti
Vue中v-for應用
1.v-for遍歷陣列 【v-for遍歷陣列語法】 v-for="item in items" tems:要遍歷的陣列,需要在vue的data中定義好; item:迭代得到的陣列元素的別名。 【程式碼例子】 <div id="a
vue中v-model的資料雙向繫結(重要)
<!DOCTYPE html> <html lang="en"> <head> <meta charset="UTF-8"> <title>Title</title> </head> <body&
vue中v-html渲染的後臺返回程式碼新增樣式
vue中v-html渲染的標籤不能直接寫css樣式,因為v-html 的內容設定帶作用域的 CSS,所以不能直接寫 <style lang="scss" scoped> //如果把scoped去掉,直接寫樣式是可以,但這樣會很危險,也不提議 可以在生命週期鉤子函式裡面
vue中v-model的數據雙向綁定(重要)
area 忽略 數據綁定 -c ctype return option lan 關聯 <!DOCTYPE html> <html lang="en"> <head> <meta charset="UTF-8">
Vue中v-cloak的作用
<!DOCTYPE html> <html> <head> <meta charset="utf-8"> <title></title> <style> /*屬性選擇器*/ [v-cloak]{ d
三種方式解決vue中v-html元素中標籤樣式
當我們引入第三方元件或載入html元素時,想修改下樣式,就可以用以下三種方式: 一.去掉<style scoped>中的scoped 這個方法不建議使用,會改變佈局 二.定義兩個style標籤,一個含有scoped屬性,一個不含有scoped屬性 使用方法為 <
vue中v-if和v-show的區別
相同點 在組建掛載時判斷DOM節點是否要顯示 不同點 1.實現方式 1.v-if是根據後面資料的真假值判斷直接從Dom樹上刪除或重建元素節點 2.v-show只是在修改元素的css樣式,也就是di
在vue中使用echarts圖表
安裝vue依賴 使用npm npm install echarts --save 使用yarn yarn add echarts 使用國內的淘寶映象: //安裝淘寶映象 npm install -g cnpm --registry=https://registry.npm.taobao.org
Vue中v-for遍歷多層巢狀資料,不能重新渲染的問題
問題 { "properties": [ [ { "name": "property_name", "example": "travel_time", "value": "" }, { "name":
詳解在vue中使用echarts圖表例項程式碼
安裝vue依賴 使用npm npm install echarts --save 使用yarn yarn add echarts 使用國內的淘寶映象: //安裝淘寶映象 npm install -g cnpm --registry=https://registry
vue中v-for迴圈時只處理事件觸發項的內容(僅一項)
關於怎樣處理vue中v-for迴圈時對迴圈內容中單獨的一項的事件處理有如下方案:(1)獲取v-for迴圈內容中的下標值(val為navContent中的內容,index為下標) <p v-for="(val,index) in navContent" cl
vue中使用echarts圖表自適應的幾種基本解決方案
1.使用window.onresize let myChart = echarts.init(document.getElementById(dom)) window.onresize = function () { myChat.resize() } 優點:可以根據視窗
vue中v-for迴圈選中點選的元素並對該元素新增樣式
相信大家都會遇到這種情況:v-for迴圈時,我只需要點選到的元素做出相應反應,其他的元素不變;但是往往所有v-for迴圈出的元素都會變化。如下面的程式碼:我需要點選到的元素新增一個類樣式,其他元素不變,但是這樣會導致所有的元素都會變化 html: <div v-for = "(item
vue中v-for的用法以及參數的作用
sessions string tom index dde z-index ror bre weight 1 <template> 2 <div> 3 <div class="content clearfix" v-o