
python+OpenCV 特徵點檢測
1.Harris角點檢測
Harris角點檢測演算法是一個極為簡單的角點檢測演算法,該演算法在1988年就被髮明瞭,演算法的主要思想是如果畫素周圍顯示存在多於一個方向的邊,我們認為該點為興趣點。基本原理是根據公式:
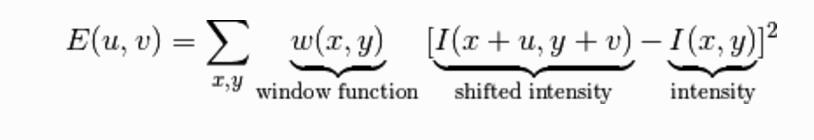
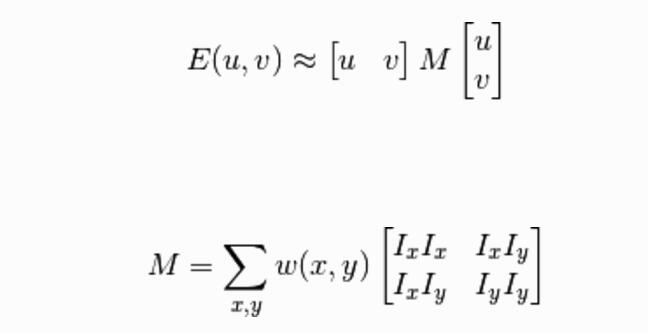
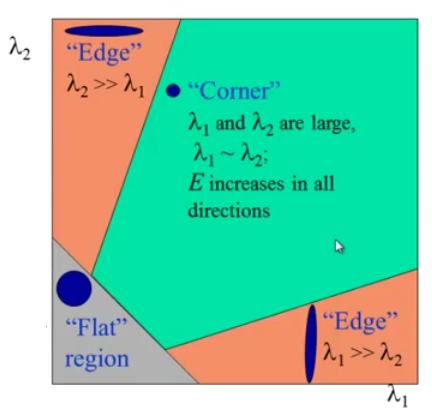
化簡為求解矩陣,最後根據矩陣的特徵值判斷是否為角點
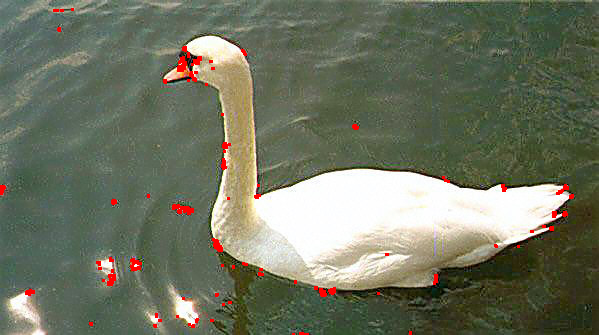
實現效果:

程式碼(不用OpenCV):
# -*- coding: utf-8 -*-
from pylab import *
from PIL import Image
from numpy import *
from scipy.ndimage import filters
print 'hello' OpenCV函式cv2.cornerHarris() 有四個引數 其作用分別為 :
img - Input image, it should be grayscale and float32 type.
blockSize - It is the size of neighbourhood considered for corner detection
ksize - Aperture parameter of Sobel derivative used.
k - Harris detector free parameter in the equation.
當然可以使用OpenCV在亞畫素上提高演算法的精度,使用函式cv2.cornerSubPix(),不過應該使用最新版的OpenCV 我電腦上是2.4.9版本,好像文件[2]中的程式碼沒有除錯通過,
下面是OpenCV程式碼的效果:
程式碼:
# -*- coding: utf-8 -*-
"""
Created on Sat Jun 11 23:21:18 2016

@author: season
"""

import cv2
import numpy as np


filename = 'swan.jpg'
img = cv2.imread(filename)
gray = cv2.cvtColor(img,cv2.COLOR_BGR2GRAY)

gray = np.float32(gray)
dst = cv2.cornerHarris(gray,2,3,0.04)

#result is dilated for marking the corners, not important
dst = cv2.dilate(dst,None)

# Threshold for an optimal value, it may vary depending on the image.
img[dst>0.01*dst.max()]=[0,0,255]

cv2.imshow('dst',img)
if cv2.waitKey(0) & 0xff == 27:
    cv2.destroyAllWindows()
測試OpenCV,numpy模組的程式碼:
#test cv2 and numpy package
print cv2.__version__
a = np.arange(10)
print(a)
2.sift特徵
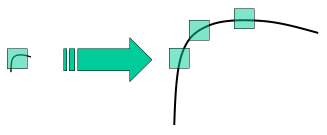
在Harris角點中對於下圖所示的特徵,小視窗中可能認為是角點,當視窗尺寸變化,則可能檢測不到角點。
2004年提出的Scale Invariant Feature Transform (SIFT) 是改進的基於尺度不變的特徵檢測器。
SIFT特徵包括興趣點檢測器和描述子,它對於尺度,旋轉和亮度都具有不變性。
有下面四個步驟
1. Scale-space Extrema Detection
2. Keypoint Localization
3. Orientation Assignment
4. Keypoint Descriptor
5. Keypoint Matching
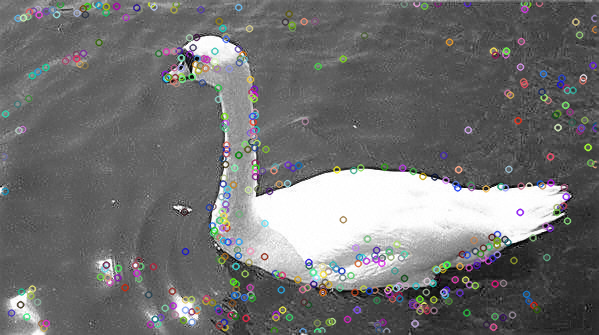
sift特徵點檢測效果:
sift的OpenCV程式碼比較簡單:
# -*- coding: utf-8 -*-
"""
Created on Sat Jun 11 20:22:51 2016

@author: season
"""

import cv2

import numpy as np
#import pdb
#pdb.set_trace()#turn on the pdb prompt

#test cv2 and numpy package
print cv2.__version__
a = np.arange(10)
print(a)

img = cv2.imread('swan.jpg')
gray= cv2.cvtColor(img,cv2.COLOR_BGR2GRAY)

sift = cv2.SIFT()
kp = sift.detect(gray,None)

img=cv2.drawKeypoints(gray,kp)

cv2.imwrite('sift_keypoints.jpg',img)
cv2.imshow("sift_keypoint",img)
cv2.waitKey(0)
cv2.destroyAllWindows()
3.SURF特徵點
In 2006, three people, Bay, H., Tuytelaars, T. and Van Gool, L, published another paper, “SURF: Speeded Up Robust Features” which introduced a new algorithm called SURF. As name suggests, it is a speeded-up version of SIFT.
在SURF演算法中,特徵點的判據為某畫素亮度的Hessian矩陣的行列式(Dxx*Dyy-Dxy*Dxy)為一個極值。由於Hessian矩陣的計算需要用到偏導數的計算,這一般通過畫素點亮度值與高斯核的某一方向偏導數卷積而成;在SURF演算法裡,為提高演算法執行速度,在精度影響很小的情況下,用近似的盒狀濾波器(0,1,1組成的box filter)代替高斯核。因為濾波器僅有0,-1,1,因此卷積的計算可以用積分影象(Integral image)來優化(O(1)的時間複雜度),大大提高了效率。
Surf在速度上比sift要快許多,這主要得益於它的積分圖技術,已經Hessian矩陣的利用減少了降取樣過程,另外它得到的特徵向量維數也比較少,有利於更快的進行特徵點匹配。
基於surf的人臉識別:
# -*- coding: utf-8 -*-
"""
Created on Wed Jun 15 22:05:44 2016

@author: Administrator
"""
import cv2


import numpy

opencv_haystack =cv2.imread('woman.jpg')
opencv_needle =cv2.imread('face.jpg')

ngrey = cv2.cvtColor(opencv_needle, cv2.COLOR_BGR2GRAY)
hgrey = cv2.cvtColor(opencv_haystack, cv2.COLOR_BGR2GRAY)

# build feature detector and descriptor extractor
hessian_threshold = 85
detector = cv2.SURF(hessian_threshold)
(hkeypoints, hdescriptors) = detector.detect(hgrey, None, useProvidedKeypoints = False)
(nkeypoints, ndescriptors) = detector.detect(ngrey, None, useProvidedKeypoints = False)

# extract vectors of size 64 from raw descriptors numpy arrays
rowsize = len(hdescriptors) / len(hkeypoints)
if rowsize > 1:
    hrows = numpy.array(hdescriptors, dtype = numpy.float32).reshape((-1, rowsize))
    nrows = numpy.array(ndescriptors, dtype = numpy.float32).reshape((-1, rowsize))
    #print hrows.shape, nrows.shape
else:
    hrows = numpy.array(hdescriptors, dtype = numpy.float32)
    nrows = numpy.array(ndescriptors, dtype = numpy.float32)
    rowsize = len(hrows[0])

# kNN training - learn mapping from hrow to hkeypoints index
samples = hrows
responses = numpy.arange(len(hkeypoints), dtype = numpy.float32)
#print len(samples), len(responses)
knn = cv2.KNearest()
knn.train(samples,responses)

# retrieve index and value through enumeration
count = 1

for i, descriptor in enumerate(nrows):
    descriptor = numpy.array(descriptor, dtype = numpy.float32).reshape((1, rowsize))
    #print i, descriptor.shape, samples[0].shape
    retval, results, neigh_resp, dists = knn.find_nearest(descriptor, 1)
    res, dist =  int(results[0][0]), dists[0][0]
    #print res, dist

    if dist < 0.1:
        count = count+1
        # draw matched keypoints in red color
        color = (0, 0, 255)
#    else:
#        # draw unmatched in blue color
#        color = (255, 0, 0)
    # draw matched key points on haystack image
        x,y = hkeypoints[res].pt
        center = (int(x),int(y))
        cv2.circle(opencv_haystack,center,2,color,-1)
        # draw matched key points on needle image
        x,y = nkeypoints[i].pt
        center = (int(x),int(y))
        cv2.circle(opencv_needle,center,2,color,-1)


cv2.imshow("Input Image", opencv_haystack)
cv2.waitKey(0)
cv2.imshow("The match Result", opencv_needle)
cv2.waitKey(0)

print count
if count>40:
    print "Yes Success!"
else:
    print "False Face!"
#cv2.waitKey(0)
#cv2.destroyAllWindows()
4.ORB特徵
一種新的具有區域性不變性的特徵 —— ORB特徵,從它的名字中可以看出它是對FAST特徵點與BREIF特徵描述子的一種結合與改進,這個演算法是由Ethan Rublee,Vincent Rabaud,Kurt Konolige以及Gary R.Bradski在2011年一篇名為“ORB:An Efficient Alternative to SIFT or SURF”的文章中提出。就像文章題目所寫一樣,ORB是除了SIFT與SURF外一個很好的選擇,而且它有很高的效率,最重要的一點是它是免費的,SIFT與SURF都是有專利的,你如果在商業軟體中使用,需要購買許可。
實現效果:
程式碼:
# -*- coding: utf-8 -*-
"""
Created on Thu Jun 16 11:11:18 2016
@author: Administrator
"""
import numpy as np
import cv2
#from matplotlib import pyplot as plt
print cv2.__version__
img1 = cv2.imread('woman.jpg',0) # queryImage
img2 = cv2.imread('face.jpg',0) # trainImage
def drawMatches(img1, kp1, img2, kp2, matches):
"""
My own implementation of cv2.drawMatches as OpenCV 2.4.9
does not have this function available but it's supported in
OpenCV 3.0.0
This function takes in two images with their associated
keypoints, as well as a list of DMatch data structure (matches)
that contains which keypoints matched in which images.
An image will be produced where a montage is shown with
the first image followed by the second image beside it.
Keypoints are delineated with circles, while lines are connected
between matching keypoints.
img1,img2 - Grayscale images
kp1,kp2 - Detected list of keypoints through any of the OpenCV keypoint
detection algorithms
matches - A list of matches of corresponding keypoints through any
OpenCV keypoint matching algorithm
"""
# Create a new output image that concatenates the two images together
# (a.k.a) a montage
rows1 = img1.shape[0]
cols1 = img1.shape[1]
rows2 = img2.shape[0]
cols2 = img2.shape[1]
out = np.zeros((max([rows1,rows2]),cols1+cols2,3), dtype='uint8')
# Place the first image to the left
out[:rows1,:cols1] = np.dstack([img1, img1, img1])
# Place the next image to the right of it
out[:rows2,cols1:] = np.dstack([img2, img2, img2])
# For each pair of points we have between both images
# draw circles, then connect a line between them
for mat in matches:
# Get the matching keypoints for each of the images
img1_idx = mat.queryIdx
img2_idx = mat.trainIdx
# x - columns
# y - rows
(x1,y1) = kp1[img1_idx].pt
(x2,y2) = kp2[img2_idx].pt
# Draw a small circle at both co-ordinates
# radius 4
# colour blue
# thickness = 1
cv2.circle(out, (int(x1),int(y1)), 4, (255, 0, 0), 1)
cv2.circle(out, (int(x2)+cols1,int(y2)), 4, (255, 0, 0), 1)
# Draw a line in between the two points
# thickness = 1
# colour blue
cv2.line(out, (int(x1),int(y1)), (int(x2)+cols1,int(y2)), (255, 0, 0), 1)
# Show the image
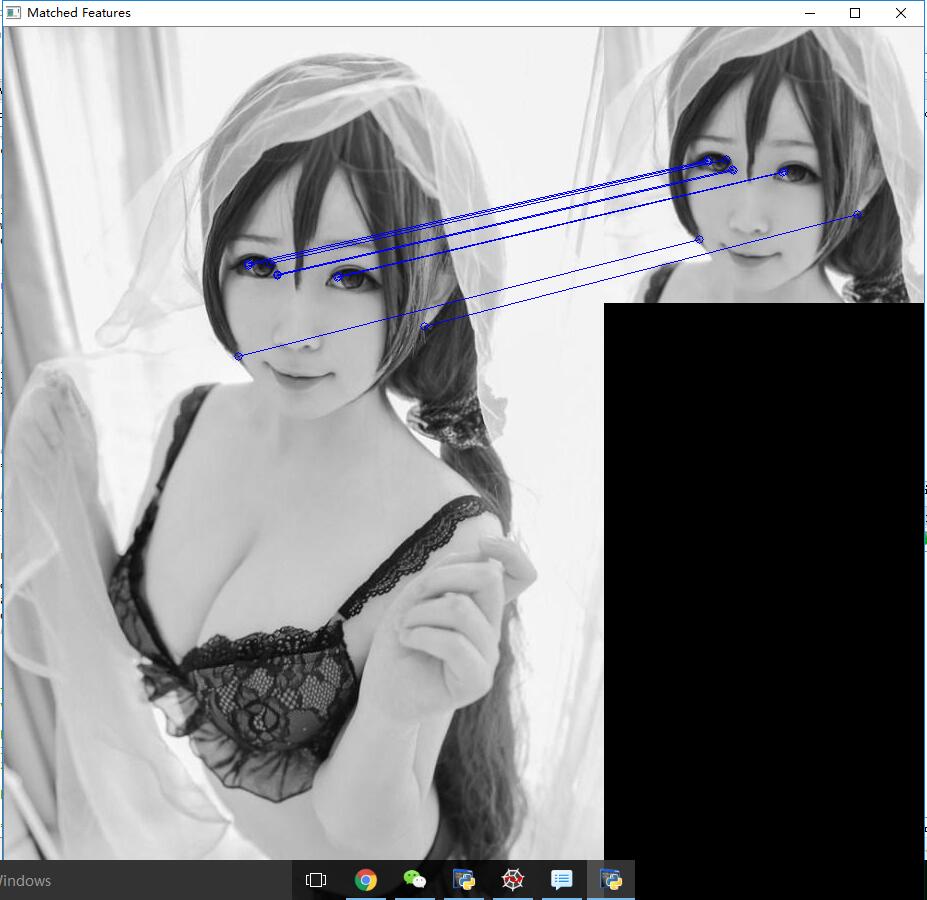
cv2.imshow('Matched Features', out)
cv2.waitKey(0)
cv2.destroyWindow('Matched Features')
# Also return the image if you'd like a copy
return out
# Initiate SIFT detector
orb = cv2.ORB()
# find the keypoints and descriptors with SIFT
kp1, des1 = orb.detectAndCompute(img1,None)
kp2, des2 = orb.detectAndCompute(img2,None)
# create BFMatcher object
bf = cv2.BFMatcher(cv2.NORM_HAMMING, crossCheck=True)
# Match descriptors.
matches = bf.match(des1,des2)
# Sort them in the order of their distance.
matches = sorted(matches, key = lambda x:x.distance)
# Draw first 10 matches.
img3 = drawMatches(img1,kp1,img2,kp2,matches[:10])
cv2.imshow('dst',img3)
if cv2.waitKey(0) & 0xff == 27:
cv2.destroyAllWindows()
#plt.imshow(img3),plt.show()
'''
draw match 函式在下面的連結中有自己的實現,我直接複製過來了
http://stackoverflow.com/questions/20259025/module-object-has-no-attribute-drawmatches-opencv-python
'''未完待續