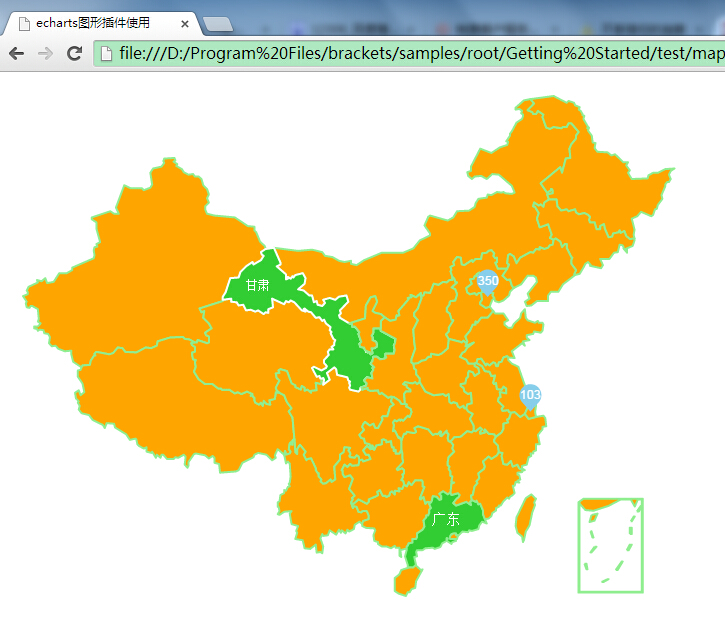
使用echarts簡單製作中國地圖
網站需要一張中國地圖,並且滑鼠經過某個省份,該省份的省份名字顯示,而且該省份的地區會變色顯示。
第一種方法:
將每個省份的圖片定位(先隱藏),拼合成一張中國地圖,然後再定位省份名稱,滑鼠經過省份名字,新增hover事件,將對應圖片顯示。
第二種方法:
使用圖形外掛echarts,輕鬆製作。
http://echarts.baidu.com/doc/example.html在echarts網站上下載檔案包
echarts使用方法檢視頁面
http://echarts.baidu.com/doc/doc.html#%E5%BC%95%E5%85%A5ECharts3
可以在網站上調整好需要的樣式再放到本地看效果
自己試驗的demo如下:
<!doctype html>
<html>
<head>
<meta charset="utf-8">
<title>echarts圖形外掛使用</title>
</head>
<body>
<div id="main" style="height:800px;"></div>
<script type="text/javascript" src="js/echarts-all.js"></script>
<script type="text/javascript">
var myChart = echarts.init(document.getElementById('main'));
var option = {
series: [
{
name: 'Map',
type: 'map',
mapLocation: {
x: 'left',
y: 'top',
height: 500
},
selectedMode: 'multiple',
itemStyle: {
normal: {
borderWidth: 2,
borderColor: 'lightgreen',
color: 'orange',
label: {
show: false
}
},
emphasis: { // 也是選中樣式
borderWidth: 2,
borderColor: '#fff',
color: '#32cd32',
label: {
show: true,
textStyle: {
color: '#fff'
}
}
}
},
data: [
{
name: '廣東',
value: Math.round(Math.random() * 1000),
itemStyle: {
normal: {
color: '#32cd32',
label: {
show: true,
textStyle: {
color: '#fff',
fontSize: 15
}
}
},
emphasis: { // 也是選中樣式
borderWidth: 5,
borderColor: 'yellow',
color: '#cd5c5c',
label: {
show: false,
textStyle: {
color: 'blue'
}
}
}
}
}
],
markPoint: {
itemStyle: {
normal: {
color: 'skyblue'
}
},
data: [
{
name: '天津',
value: 350
},
{
name: '上海',
value: 103
},
{
name: 'echarts',
symbol: 'image://../asset/img/echarts-logo.png',
symbolSize: 21,
x: 300,
y: 100
}
]
},
geoCoord: {
'上海': [121.4648, 31.2891],
'天津': [117.4219, 39.4189]
}
}
]
}
myChart.setOption(option);
</script>
</body>
</html>
效果圖如下:


