1. 程式人生 > >《合成孔徑雷達成像——演算法與實現》之【9】模擬圖3.10

《合成孔徑雷達成像——演算法與實現》之【9】模擬圖3.10

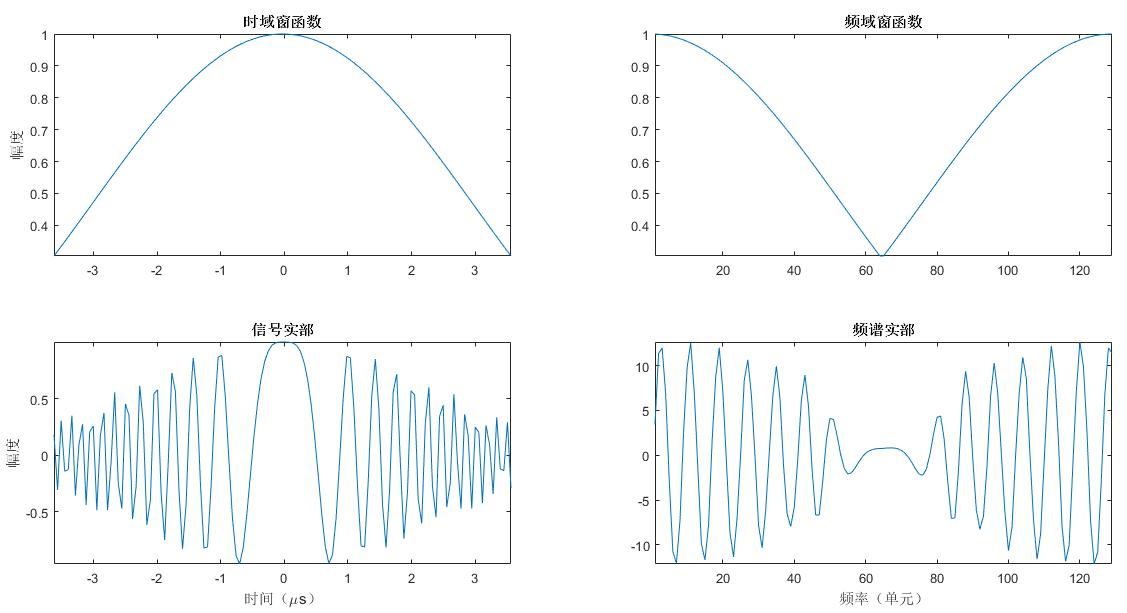
加窗是為了增加目標響應函式的峰值旁邊比,可分為時域窗和頻域窗。

這裡寫圖片描述

% SAR_Figure_3_10
% 2016.10.12

close all;clear all;clc

T = 7.24e-6;                % 訊號持續時間
B = 14.2e6;                 % 訊號頻寬
K = B/T;                    % 調頻率
ratio = 1.25;               % 過取樣率
Fs = ratio*B;               % 取樣頻率
dt = 1/Fs;                  % 取樣間隔
N = ceil
(T/dt); % 取樣點數 t = ((0:N-1)-N/2)/N*T; % 時間軸 f = ((0:N-1)-N/2)/N*Fs; % 頻率軸 st = exp(1i*pi*K*t.^2); % 生成訊號 Sf = fft(st); % FFT Hf = exp(1i*pi*f.^2/K); % 頻域匹配濾波器 Out = Sf.*Hf; % 頻域匹配濾波 window = kaiser(N,2.5)'; % 時域窗 Window = fftshift(window); % 頻域窗 st_window = st.*window; % 時域加窗 Out_Window = Out.*Window; % 頻域匹配濾波後加窗 figure,set(gcf,'
Color','w'); subplot(2,2,1),plot(t*1e6,window);axis tight title('時域窗函式'),ylabel('幅度'); subplot(2,2,2),plot(Window);axis tight title('頻域窗函式'); subplot(2,2,3),plot(t*1e6,real(st_window));axis tight title('訊號實部'),xlabel('時間(\mus)'),ylabel('幅度'); subplot(2,2,4),plot(real(Out_Window));axis tight title('頻譜實部'
),xlabel('頻率(單元)');