
prometheus獲取Consul上註冊的服務
在上一篇《springboot整合prometheus》裡,已介紹了springboot和promethues的整合,但是這裡有個問題,就是在prometheus.yml裡配置需要監聽的服務時,是按服務名寫死的,如果後面增加了微服務,就得手動修改此配置,並重啟promethues;那麼能否動態的監聽微服務呢。我們知道,在分散式系統架構裡,有個元件負責註冊和發現所有微服務,那就是註冊中心。常用的註冊中心元件有Spring Cloud Netflix的Eureka,consul,dubbo等,如果promethues能監聽服務註冊中心的微服務,就能實現動態監聽服務的功能了。這裡以consul為例來整合promethues。
Consul 是什麼
Consul 是一個支援多資料中心分散式高可用的服務發現和配置共享的服務軟體,由 HashiCorp 公司用 Go 語言開發, 基於 Mozilla Public License 2.0 的協議進行開源. Consul 支援健康檢查,並允許 HTTP 和 DNS 協議呼叫 API 儲存鍵值對.
命令列超級好用的虛擬機器管理軟體 vgrant 也是 HashiCorp 公司開發的產品.
一致性協議採用 Raft 演算法,用來保證服務的高可用. 使用 GOSSIP 協議管理成員和廣播訊息, 並且支援 ACL 訪問控制.
Consul 的使用場景
- docker 例項的註冊與配置共享
- coreos 例項的註冊與配置共享
- vitess 叢集
- SaaS 應用的配置共享
- 與 confd 服務整合,動態生成 nginx 和 haproxy 配置檔案
將微服務註冊到consul上

通過檢視promethues配置檔案的官方文件,發現promethues提供了和多種服務發現註冊中心整合的配置選項,包括Azure,Consul,DNS,EC2,OpenStack,GCE,Kubernetes等;關鍵的具體配置如下:
scrape_configs:
  # The job name is added as a label `job=<job_name>` to any timeseries scraped from this config.
  - job_name: 'prometheus'

    # Override the global default and scrape targets from this job every 5 seconds.
    scrape_interval: 5s

    # metrics_path defaults to '/metrics'
    # scheme defaults to 'http'.

    static_configs:
      - targets: ['localhost:9090']

  - job_name: 'security'
    # Override the global default and scrape targets from this job every 5 seconds.
    scrape_interval: 5s

    metrics_path: '/prometheus'
    # scheme defaults to 'http'.

    static_configs:
      - targets: ['10.94.20.33:80']

  - job_name: 'overwritten-default'
    consul_sd_configs:
    - server:   '10.110.200.29:8500'
      services: ['lookup', 'security', 'workflow']

    relabel_configs:
    - source_labels: ['__metrics_path__']
      regex:         '/metrics'
      target_label:  __metrics_path__
      replacement:   '/prometheus'
這裡簡單說明下上面的配置意義:
在scrape_configs下,定義了3個job_name,其中 - job_name: 'prometheus'是監聽prometheus服務本身;job_name: 'security'是按固定IP:PORT的方式監聽微服務 ;job_name: 'overwritten-default'就是一個監聽consul的任務,在consul_sd_configs下,server是consul伺服器的訪問地址,services是微服務名的陣列,如果什麼都不填,則預設取consul上註冊的所有微服務。relabel_configs是修改預設配置的規則,這裡由於使用了
springboot和promethues整合,暴露的metrics是通過/promethues路徑訪問的,而promethues預設的metrics訪問路徑(即metrics_path配置項)是/metrics,需要修改。
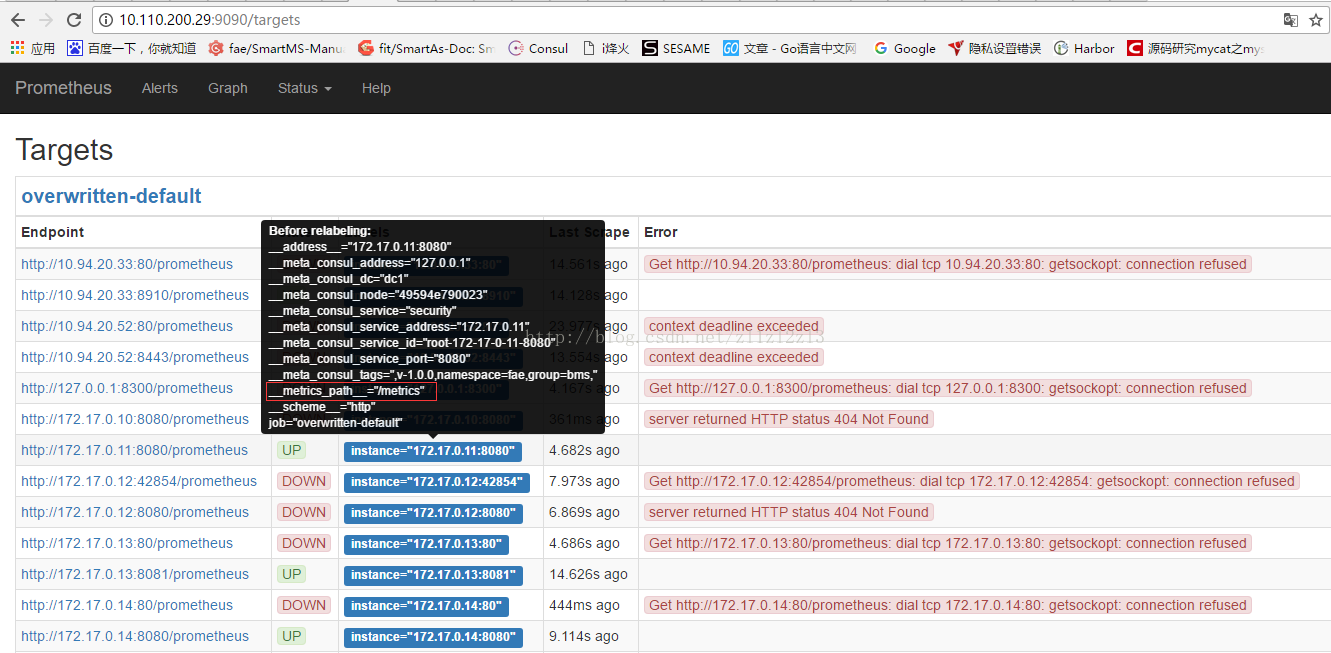
如下圖:當把滑鼠放在某個label上時,顯示了Before relabeling的配置,可以看到__metrics_path__='/metrics',所以必須通過relabel_configs方式修改為‘/promethues’後,才能讓此微服務的狀態為UP,不然會因為不符合格式錯誤而使Endpoint的狀態為DOWN。
關於relabel_configs的更多配置詳解,請參考官方文件,這裡只是替換文字的最基本用法。