[matplotlib] 繪製Cross-Validation的誤差圖
阿新 • • 發佈:2019-02-01
概述:
在調整模型引數的時候,往往會進行交叉驗證(Cross-Validation)。繪製交叉驗證的誤差圖。
資料:
k是需要調整的引數, 從k_choices中選取
k_choices = [1, 3, 5, 8, 10, 12, 15, 20, 50, 100]
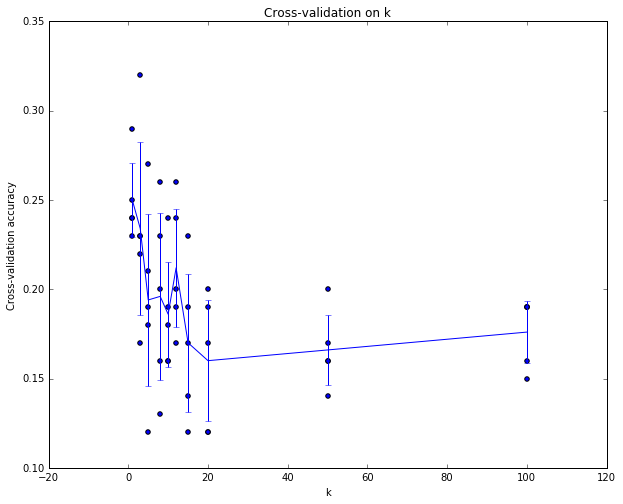
假設經過驗證以後k_to_accuracies字典裡儲存了k取不同值時多次驗證的準確性:
k_to_accuracies = {
    1: [0.24, 0.23, 0.24, 0.25, 0.29],
    3: [0.17, 0.23, 0.32, 0.22, 0.23],
    5: [0.12, 0.21, 0.27, 0.19, 0.18],
    8: [0.13, 0.23, 0.26, 0.16, 0.2],
    10: [0.16, 0.18, 0.24, 0.16, 0.19],
    12: [0.17, 0.19, 0.24, 0.2, 0.26],
    15: [0.17, 0.23, 0.19, 0.12, 0.14],
    20: [0.12, 0.17, 0.19, 0.12, 0.2],
    50: [0.2, 0.16, 0.17, 0.16, 0.14],
    100: [0.16, 0.15, 0.19, 0.19, 0.19],
}
繪圖
繪圖的程式碼如下:
for k in k_choices:
  accuracies = k_to_accuracies[k]
  plt.scatter([k] * len(accuracies), accuracies)

# plot the trend line with error bars that correspond to standard deviation
accuracies_mean = np.array([np.mean(v) for k,v in sorted(k_to_accuracies.items())])
accuracies_std = np.array([np.std(v) for k,v in sorted(k_to_accuracies.items())])
plt.errorbar(k_choices, accuracies_mean, yerr=accuracies_std)
plt.title('Cross-validation on k')
plt.xlabel('k')
plt.ylabel('Cross-validation accuracy')
plt.show()