教你快速的使用ggplot2畫熱圖
阿新 • • 發佈:2019-02-02
1.匯入需要的packages
library(ggplot2)
require(reshape2)
require(scales)
2.匯入資料:
nba <- read.csv("http://datasets.flowingdata.com/ppg2008.csv")

nba$Name <- with(nba, reorder(Name, PTS))
> head(nba)
Name G MIN PTS FGM FGA FGP FTM FTA FTP X3PM X3PA X3PP ORB DRB TRB AST STL BLK TO 3.融合資料:
nba.m <- melt(nba) > head(nba.m)
Name variable value
1 Dwyane Wade G 79
2 LeBron James G 81
3 Kobe Bryant G 82
4 Dirk Nowitzki G 81
5 Danny Granger G 67
6 Kevin Durant G 744.Scale之後列名命名為rescale放入原資料nba.m
nba.m <- ddply(nba.m, .(variable), transform,rescale = rescale(value))> head(nba.m)
Name variable value rescale
1 Dwyane Wade G 79 0.9473684
2 LeBron James G 81 0.9824561
3 Kobe Bryant G 82 1.0000000
4 Dirk Nowitzki G 81 0.9824561
5 Danny Granger G 67 0.7368421
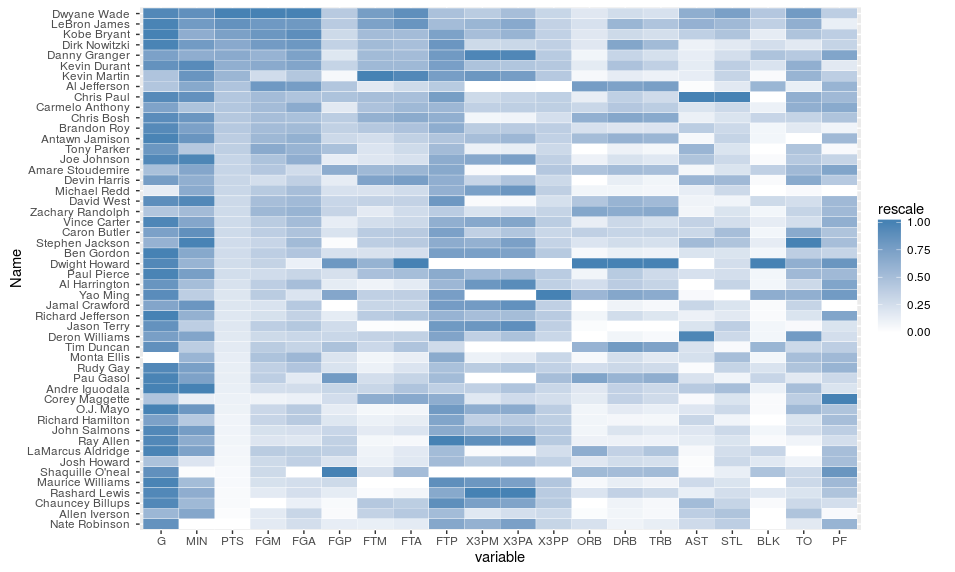
6 Kevin Durant G 74 0.85964915.畫熱圖
p <- ggplot(nba.m, aes(variable, Name)) + geom_tile(aes(fill = rescale),colour = "white") + scale_fill_gradient(low = "white",high = "steelblue")
p
6.結果展示