
Unity記憶體優化(-)託管堆ManagedHeap的優化
很多童鞋在進行記憶體分析的時候都會遇到下面的問題:
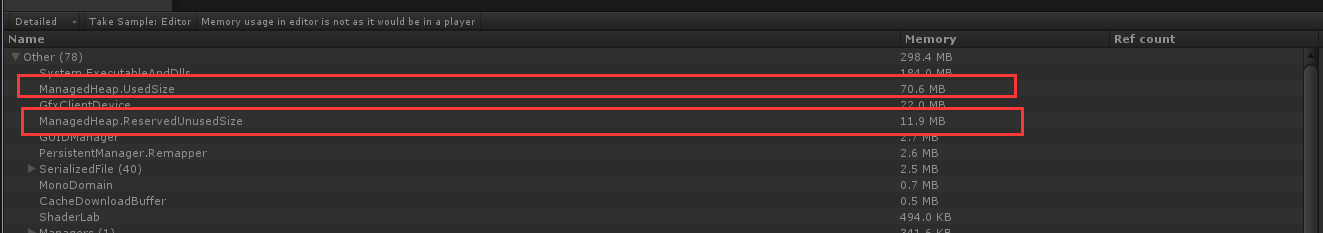
ManagedHeap.UsedSize和ManagedHeap.reservedUnUsedSize這兩個佔用了很大記憶體,即使手動GC.Collect之後,ManagedHeap.UsedSize和ManagedHeap.reservedUnUsedSize兩者的綜合仍然沒有發生變化,記憶體佔用依然沒有緩解。
在分析記憶體時,也發現了相同的問題。之前的資料表是用Json格式儲存的,資料表比較大將近30M,當讀取到記憶體的時候出現了上面的情況。
這是為什麼呢?首先,我們要了解幾個概念:
- ManagedHeap 表示的是Mono所使用的託管堆記憶體,C#上任何的申請託管的記憶體都會在這個上面申請。
- ManagedHeap.UsedSize 表示這個託管堆上已經使用的記憶體大小
- ManagedHeap.reservedUnUsedSize 表示託管堆上未使用的記憶體大小
當我們申請記憶體時,如果ManagedHeap.reservedUnUsedSize的記憶體不夠用,Mono會向os申請記憶體。並且這個記憶體會擴大ManagedHeap的大小,並且這個記憶體不會回落。
我們可以通過Profiler.GetMonoHeapSize()獲取Mono堆上的總記憶體和mono_gc_get_heap_size是一個意思。
下面寫了一個測試用例:
using UnityEngine;
using System;
using System.Runtime.InteropServices;
using System.Text;

public class TestManagedHeap : MonoBehaviour
{
    public int arraysize = 1024 * 1024 * 200;//條件觸發延遲申請的記憶體1
    public int arraysize_frame = 1024 * 1024 * 10;//條件觸發延遲申請的記憶體2

    [DllImport("mono.dll")]
    public static extern long mono_gc_get_used_size();
    [DllImport("mono.dll")]
    public static extern long mono_gc_get_heap_size();

    //private StringBuilder builder = new StringBuilder(256);
    // Use this for initialization
    void Start()
    {
    }

    // Update is called once per frame
    void Update()
    {
        if (Input.GetKeyDown(KeyCode.U))
        {
            byte[] array = new byte[arraysize];
            array = null;
            Debug.Log("申請200M");
            printMemory();
        }
        if (Input.GetKeyDown(KeyCode.A))
        {
            byte[] array = new byte[arraysize_frame];
            Debug.Log("申請10M");
            printMemory();
        }
        if (Input.GetKeyDown(KeyCode.B))
        {
            Debug.Log("呼叫GC");
            GC.GetTotalMemory(true);
            printMemory();
        }
    }

    void printMemory()
    {
        long usedsize = mono_gc_get_used_size();
        long heapsize = mono_gc_get_heap_size();
        long reservedsize = heapsize - usedsize;
        builder.Length = 0;
        //builder.AppendFormat("使用記憶體:{0},剩餘記憶體{1},託管堆記憶體{2}",usedsize,reservedsize,heapsize);
        //print(builder.ToString());
    Debug.Log("使用記憶體=" + usedsize * 1.0f / 1024 / 1024 + "M");
     Debug.Log("剩餘記憶體=" + reservedsize * 1.0f / 1024 / 1024 + "M");
    Debug.Log("託管堆記憶體=" + heapsize * 1.0f / 1024 / 1024 + "M");
 }
在測試中會發現,當申請了200M的記憶體後,再申請10M的記憶體。堆上的記憶體mono_gc_get_heap_size並沒有減少,這是因為,在Mono堆上的記憶體在應用程式執行期間是隻增不減的,即使GC也不會把申請的記憶體還給os,而是設定成了未使用狀態。
Memory is allocated in heap blocks. More can allocated if it cannot fit the data into the allocated block. Heap blocks will be kept in Mono until the app is closed. In other words, Mono does not release any memory used to the OS (Unity 3.x). Once you allocate a certain amount of memory, it is reserved for mono and not available for the OS. Even when you release it, it will become available internally for Mono only and not for the OS. The heap memory value in the Profiler will only increase, never decrease.
上面是摘自Unity官方API對Profiling對Mono Memory的解釋。
鑑於這個原因,在app開發時需要注意什麼呢?
- 不要一次性申請過大的記憶體;
- 切換場景等操作時可以自己手動呼叫GC.Collec
原文地址:http://www.showxyz.com/?p=96