
淺談highcharts(echarts)通過ajax獲取後臺資料從而改變資料圖
阿新 • • 發佈:2019-02-09
好久沒寫csdn部落格了,隨著工作專案的展開自己也越來懶了。。不過今天有點空餘的時間,所以來寫寫部落格。
恰巧這次的專案有圖表這一塊,所以就用到了highcharts和echarts。
我們都知道如果寫純靜態的圖表圖很簡單,那麼如果寫動態的圖表圖該如何寫呢?
好了,不多BB了,言歸正傳!
1、引入圖表所需要的js檔案
    <script src="/App/AppV3/js/jquery.min.js" type="text/javascript"></script>
    <script src="/App/AppV3/js/DeskTop/jquerysession.js" type="text/javascript"></script><!--這個是session.js檔案,是我自己需要的-->
    <script src="/App/AppV3/js/DeskTop/PryKPI.js" type="text/javascript"></script><!--自己的js檔案-->
    <script src="/App/AppV3/js/DeskTop/render_data.js" type="text/javascript"></script><!--自己的js檔案-->
    <script src="http://echarts.baidu.com/build/dist/echarts.js" type="text/javascript" ></script><!--通過cdn線上引入echarts-->
    <script src="https://img.hcharts.cn/highcharts/highcharts.js" type="text/javascript" ></script><!--通過cdn線上引入highchats檔案-->
2、先把純靜態的highcharts佈局好(以highcharts為例)
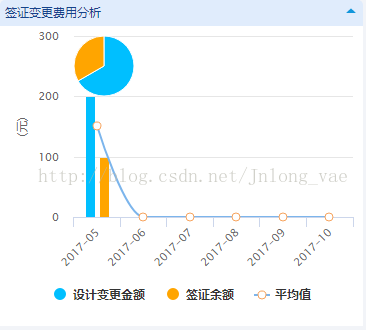
//	"簽證變更"圖表
    var chart3 = Highcharts.chart('change_attestation', {
        chart: {
            type: 'column'
        },
        title: {
            text: null
        },
        xAxis: {
            categories: ['2017-05', '2017-06', '2017-07', '2017-08', '2017-09', '2017-10']
        },
        yAxis: [{
            title: {
                text: '(元)'
            }
        }],
        tooltip: {
            headerFormat: '<span style="font-size:10px">{point.key}</span><table>',
            pointFormat: '<tr><td style="color:{series.color};padding:0">{series.name}: </td>' +
            '<td style="padding:0"><b>{point.y:.1f} (元)</b></td></tr>',
            footerFormat: '</table>',
            shared: true,
            useHTML: true
        },
        plotOptions: {
            column: {
                pointPadding: 0.2,
                borderWidth: 0
            }
        },
        labels: {
            items: [{
                style: {
                    left: '300px',
                    top: '-20px',
                    color: (Highcharts.theme && Highcharts.theme.textColor) || 'black'
                }
            }]
        },
        series: [{
            name: '設計變更金額',
            data: [200, 0, 0, 0, 0, 0],
            color: 'deepskyblue'
        }, {
            name: '簽證餘額',
            data: [100, 0, 0, 0, 0, 0],
            color: 'orange'
        }, {
            type: 'spline',
            name: '平均值',
            data: [150, 0, 0, 0, 0, 0],
            marker: {
                lineWidth: 1,
                lineColor: Highcharts.getOptions().colors[3],
                fillColor: 'white'
            }
        }, {
            type: 'pie',
            name: '費用分析',
            data: [{
                name: '設計變更金額',
                y: 200,
                color: 'deepskyblue'
            }, {
                name: '簽證餘額',
                y: 100,
                color: 'orange'
            }],
            center: [10,10],
            size: 60,
            showInLegend: false,
            dataLabels: {
                enabled: false
            }
        }]
    });
這段js程式碼我寫在KPI.js檔案裡了
3、通過ajax動態獲取後臺資料賦值給圖表中的data資料
這裡我是通過button按鈕選擇專案,然後獲取到對應的專案唯一ID,從而來獲取專案對應的資料
//"簽證變更"圖表
            $("#change_attestation").html("");
            var chart3 = Highcharts.chart('change_attestation', {
                chart: {
                    type: 'column'
                },
                title: {
                    text: null
                },
                xAxis: {

                },
                yAxis: [{
                    title: {
                        text: '(元)'
                    }
                }],
                tooltip: {
                    headerFormat: '<span style="font-size:10px">{point.key}</span><table>',
                    pointFormat: '<tr><td style="color:{series.color};padding:0">{series.name}: </td>' +
            '<td style="padding:0"><b>{point.y:.1f} (元)</b></td></tr>',
                    footerFormat: '</table>',
                    shared: true,
                    useHTML: true
                },
                plotOptions: {
                    column: {
                        pointPadding: 0.2,
                        borderWidth: 0
                    }
                },
                labels: {
                    items: [{
                        style: {
                            left: '300px',
                            top: '-20px',
                            color: (Highcharts.theme && Highcharts.theme.textColor) || 'black'
                        }
                    }]
                },
                series: [{
                    name: '設計變更金額',
                    color: 'deepskyblue'
                }, {
                    name: '簽證餘額',
                    color: 'orange'
                }, {
                    type: 'spline',
                    name: '平均值',
                    marker: {
                        lineWidth: 1,
                        lineColor: Highcharts.getOptions().colors[3],
                        fillColor: 'white'
                    }
                }, {
                    type: 'pie',
                    name: '費用分析',
                    data: [{
                        name: '設計變更金額',
                        color: 'deepskyblue'
                    }, {
                        name: '簽證餘額',
                        color: 'orange'
                    }],
                    center: [10,10],
                    size: 60,
                    showInLegend: false,
                    dataLabels: {
                        enabled: false
                    }
                }]
            });
            $.ajaxSettings.async = false;//關於這個求平均數問題,必須要把這個改成同步!!!否則出現想讓人屎的bug!!!
            $.getJSON("/App/AppV3/oa/DeskTop/PrjKPI.ashx?method=getCostSJList&PrjID=" + PrjId, function (data) {
                var resp = data.rows;
                var s1 = [];
                for (var i = 0; i < resp.length; i++) {
                    s1.push(resp[i].ChangeMoneySum)
                }  //到這裡我是通過ajax獲取到專案圖表所需要的data資料
                $.session.set('cmSum', s1);  //這裡是把設計變更金額陣列作為sessionStorage快取到瀏覽器端,便於待會的平均數求值
                chart3.xAxis[0].setCategories([resp[0].Date, resp[1].Date, resp[2].Date, resp[3].Date, resp[4].Date, resp[5].Date]);
		//setCategories是把獲取到的X軸資料新增到X軸上
                chart3.series[0].update({
                    data: [parseInt(resp[0].ChangeMoneySum), parseInt(resp[1].ChangeMoneySum), parseInt(resp[2].ChangeMoneySum), parseInt(resp[3].ChangeMoneySum), parseInt(resp[4].ChangeMoneySum), parseInt(resp[5].ChangeMoneySum)]
                });//update是把獲取到的圖表資料新增到data陣列中去
            });
            $.getJSON("/App/AppV3/oa/DeskTop/PrjKPI.ashx?method=getCostQZList&PrjID=" + PrjId, function (data) {
                var resp = data.rows;
                var s2 = [];
                for (var i = 0; i < resp.length; i++) {
                    s2.push(resp[i].ChkMoneySum)
                }
                $.session.set('chmSum', s2);
                chart3.series[1].update({
                    data: [parseInt(resp[0].ChkMoneySum), parseInt(resp[1].ChkMoneySum), parseInt(resp[2].ChkMoneySum), parseInt(resp[3].ChkMoneySum), parseInt(resp[4].ChkMoneySum), parseInt(resp[5].ChkMoneySum)]
                });
            });
            var CMsum = $.session.get('cmSum');
            var CHMsum = $.session.get('chmSum');
            var cm = new Array();
            var chm = new Array();
            cm = CMsum.split(',');
            chm = CHMsum.split(',');
            chart3.series[2].update({
                 data: [(parseInt(cm[0]) + parseInt(chm[0])) / 2, (parseInt(cm[1]) + parseInt(chm[1])) / 2,
                        (parseInt(cm[2]) + parseInt(chm[2])) / 2, (parseInt(cm[3]) + parseInt(chm[3])) / 2,
                        (parseInt(cm[4]) + parseInt(chm[4])) / 2, (parseInt(cm[5]) + parseInt(chm[5])) / 2]
             });
             chart3.series[3].update({
                 data: [{'y':parseInt(cm[0])+parseInt(cm[1])+parseInt(cm[2])+parseInt(cm[3])+parseInt(cm[4])+parseInt(cm[5])},
                        { 'y': parseInt(chm[0]) + parseInt(chm[1]) + parseInt(chm[2]) + parseInt(chm[3]) + parseInt(chm[4]) + parseInt(chm[5])}]
             });
當我選擇no:1的專案時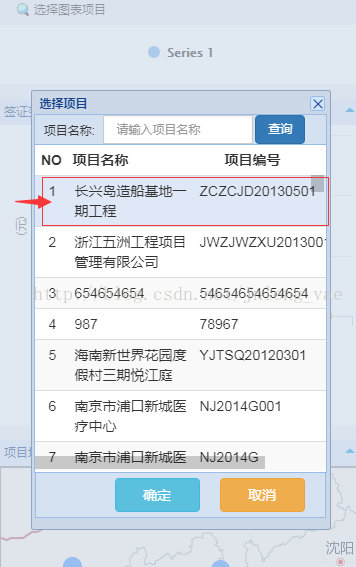
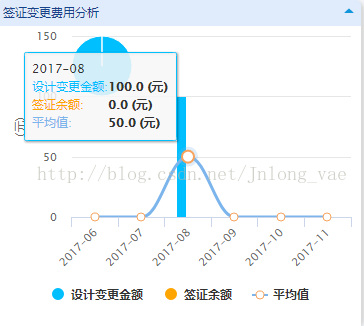
當我選擇no:2專案時

結語:嗯,這就是我今天寫的部落格,有不嚴謹之處還望大神不惜賜教。