效能測試初探---介面效能測試
(一).效能指標
PV: PageView, 頁面瀏覽量或點選量,使用者每次重新整理即被計算一次;使用者的一次重新整理,給伺服器造成了一次請求。
UV: UniqueVisitor, 訪問你網站的一臺計算機客戶端為一個訪客,0:00 - 24:00 內相同的客戶端僅記一次。
TPS: Transaction Per Second 每秒系統處理的交易或事物的數量,衡量系統處理能力的重要指標。
RT: 響應時間,從客戶端傳送一個請求開始,到客戶端接收到從伺服器返回的響應結果結束所經歷的時間,包括請求傳送時間,網路傳輸時間和伺服器處理時間三部分。
VU: Virtual User, 模擬真實業務邏輯步驟的虛擬使用者,虛擬使用者模擬的操作步驟被記錄在虛擬使用者指令碼中,通常使用併發實現。
TPS波動: 系統性能依賴於特定的硬體、軟體程式碼、應用服務、網路資源等,所以在效能場景執行期間,TPS可能會表現為穩定,或者波動,抑或遵循一定的上升或下降趨勢。用TPS波動係數來記錄這個指標值。
CPU: CPU資源是指效能測試場景執行的這個時間段內,應用服務系統的CPU資源佔用率。CPU資源是判斷系統處理能力以及應用執行是否穩定的重要引數。
Load: 系統正在幹活的多少的度量,佇列長度。系統平均負載,被定義為在特定時間間隔(1m,5m,15m)內執行佇列中的平均程序數。
I/O: I/O可分為磁碟IO和網絡卡IO。
JVM: 即Java虛擬機器,它擁有自己的處理器、堆疊、暫存器等,還有自己相應的指令系統。Java應用執行在JVM上面。
GC: GC是一種自動記憶體管理程式,它主要的職責是分配記憶體、保證被引用的物件始終在記憶體中、把不被應用的物件從記憶體中釋放。FGC會引起JVM掛起。
網速: 網路中的資料傳輸速率,一般以Byte/s為單位。通過ping延時來反映網速.
流量: 效能測試中,一般指單位時間內流經網絡卡的總流量。分為inbound和outbound,一般以KB為單位。
VU(併發壓測使用者數) = TPS(每秒執行事務數) × RT(響應時間)
在尋找合適的併發使用者數上,建議使用PTS(淘寶效能自動化:https://pts.aliyun.com/lite/index.htm?spm=0.0.0.0.8t95Nt)的“梯度模式”,逐漸增加併發使用者數,這個時候壓力也會越來越大,當TPS的增長率小於響應時間的增長率時,這就是效能的拐點,也就是最合理的併發使用者數;當TPS不再增長或者下降時,這個時候的壓力就是最大的壓力,所使用的併發使用者數就是最大的併發使用者數。如果此時的TPS不滿足你的要求,那麼就需要尋找瓶頸來優化。
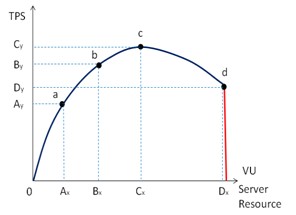
a點:效能期望值
b點:高於期望,系統安全
c點:高於期望,拐點
d點:超過負載,系統崩潰
(二).LoadRunner統計介面效能資料
LoadRunner分成3步:
1. Create/Edit Scripts;
2. Run Load Tests;
3. Analyze Test Results;
第一步:編寫指令碼(GET請求)
新建 New Scrips, 選擇Web(HTTP/HTML)協議,因為不是對頁面測試,無需記錄操作,在“Start Recording”彈窗中,選擇Cancel。
手動編寫指令碼:
Action()
{
    web_set_max_html_param_len("10240");

    // 關鍵詞Text的value值為在請求返回的結果中搜尋的字串
    // 關鍵詞SaveCount的value值為在結果中找到Text文字內容的個數
    web_reg_find("Text={\"statuses\":",
             "SaveCount=Count",
              LAST);


    // 自定義事務unread_friends_timeline_reload,起始點
    lr_start_transaction("unread_friends_timeline_reload");
    // basic認證,在頭資訊新增Authorization值,變數authorization引數化
    web_add_header("Authorization","{authorization}");
    // http請求
    web_custom_request("web_custom_request",
        "URL=http://ip:port/2/statuses/unread_friends_timeline.json?source=******",
        "Method=GET",
        "RecContentType=application/json",
        "Mode=HTTP",
        "EncType=application/x-www-form-urlencoded",
        LAST);

    // 判斷結果是否包含預期文字,如果包含,則事務unread_friends_timeline_reload狀態為LR_PASS
   if (atoi(lr_eval_string("{Count}")) == 1){

        lr_end_transaction("unread_friends_timeline_reload", LR_PASS);

        }

    else{

         lr_error_message("error=%s","errorContent");

         lr_end_transaction("unread_friends_timeline_reload", LR_FAIL);

         }

return 0;

}
按“F5”鍵執行指令碼,Replay Log輸出如下:
Virtual User Script started at : 2015-10-07 16:58:47
Starting action vuser_init.
Web Turbo Replay of LoadRunner 11.0.0 for WIN2003; build 9409 (Jan 11 2012 11:34:16)    [MsgId: MMSG-27143]
Run Mode: HTML      [MsgId: MMSG-26000]
Run-Time Settings file: "E:\unreadfeed\unreadfeedreload\\default.cfg"   [MsgId: MMSG-27141]
Ending action vuser_init.
Running Vuser...
Starting iteration 1.
Starting action Action.
Action.c(3): web_set_max_html_param_len was successful      [MsgId: MMSG-26392]
Action.c(6): Registering web_reg_find was successful    [MsgId: MMSG-26390]
Action.c(12): Notify: Transaction "unread_friends_timeline_reload" started.
Action.c(15): Warning -26593: The header being added may cause unpredictable results when applied to all ensuing URLs. It is added anyway   [MsgId: MWAR-26593]
Action.c(15): web_add_header("Authorization") highest severity level was "warning"      [MsgId: MMSG-26391]
Action.c(16): Registered web_reg_find successful for "Text={"statuses":" (count=1)      [MsgId: MMSG-26364]
Action.c(16): web_custom_request("web_custom_request") was successful, 91858 body bytes, 198 header bytes   [MsgId: MMSG-26386]
Action.c(26): Notify: Transaction "unread_friends_timeline_reload" ended with "Pass" status (Duration: 0.8905 Wasted Time: 0.6256).
Ending action Action.
Ending iteration 1.
Ending Vuser...
Starting action vuser_end.
Ending action vuser_end.
Vuser Terminated.
Action.c(26): Notify: Transaction “unread_friends_timeline_reload” ended with “Pass” status (Duration: 0.8905 Wasted Time: 0.6256). 表示指令碼除錯通過。
模擬POST請求:
web_custom_request中引數設定:”Method=POST”,“Body=屬性名稱=屬性值&屬性名稱=屬性值&……”,web_custom_request中Body中的屬性值如果包含一些特殊字元,必須通過URL編碼,否則Web伺服器會返回500錯誤。
例子:
web_custom_request("web_custom_request",
        "URL=http://ip/2/statuses/update.json",
        "Method=POST",
        "RecContentType=application/json",
        "Mode=HTTP",
        "EncType=application/x-www-form-urlencoded",
        "Body=status=123&source=********",
        LAST);
第二步: Run Load Tests
自定義指令碼之後,執行第二步,Run Load Tests, 彈出New Scenario小視窗,左下選擇測試指令碼,進入場景設計。
場景設定主要包括4部分,選擇Global Schedule->Edit Action設定場景:
1.Initialize: VU初始化設定
2.Start Vusers: 定義多少個VU, 使用者增長選擇
(1)Simultaneously 同時;(2)每隔一定時間,增長使用者
3.Duration: 執行時間設定
4.Stop Vusers: 終止VU的策略
場景設定結束後,點選左下Run, 點選Start Scenario,開始場景效能測試。
點選stop, 終止效能測試; 自動跳到第三步。
第三步: Analyze Test Results
結果展示,會有3份報告
(1)Analysis Summary: Statistics Summary, Transaction Summary,HTTP Responses Summary
(2)Averagee Response Time: Minimum, Average, Maximum, std.Deviation(標準方差), 單位:s
(3)Transactions per Second:Graph Minmum, Average, Graph Maximum, Graph Median, Graph Std. Deviatior
LoadRunner並沒有提供響應時間的分佈情況,只有最小,最大,平均,標準方差,90 Percent,如果需要統計50%,60%,70%,80%,90% RT的分佈情況,需通過LR獲取原始資料,通過Excel公式PERCENTILE計算:
在Averagee Response Time報告下,選擇Windows選單->Raw Data, 右側出現Raw Data, 展開該選項,通過Transaction Name(值為指令碼中自定義的事務名)獲取介面響應時間原始資料Transaction Response Time,貼上到excel中,假設原始資料都在一列(A2-A57),比如要獲得50% RT, 則使用公式=PERCENTILE(A2:A57;0.5)得到結果,依次類推…
(三).業界效能測試工具
PTS:
開源工具:
Gatling is an open-source load testing framework based on
Scala, Akka and Netty
High performance
Ready-to-present HTML reports
Scenario recorder and developer-friendly DSL
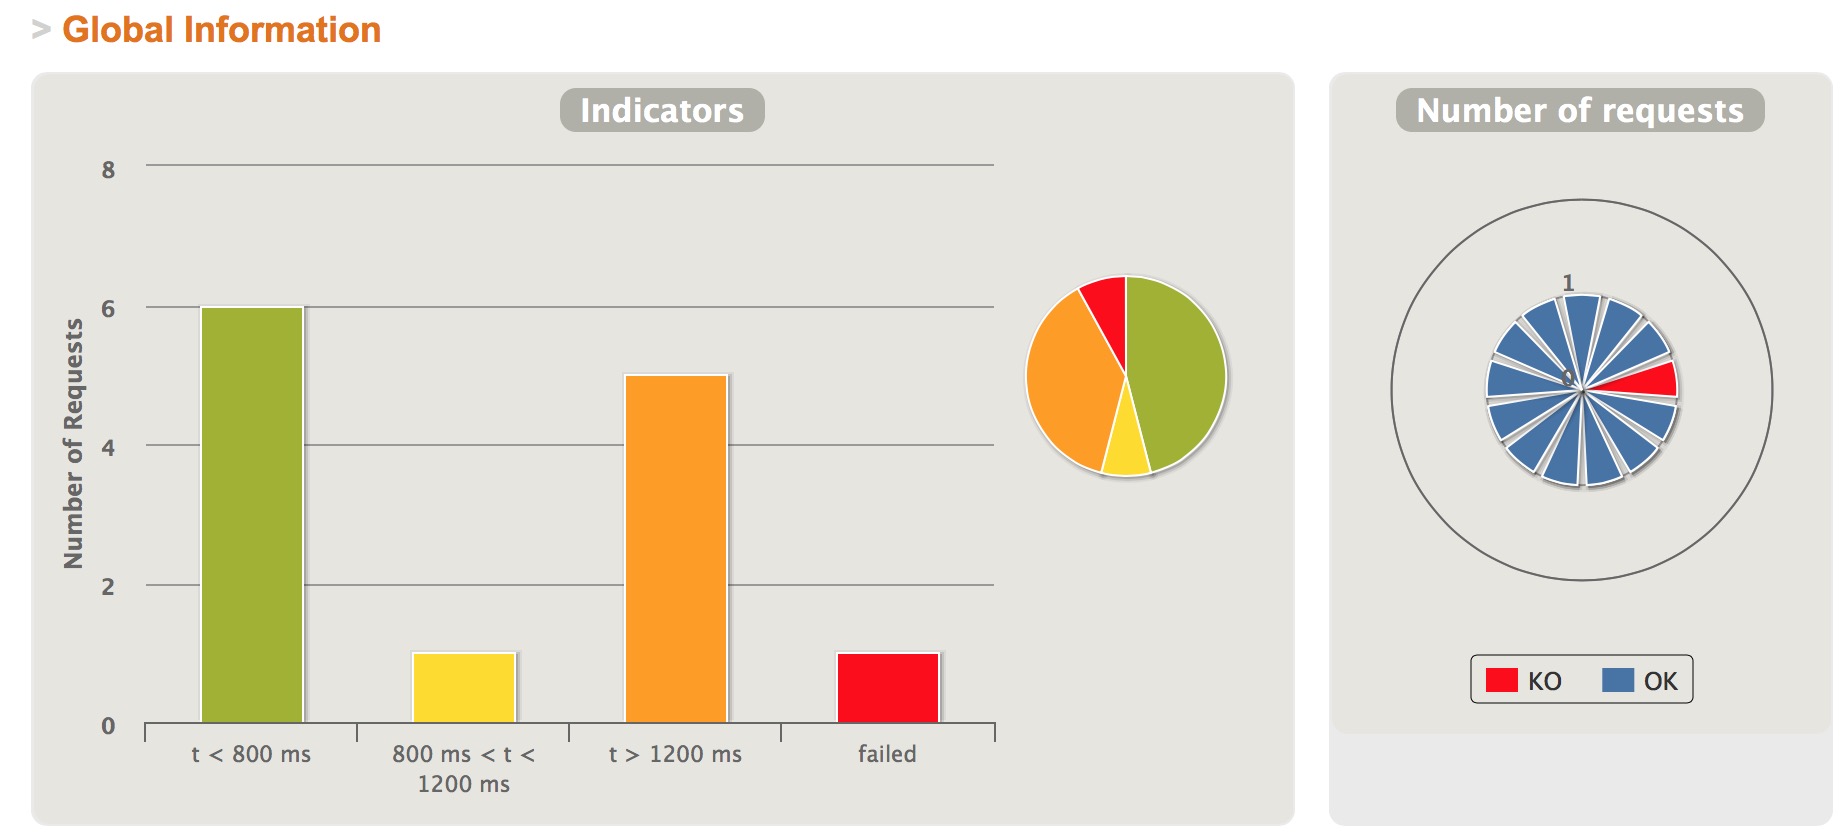
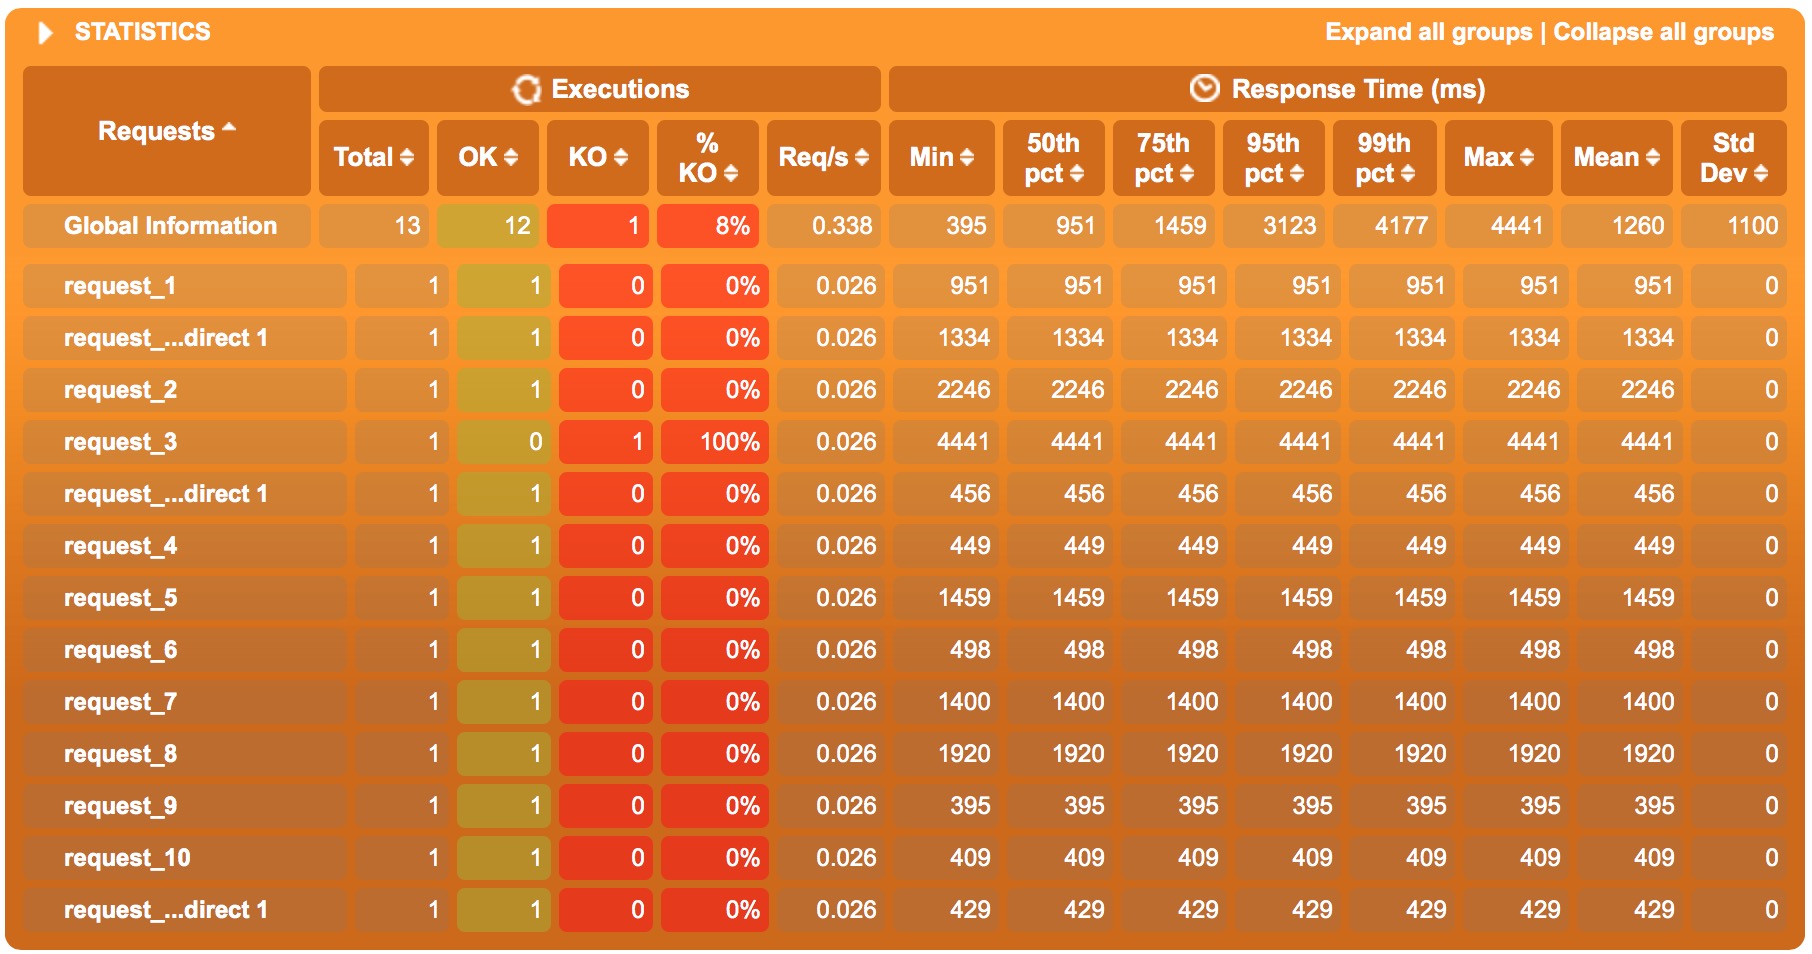
測試指令碼為scala, 短板:沒有TPS資料,優點:結果圖形化展示很清晰。
部分截圖:
nGrinder is a platform for stress tests that enables you to execute script creation, test execution, monitoring, and result report generator simultaneously. The open-source nGrinder offers easy ways to conduct stress tests by eliminating inconveniences and
providing integrated environments.
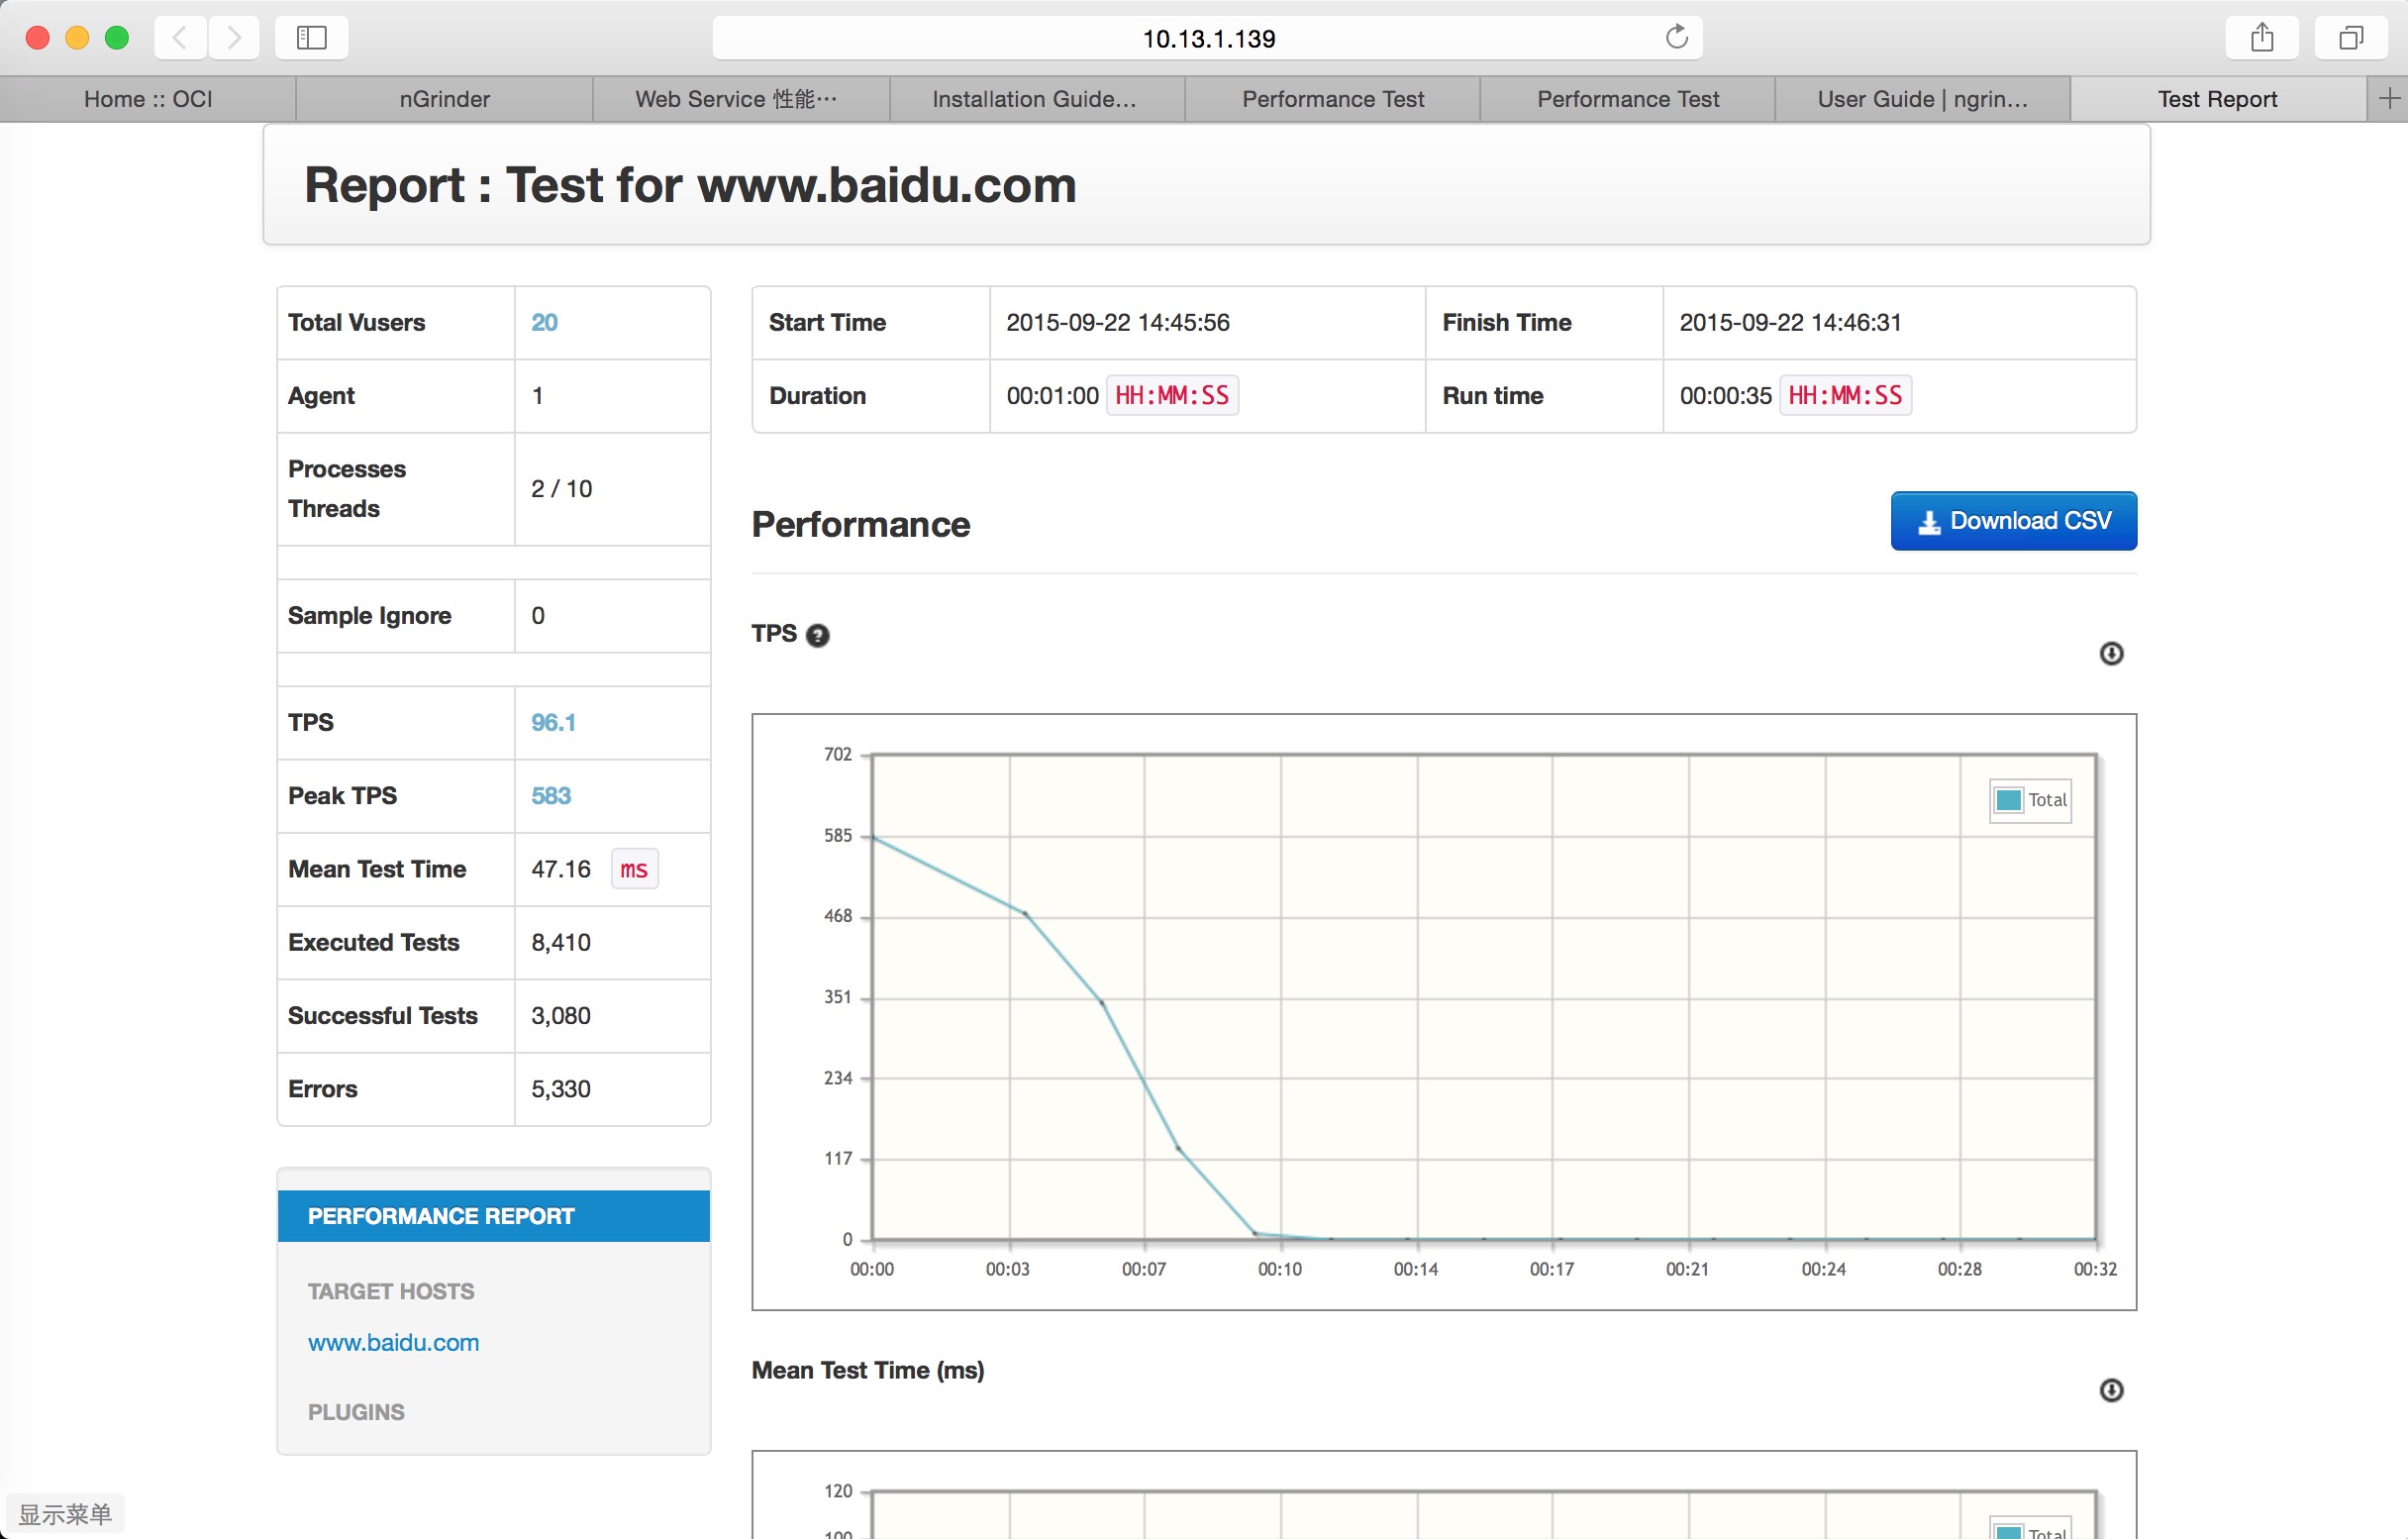
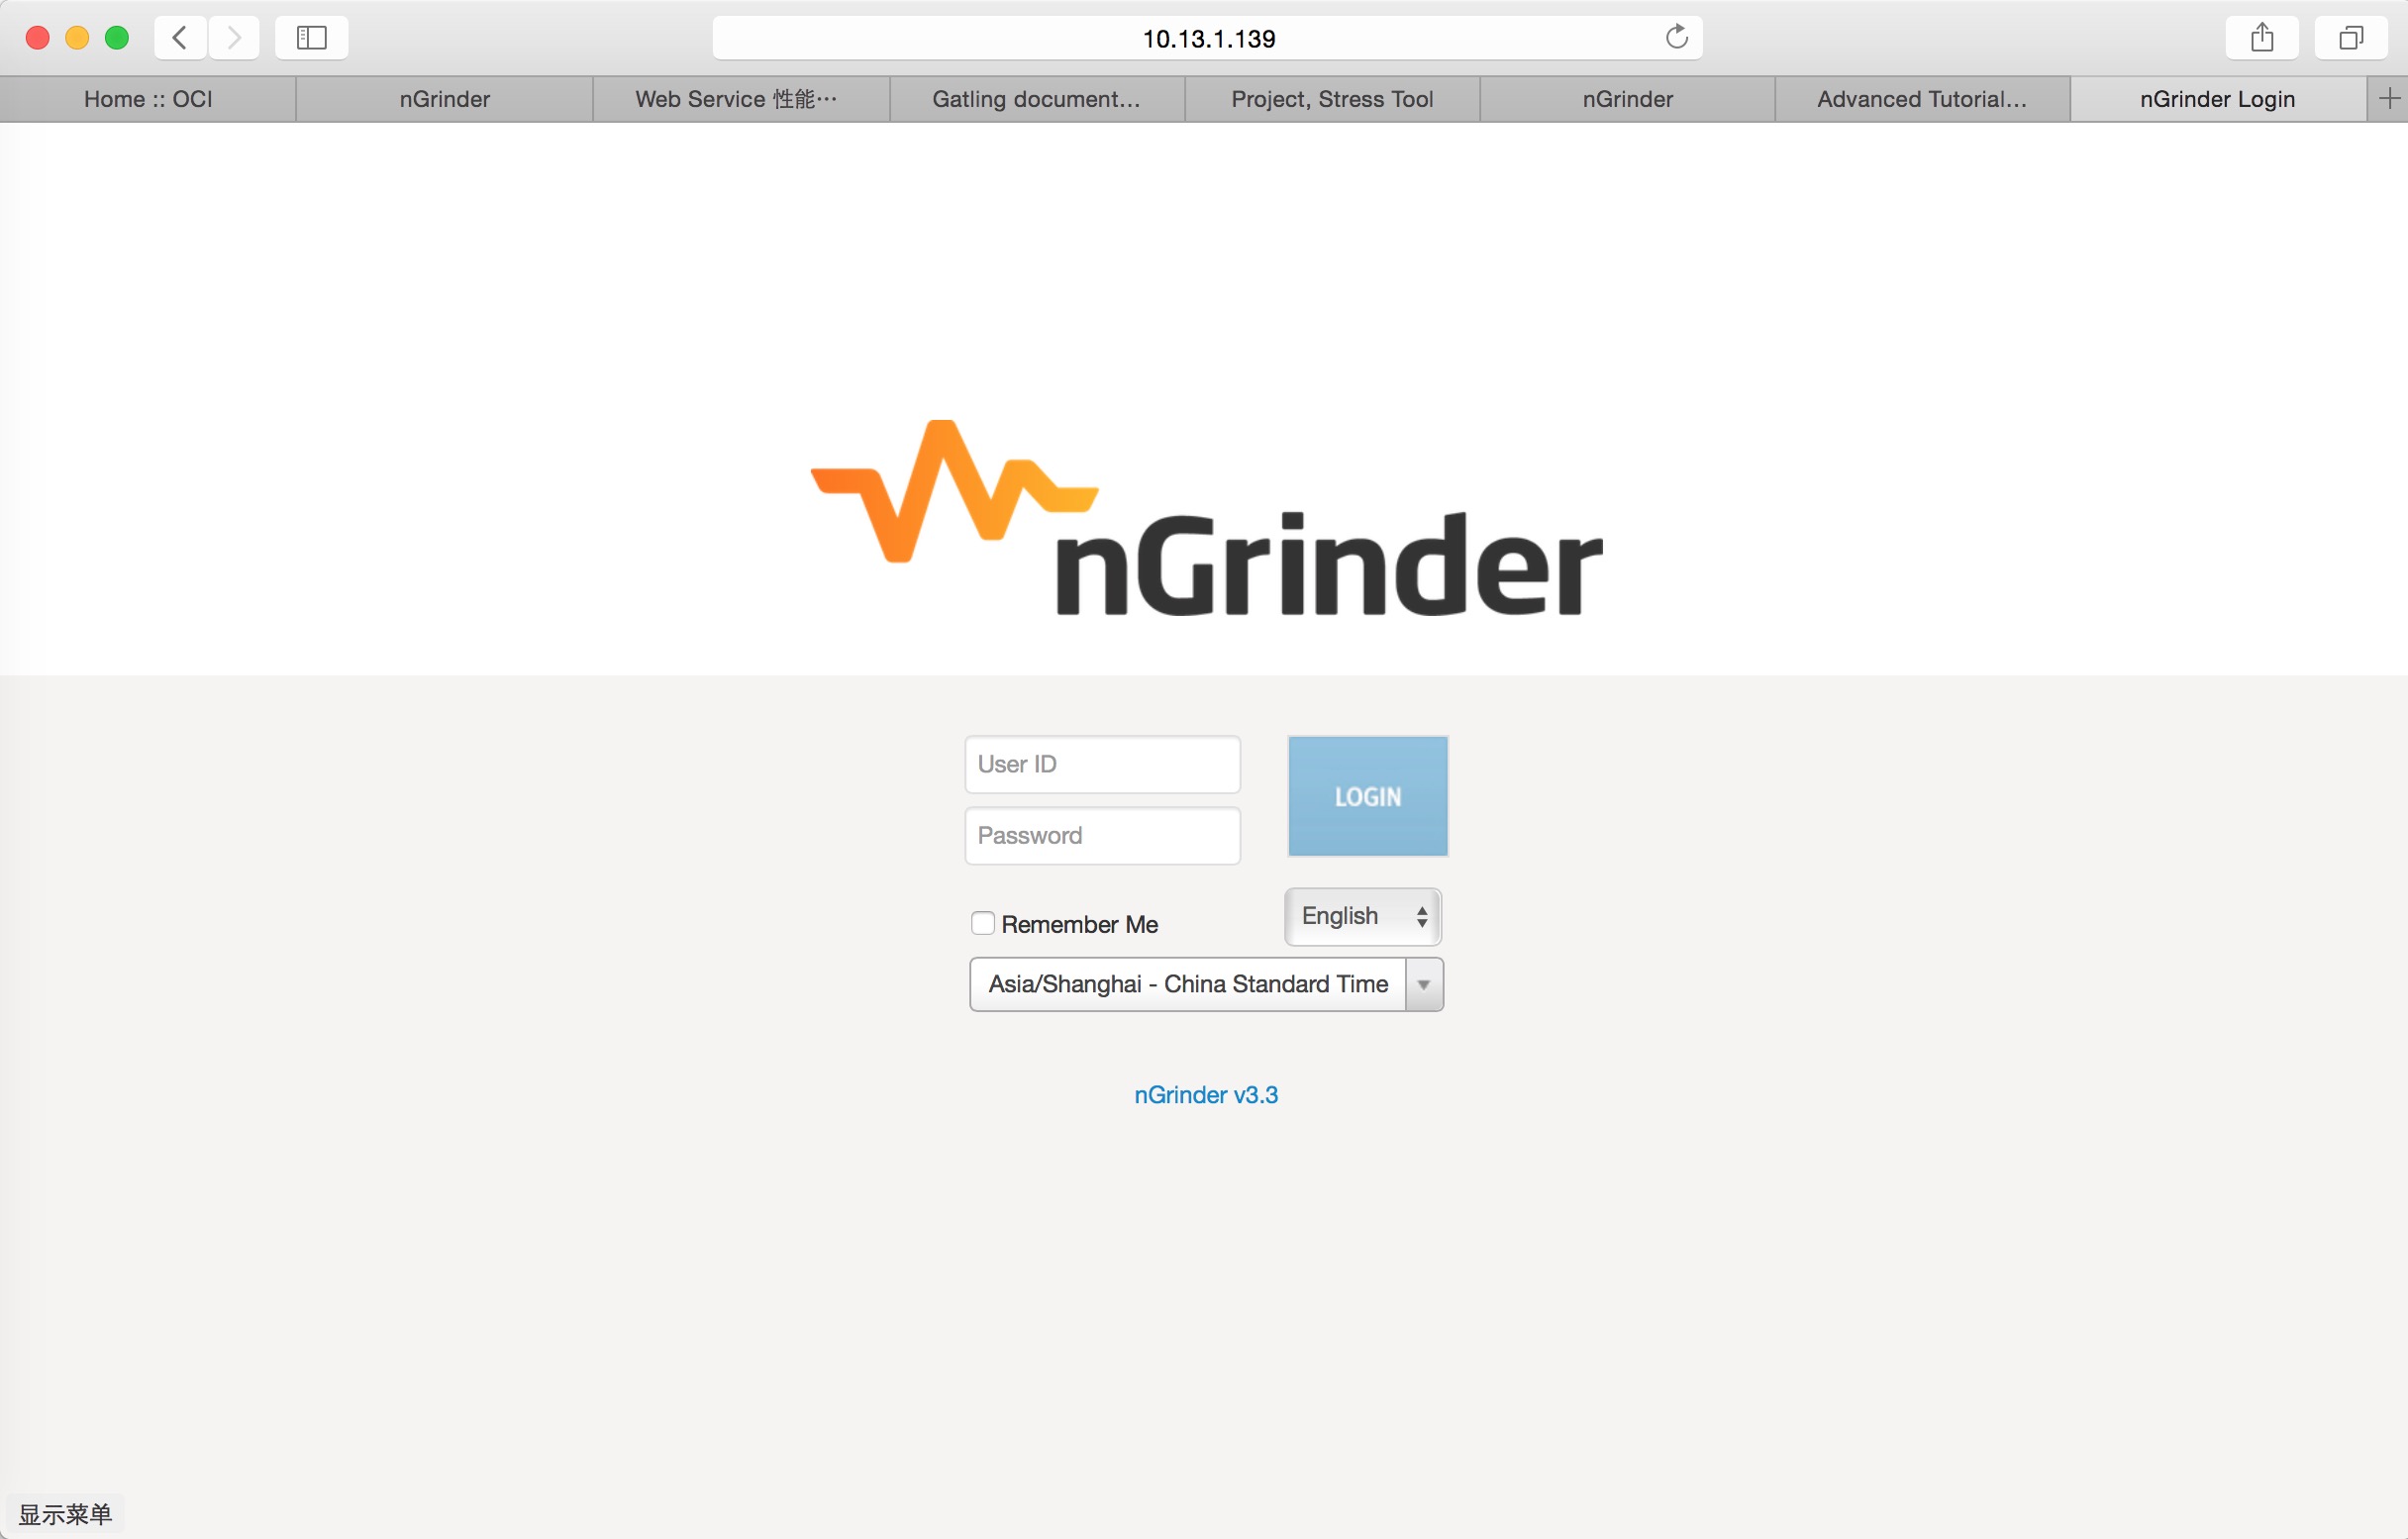
nGrinder是NAVER(韓國最大網際網路公司NHN旗下搜尋引擎網站)開源的效能測試工具,提供war包,直接部個web服務,就能使用。
預設管理員賬號:admin/admin
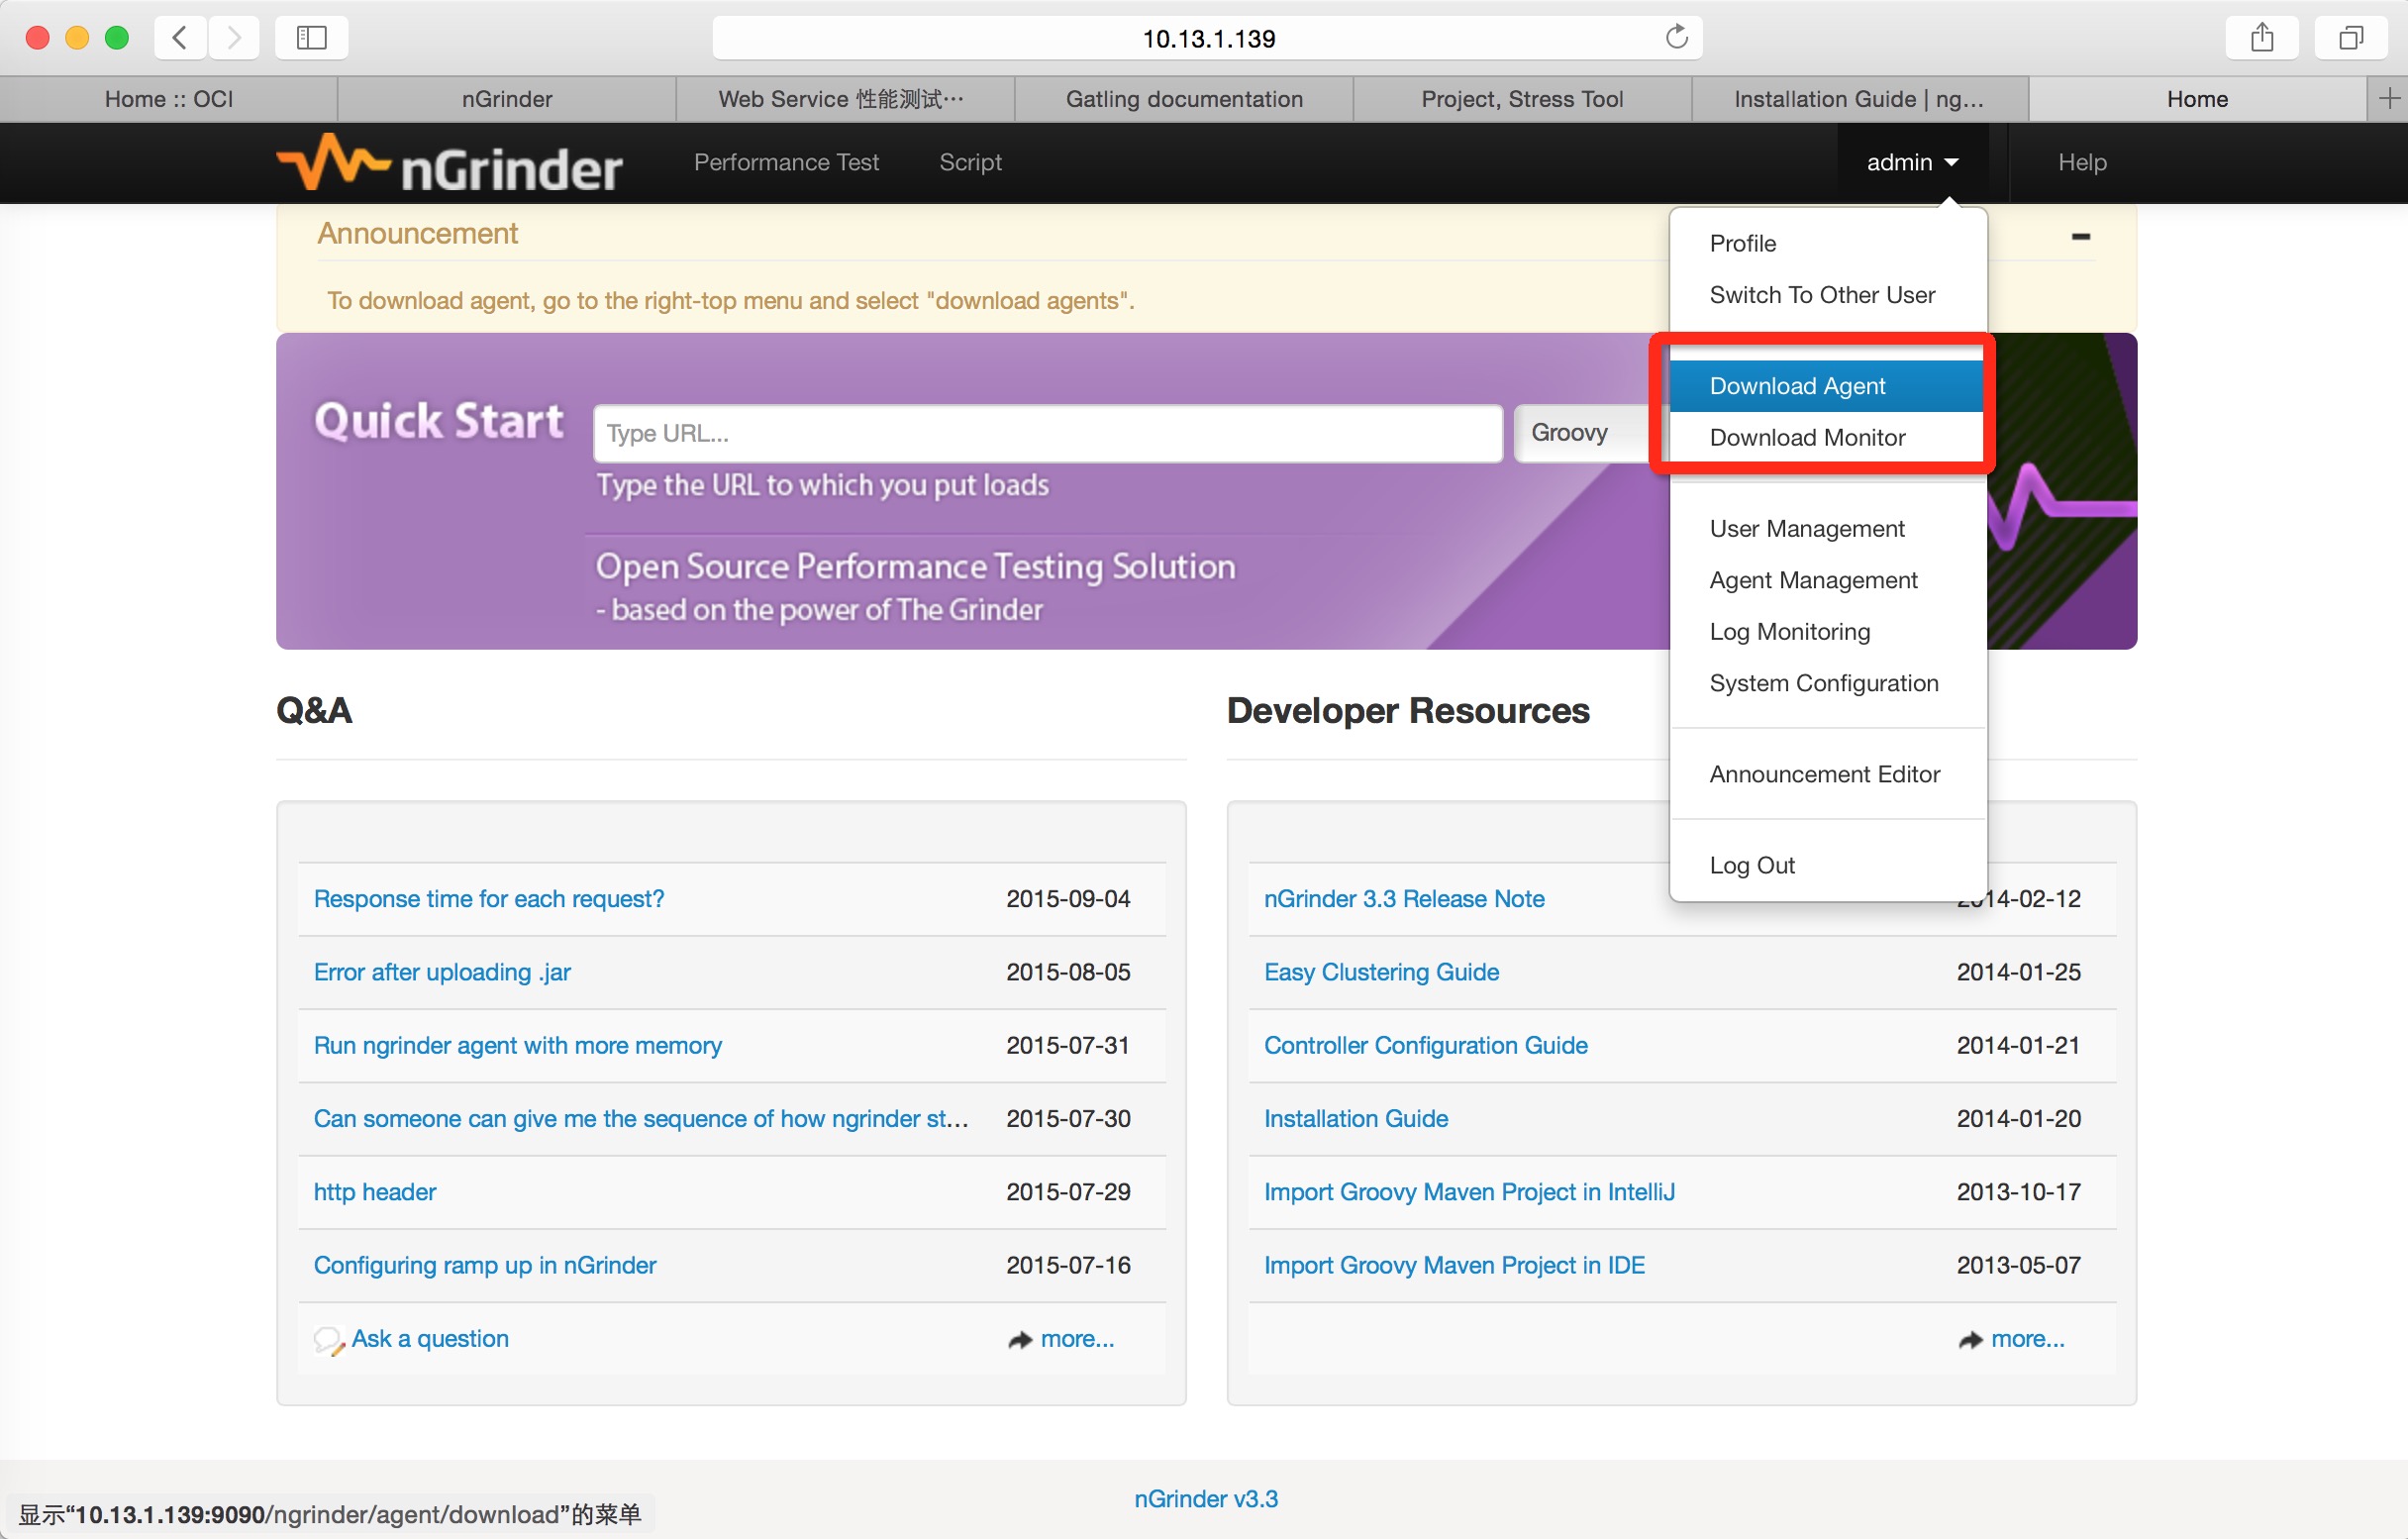
賬號登入後,需要下載agent和monitor(注意下載的agent會有對應的賬號資訊,一個賬號對應唯一的agent,其他賬號登入不能使用其他人的agent,只能使用自己下載的agent):
安裝在測試機上,monitor監控機器效能,agent執行效能測試;測試指令碼為Groovy/Jython,測試指令碼類似JUnit case,自定義了runner: GrinderRunner
package org.ngrinder;
import static net.grinder.script.Grinder.grinder
import static org.junit.Assert.*
import static org.hamcrest.Matchers.*
import net.grinder.plugin.http.HTTPRequest
import net.grinder.plugin.http.HTTPPluginControl;
import net.grinder.script.GTest
import net.grinder.script.Grinder
import net.grinder.scriptengine.groovy.junit.GrinderRunner
import net.grinder.scriptengine.groovy.junit.annotation.BeforeProcess
import net.grinder.scriptengine.groovy.junit.annotation.BeforeThread
// import static net.grinder.util.GrinderUtils.* // You can use this if you're using nGrinder after 3.2.3
import org.junit.Before
import org.junit.BeforeClass
import org.junit.Test
import org.junit.runner.RunWith
import HTTPClient.HTTPResponse
import HTTPClient.NVPair
/**
* A simple example using the HTTP plugin that shows the retrieval of a
* single page via HTTP.
*
* This script is automatically generated by ngrinder.
*
* @author user
*/
@RunWith(GrinderRunner)
class TestRunner {
public static GTest test
public static HTTPRequest request
@BeforeProcess
public static void beforeProcess() {
HTTPPluginControl.getConnectionDefaults().timeout = 6000
test = new GTest(1, "www.baidu.com")
request = new HTTPRequest()
test.record(request);
grinder.logger.info("before process.");
}
@BeforeThread
public void beforeThread() {
grinder.statistics.delayReports=true;
grinder.logger.info("before thread.");
}
@Test
public void test(){
HTTPResponse result = request.GET("http://www.baidu.com")
if (result.statusCode == 301 || result.statusCode == 302) {
grinder.logger.warn("Warning. The response may not be correct. The response code was {}.", result.statusCode);
} else {
assertThat(result.statusCode, is(200));
}
}
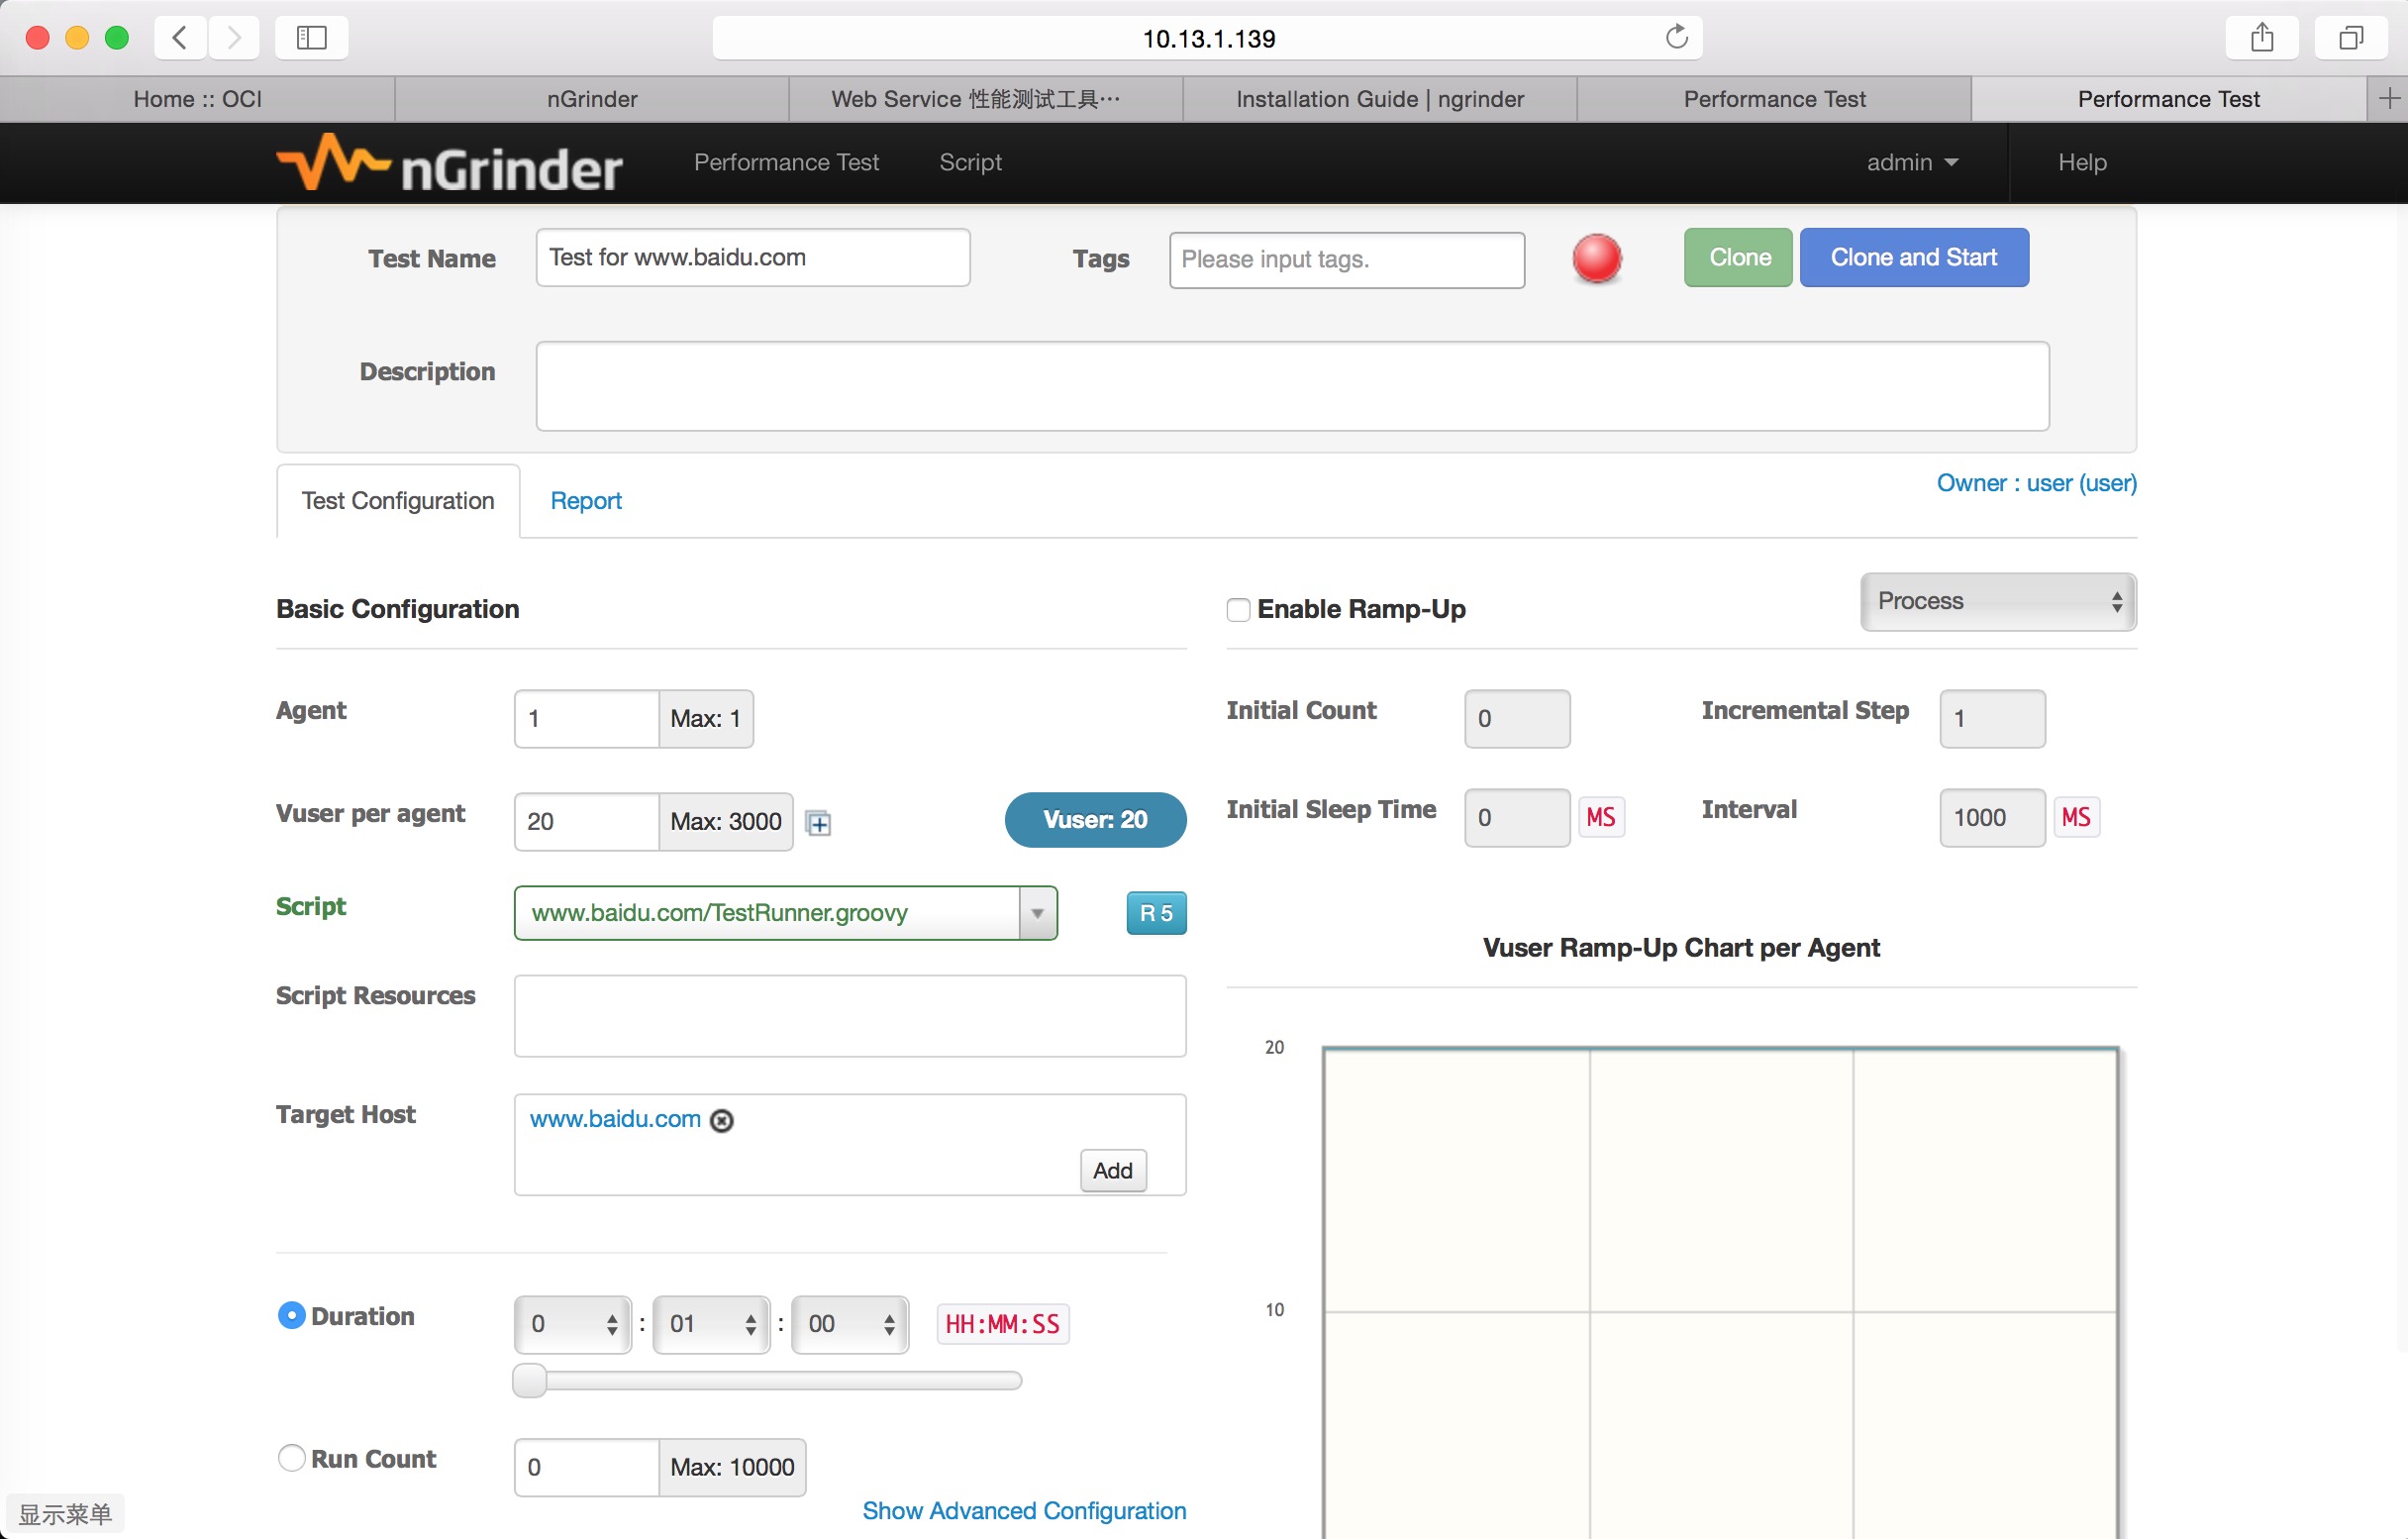
}圖形化設定引數:
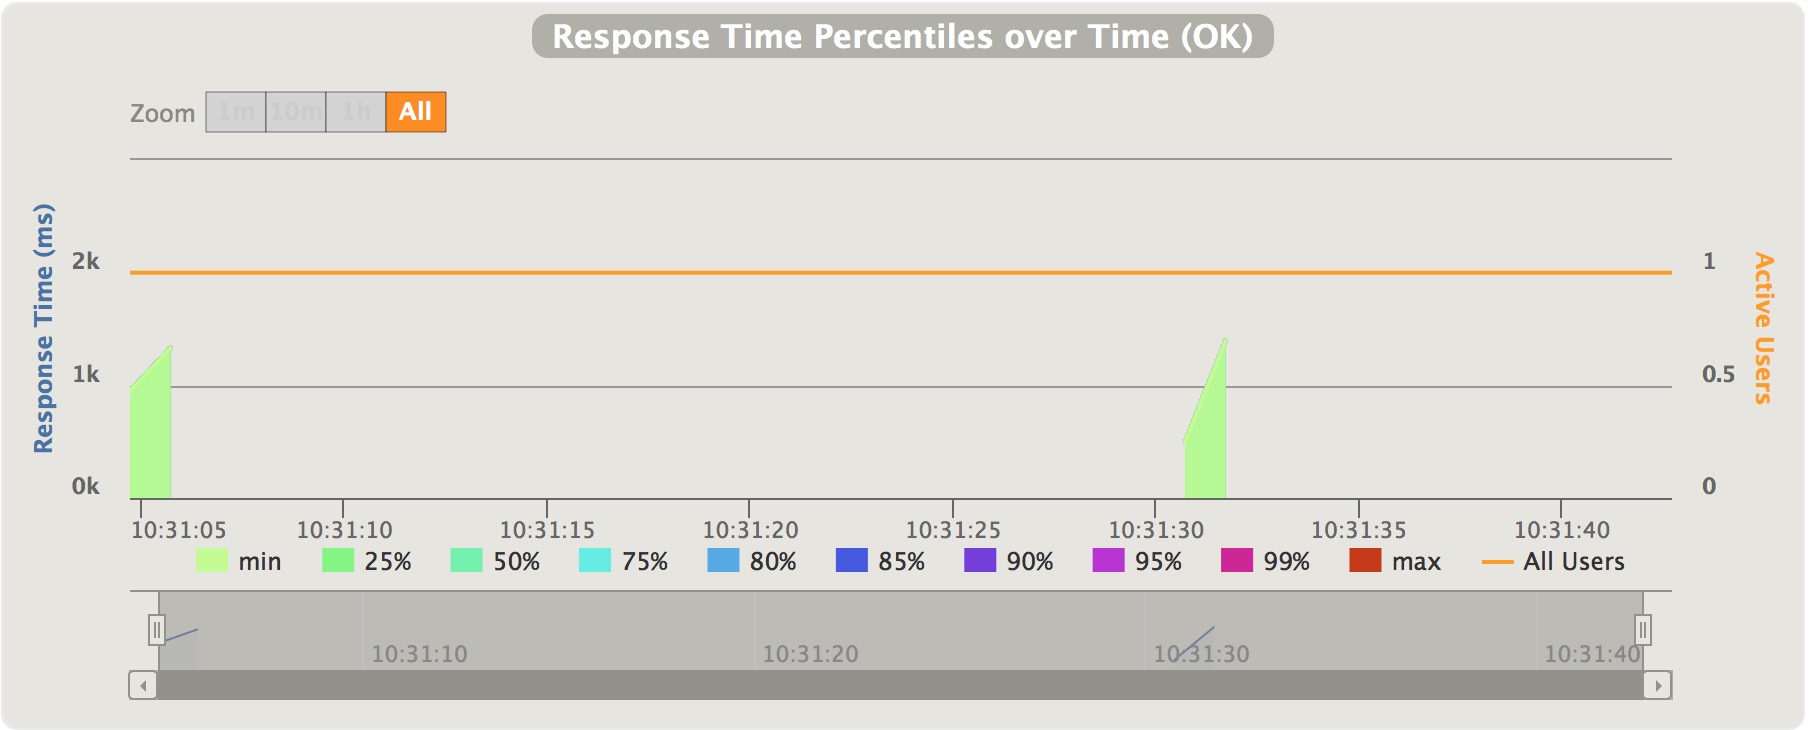
結果顯示: