MATLAB中的顏色控制
1.色圖顏色調配命令
在MATLAB中,控制及實現顏色調配的主要命令為colormap,它的使用格式如下:
呼叫格式 說明
colormap([R G B]) 設定當前色圖為由矩陣[R G B]所調配出的顏色
colormap('default') 設定當前色圖為預設色
cmap = colormap 獲取當前色的調配矩陣
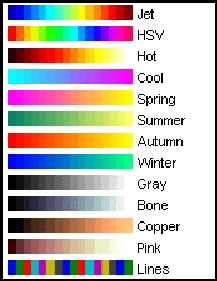
利用調配矩陣來設定顏色是很麻煩的,為了使用方便MATLAB提供了幾種常用的色圖,具體如下:
例:對山峰函式二維等值線圖進行顏色控制
>> close all
>> Z = peaks;
>> contourf(Z,10)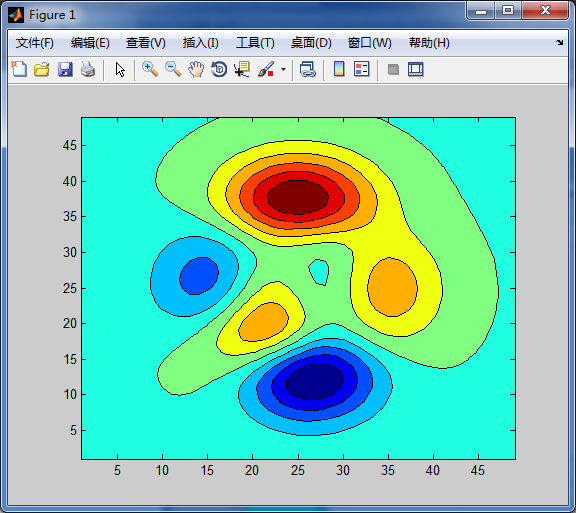
>> colormap hsv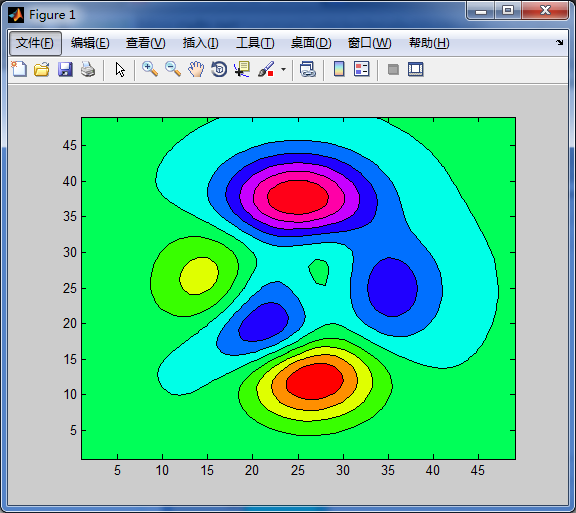
>> colormap copper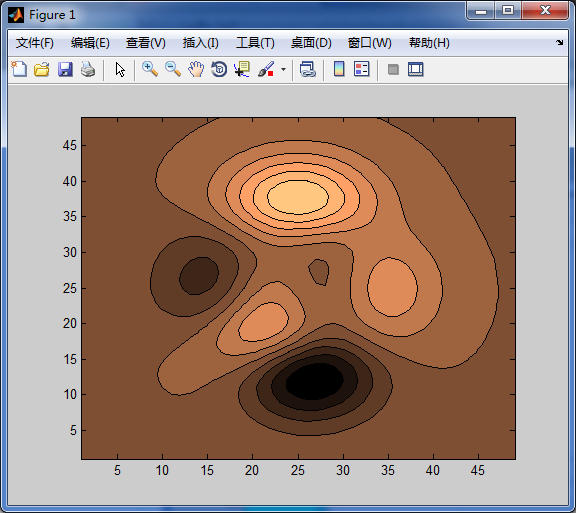
>> colormap prism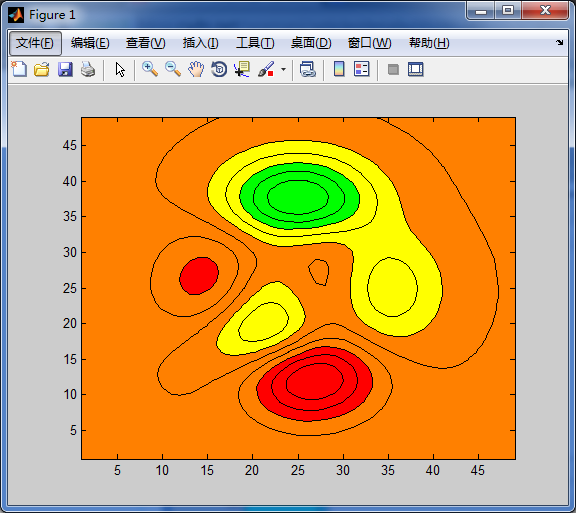
>> colormap gray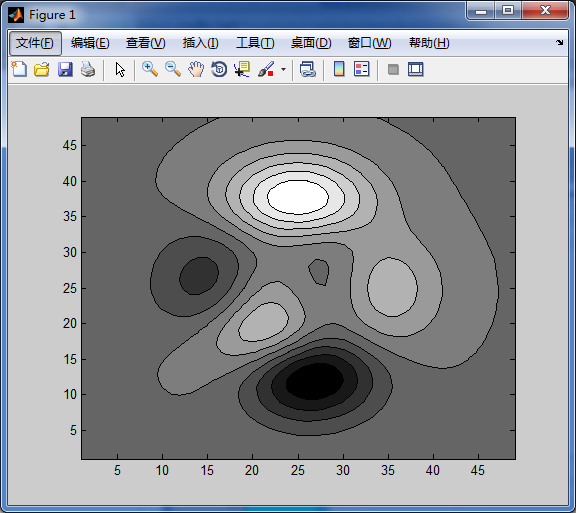
2.色圖明暗控制命令
MATLAB中,控制色圖明暗的命令是brighten命令,它的使用格式如下:
呼叫格式 說明
brighten(beta) 增強或減小色圖的色彩強度,若0<beta<1,則增加色圖;若-1<beta<0,則減小色圖強度
brighten(h,beta) 增加或減小控制代碼h指向的物件的色彩強度
newmap = brighten(beta) 返回一個比當前色圖增加或減弱的新的色圖
newmap = brighten(cmap,beta) 該命令並未改變指定色圖cmap的亮度,而是返回變化後的色圖給newmap
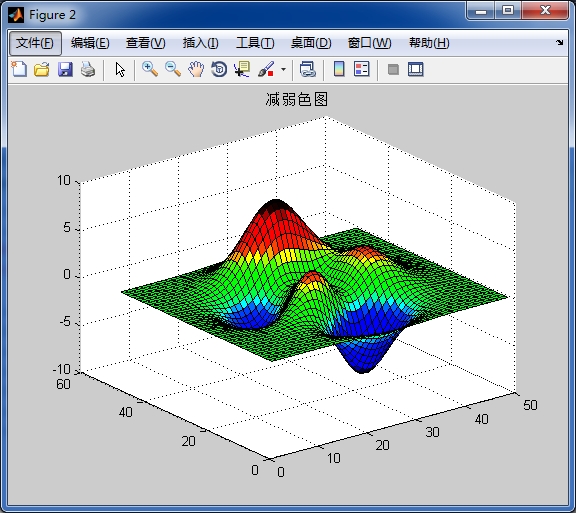
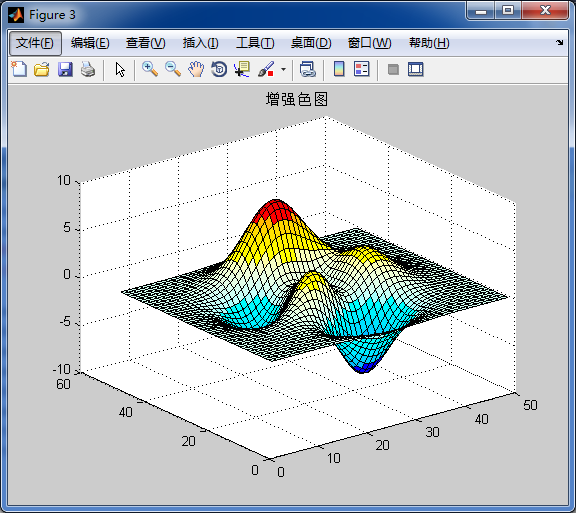
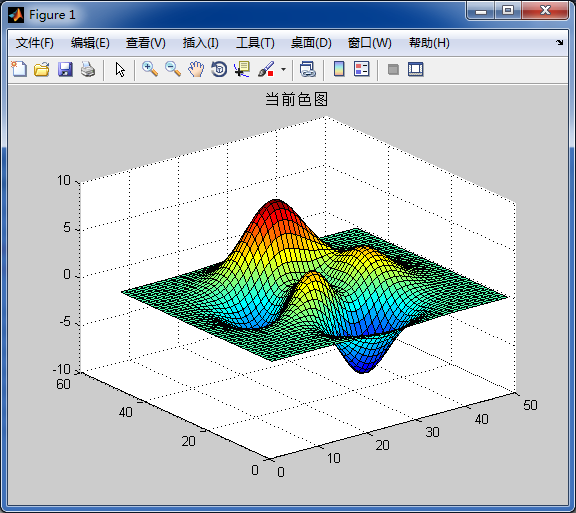
例:觀察山峰函式的三種不種不同色圖下的影象
>> h1 = figure;
>> surf(peaks),title('當前色圖')
>> h2 = figure;
>> surf(peaks),brighten(-0.85)
>> title('減弱色圖')
>> h3 = figure;
>> surf(peaks),brighten(0.85)
>> title('增強色圖')
>> 
3.色軸刻度
caxis命令控制著對應色圖的資料值的對映圖。它通過將被變址的顏色資料(CData)與顏色資料對映(CDataMapping)設定為scaled,影響著任何的表面、塊、影象;該命令還可以改變座標軸圖形物件的屬性Clim與ClimMode。
caxis命令的使用格式如下:
呼叫格式 說明
caxis([cmin cmax]) 將顏色的刻度範圍設定為[cmin cmax]。資料值中小於cmin或大於cmax的,將分別對映於cmin與cmax;處於cmin與cmax
之間的資料將線性地對映於當前色圖
caxis auto 讓系統自動地計算資料的最大值與最小值對應的顏色範圍,這是系統的預設狀態。資料中的Inf對應於最大顏色值;-Inf對應
於最小顏色值;帶顏色值設定為NaN的面或者邊界將不顯示
caxis manual 凍結當前顏色座標軸的刻度範圍。這樣,當hold設定為on時,可使後面的圖形命令使用相同的顏色範圍
caxis(caxis) 同上
v = caxis 返回一包含當前正在使用的顏色範圍的二維向量v = [cmin cmax]
caxis(axes_handle,...) 使用參量axis_handle指定的座標軸,而非當前座標軸
例:建立一個球面,並將其頂端對映為顏色表裡的最高值。
>> close all
>> [X,Y,Z] = sphere;
>> C = Z;
>> subplot(1,2,1)
>> surf(X,Y,Z,C)
>> title('圖1')
>> subplot(1,2,2)
>> surf(X,Y,Z,C),caxis([-1 0])
>> title('圖2')
>>
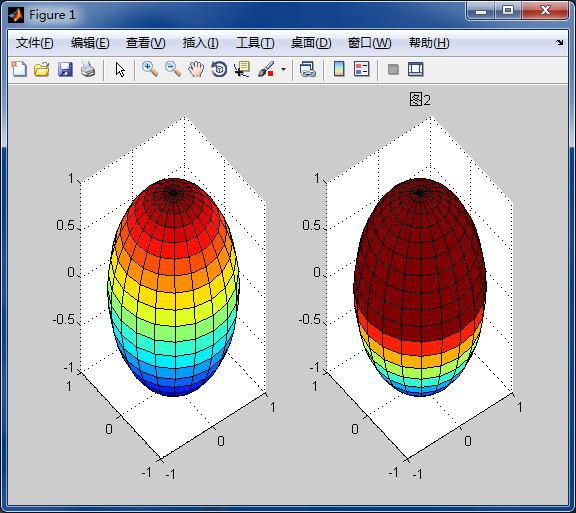
將[-1 0]對映到整個色圖範圍,所以球面中[0 1]的部分就對映成0部分的顏色
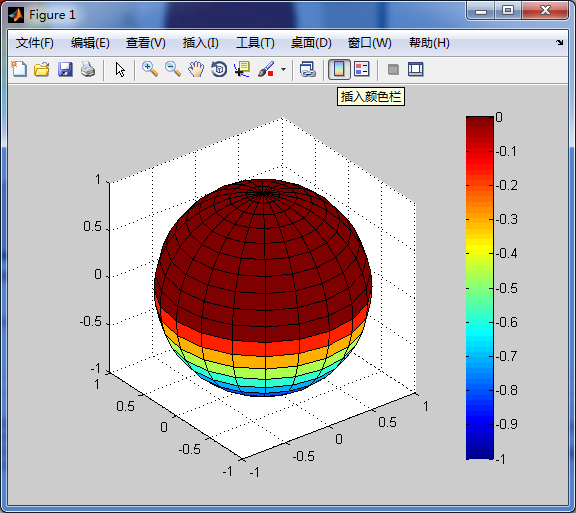
在MATLAB中,還有一個畫色軸的命令colorbar,這個命令在圖形視窗的工具欄中有相應的圖示。它在命令視窗的使用格式如下:
呼叫格式 說明
colorbar 在當前圖形視窗中顯示當前色軸
colorbar(‘vert') 增加一個垂直色軸
colorbar('horiz’) 增加一個水平色軸
colorbar(h) 在h指定的位置旋轉一個色軸,若圖形寬度大於高度,則將色軸水平放置
h = colorbar(...) 返回一個指向色軸的控制代碼
>> close all
>> [X,Y,Z] = sphere;
>> C = Z;
>> surf(X,Y,Z,C),caxis([-1 0])
>> axis square
>> colorbar('vert')
>> close all
>> [X,Y,Z] = sphere;
>> C = Z;
>> surf(X,Y,Z,C),caxis([-1 0])
>> axis square
>> colorbar('vert')
4.顏色渲染設定
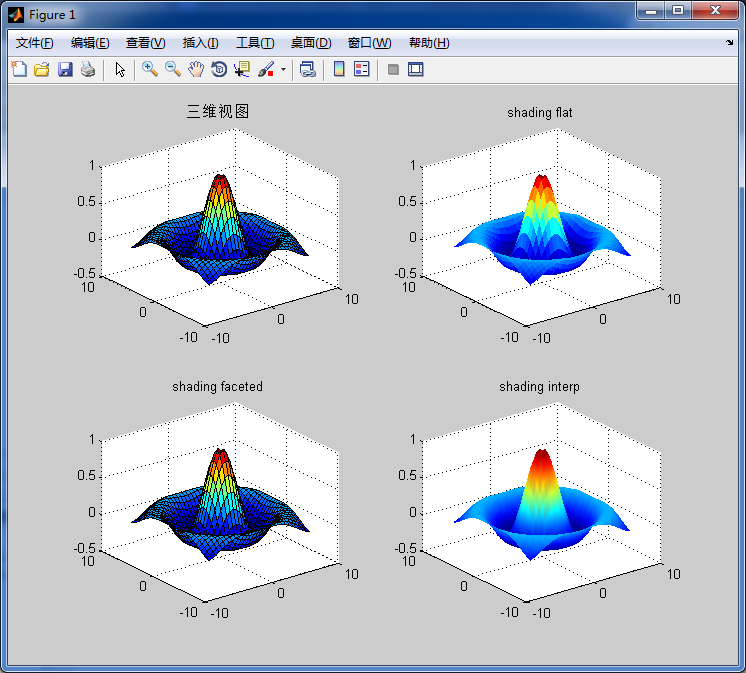
shading命令用來控制曲面與補片等的圖形物件的顏色渲染,同時設定當前座標軸中的所有曲面與補片圖形物件的屬性EdgeColor與FaceColor。
shading命令的使用格式如下:
shading flat each mesh line segment and face has aconstant color determined by the color value at the endpoint of the segment or the corner of the face that has the smallest index or indices.
shading faceted flat shading with superimposed black meshlines. This is the default shading mode.
shading interp varies the color in each line segment andface by interpolating the colormap index or true color value across the line orface.
shading(axes_handle,...) applies the shading type to theobjects in the axes specified by axes_handle, instead of the current axes. Usequoted strings when using a function form.
例:針對下面的函式比較上面三種使用格式得出圖形的不同。>> [X,Y] = meshgrid(-7.5:0.5:7.5);
>> Z = sin(sqrt(X.^2+Y.^2))./sqrt(X.^2+Y.^2);
>> subplot(2,2,1)
>> surf(X,Y,Z),title('三維檢視')
>> subplot(2,2,2),surf(X,Y,Z),shading flat
>> title('shading flat')
>> subplot(2,2,3),surf(X,Y,Z),shading faceted
>> title('shading faceted')
>> subplot(2,2,4),surf(X,Y,Z),shading interp
>> title('shading interp')
>> 