基於Tornado搭建Raspberry Pi監控平臺
在《Tornado - 基於Python的Web伺服器框架》講到一個性能很不錯的python的web伺服器框架tornado,現在就使用它在樹莓派開發板上搭建一個簡單地監控開發板狀態網站。
這裡先給出這個小專案的檔案目錄總體結構:
hardware資料夾是對開發板進行操作的硬體層
static是專案中用到的靜態檔案,如這裡用到了bootstrap和echarts框架等
templates是html模板頁,用於編寫頁面
專案根目錄下的index.py是對應於templates/index.html檔案的指令碼,用於執行動態操作。
-----------------------------------------------------------------------------------------------------------------------------
1. 專案開始,先建立index.py檔案和相關目錄檔案:
index.py檔案內容如下:
這裡建立了一個handler,用於處理頁面的Get、Post請求,在post請求根據請求引數的不一樣,執行對應的操作。在“#!/usr/bin/env python # coding=utf-8 import os.path import tornado.httpserver import tornado.ioloop import tornado.options import tornado.web from hardware import board_ctrl from tornado.options import define, options define("port", default=8000, help="run on the given port", type=int) class IndexHandler(tornado.web.RequestHandler): def get(self): self.render('index.html', cpu_temperature="%s°C" % board_ctrl.get_cpu_temp()) def post(self): board_ctrl.init_gpio() arg = self.get_argument('k') if (arg == 'w'): print 'press w' if (arg == 'o'): board_ctrl.open_light() self.write(arg) if (arg == 'c'): board_ctrl.close_light() self.write(arg) if (arg == 't'): board_ctrl.get_cpu_temperature() self.write(arg) if (arg == 'p'): self.write(str(board_ctrl.get_cpu_temp())) if __name__ == "__main__": tornado.options.parse_command_line() app = tornado.web.Application( handlers=[(r'/', IndexHandler)], template_path=os.path.join(os.path.dirname(__file__), "templates"), static_path=os.path.join(os.path.dirname(__file__), "static"), debug=True ) http_server = tornado.httpserver.HTTPServer(app) http_server.listen(options.port) tornado.ioloop.IOLoop.instance().start()
self.render('index.html', cpu_temperature="%s°C" % board_ctrl.get_cpu_temp())2. 編寫index.html頁面檔案:
<!DOCTYPE html>
<html>
    <head>
        <title>Raspberry Pi Remote Control</title>
        <meta charset="utf-8"/>
        <script src="{{static_url('js/jquery.min.js')}}"></script>
        <script src="{{static_url('js/echarts.min.js')}}"></script>
        <script src="{{static_url('js/bootstrap.min.js')}}"></script>
        <link rel="stylesheet" type="text/css" href="{{static_url('css/bootstrap.min.css')}}">
	    <script type="text/javascript">
	        $(document).ready(function(){
	            setInterval("refresh_time()", 1000);
	            setInterval("refresh_cpu_temp()", 3000);

                //初始化echarts例項
                var myChart = echarts.init(document.getElementById('cpu_tem'));

                var colors = ['#5793f3', '#d14a61', '#675bba'];


                option = {
                    color: colors,

                    tooltip: {
                        trigger: 'none',
                        axisPointer: {
                            type: 'cross'
                        }
                    },
                    legend: {
                        data:['CPU溫度', 'GPU溫度']
                    },
                    grid: {
                        top: 70,
                        bottom: 50
                    },
                    xAxis: [
                        {
                            type: 'category',
                            axisTick: {
                                alignWithLabel: true
                            },
                            axisLine: {
                                onZero: false,
                                lineStyle: {
                                    color: colors[1]
                                }
                            },
                            axisPointer: {
                                label: {
                                    formatter: function (params) {
                                        return '溫度  ' + params.value + ':' + params.seriesData[0].data;
                                    }
                                }
                            },
                            data: ["20:05", "20:10", "20:15", "20:20", "20:25", "20:30", "20:35", "20:40", "20:45", "20:50", "20:55", "21:00"]
                        },
                        {
                            type: 'category',
                            axisTick: {
                                alignWithLabel: true
                            },
                            axisLine: {
                                onZero: false,
                                lineStyle: {
                                    color: colors[0]
                                }
                            },
                            axisPointer: {
                                label: {
                                    formatter: function (params) {
                                        return '溫度  ' + params.value + ':' + params.seriesData[0].data;
                                    }
                                }
                            },
                            data: ["20:05", "20:10", "20:15", "20:20", "20:25", "20:30", "20:35", "20:40", "20:45", "20:50", "20:55", "21:00"]
                        }
                    ],
                    yAxis: [
                        {
                            type: 'value'
                        }
                    ],
                    series: [
                        {
                            name:'CPU溫度',
                            type:'line',
                            xAxisIndex: 1,
                            smooth: true,
                            data: [31.6, 31.9, 39.0, 36.4, 38.7, 30.7, 30.6, 32.2, 38.7, 38.8, 32.0, 32.3]
                        },
                        {
                            name:'GPU溫度',
                            type:'line',
                            smooth: true,
                            data: [21.6, 21.9, 22.0, 23.4, 22.7, 20.7, 20.6, 22.2, 33.7, 28.8, 22.0, 22.3]
                        }
                    ]
                };

                myChart.setOption(option);

                ////////////////////////////
                //初始化echarts例項
                var cpu_usage = echarts.init(document.getElementById('cpu_usage'));

                option_cpu_usage = {
                    tooltip : {
                        formatter: "{a} <br/>{b} : {c}%"
                    },
                    toolbox: {
                        feature: {
                            restore: {},
                            saveAsImage: {}
                        }
                    },
                    series: [
                        {
                            name: 'CPU負載',
                            type: 'gauge',
                            detail: {formatter:'{value}%'},
                            data: [{value: 2, name: '百分比'}]
                        }
                    ]
                };

                cpu_usage.setOption(option_cpu_usage);
	        });

	        function refresh_time() {
		        $("#nowtime").text((new Date()).toLocaleDateString() + " " + (new Date()).toLocaleTimeString());
	        }

	        function refresh_cpu_temp() {
                $.ajax({
                    url:'/',
                    data:{k:'p'},
                    type:'post',
                    dataType:'text',
                    success:function(msg){
                        $("#cpu").text(msg + "°C");
                    }
                })
	        }
	   </script>
        <style type="text/css">
            .div_left {
                float: left;
                width: 50%;
                height: 400px;
            }
            .div_right {
                float: right;
                width: 50%;
                height: 400px;
            }
        </style>
    </head>

    <body>
        <script type="text/javascript">
            function go(k) {
                $.post('/', {k:k}, function(){});
            }

            $(function(){
                window.document.onkeydown = abc;

                function abc(env) {
                    env = (env) ? env : window.event;

                    if (env.keyCode == '87') {
                        go('w');
                    }
                }
            });

            function open_light() {
                go('o');
            }

            function close_light() {
                go('c');
            }
        </script>

        <center><h1>樹莓派遠端控制</h1><h3>Raspberry Pi Remote Control</h3></center>
    	<center><h3 id="nowtime">--年--月--日 --:--:--</h3></center>
        <div class="panel panel-default">
            <div class="panel-heading"><h3 class="panel-title">終端資訊與控制</h3></div>
            <div class="panel-body"><pre>    顯示樹莓派終端的資訊與進行遠端控制</pre></div>
            <table class="table">
                <tr>
                    <td>CPU實時溫度(重新整理頻率:1秒)</td>
                    <td><text id="cpu">{{ cpu_temperature }}</text></td>
                </tr>

                <tr>
                    <td>房間燈</td>
                    <td>
                        <button type="submit" onclick="open_light();">開燈</button>
                        <button type="submit" onclick="close_light();">關燈</button>
                    </td>
                </tr>
            </table>
        </div>
        <br/>
        <div class="panel panel-primary">
            <div class="panel-heading"><h3 class="panel-title">CPU、GPU溫度曲線</h3></div>
            <div class="panel-body">
                <div class="btn-group">
                    <button type="button" class="btn btn-default dropdown-toggle" data-toggle="dropdown">2017<span class="caret"></span></button>
                    <ul class="dropdown-menu" role="menu">
                        <li>
                            <a href="#">2016</a>
                        </li>
                        <li>
                            <a href="#">2015</a>
                        </li>
                    </ul>
                </div>
                <div id="cpu_tem" class="div_left"></div>
                <div id="cpu_usage" class="div_right"></div>
            </div>
        </div>
    </body>
</html>
3. 編寫硬體層操作hardware/board_ctrl.py:
這裡對IO口的操作還沒實現,只是實現了一個獲取CPU溫度的介面。在樹莓派系統,要對IO口進行操作,需要安裝如下這個庫:
這個庫的使用後面再介紹,現在是搭建監控平臺。
4. 主要檔案都弄好了,現在啟動這個網站:
python index.py
開發板的ip是192.168.31.50,預設啟動的埠是8000 ,瀏覽器開啟這個頁面:
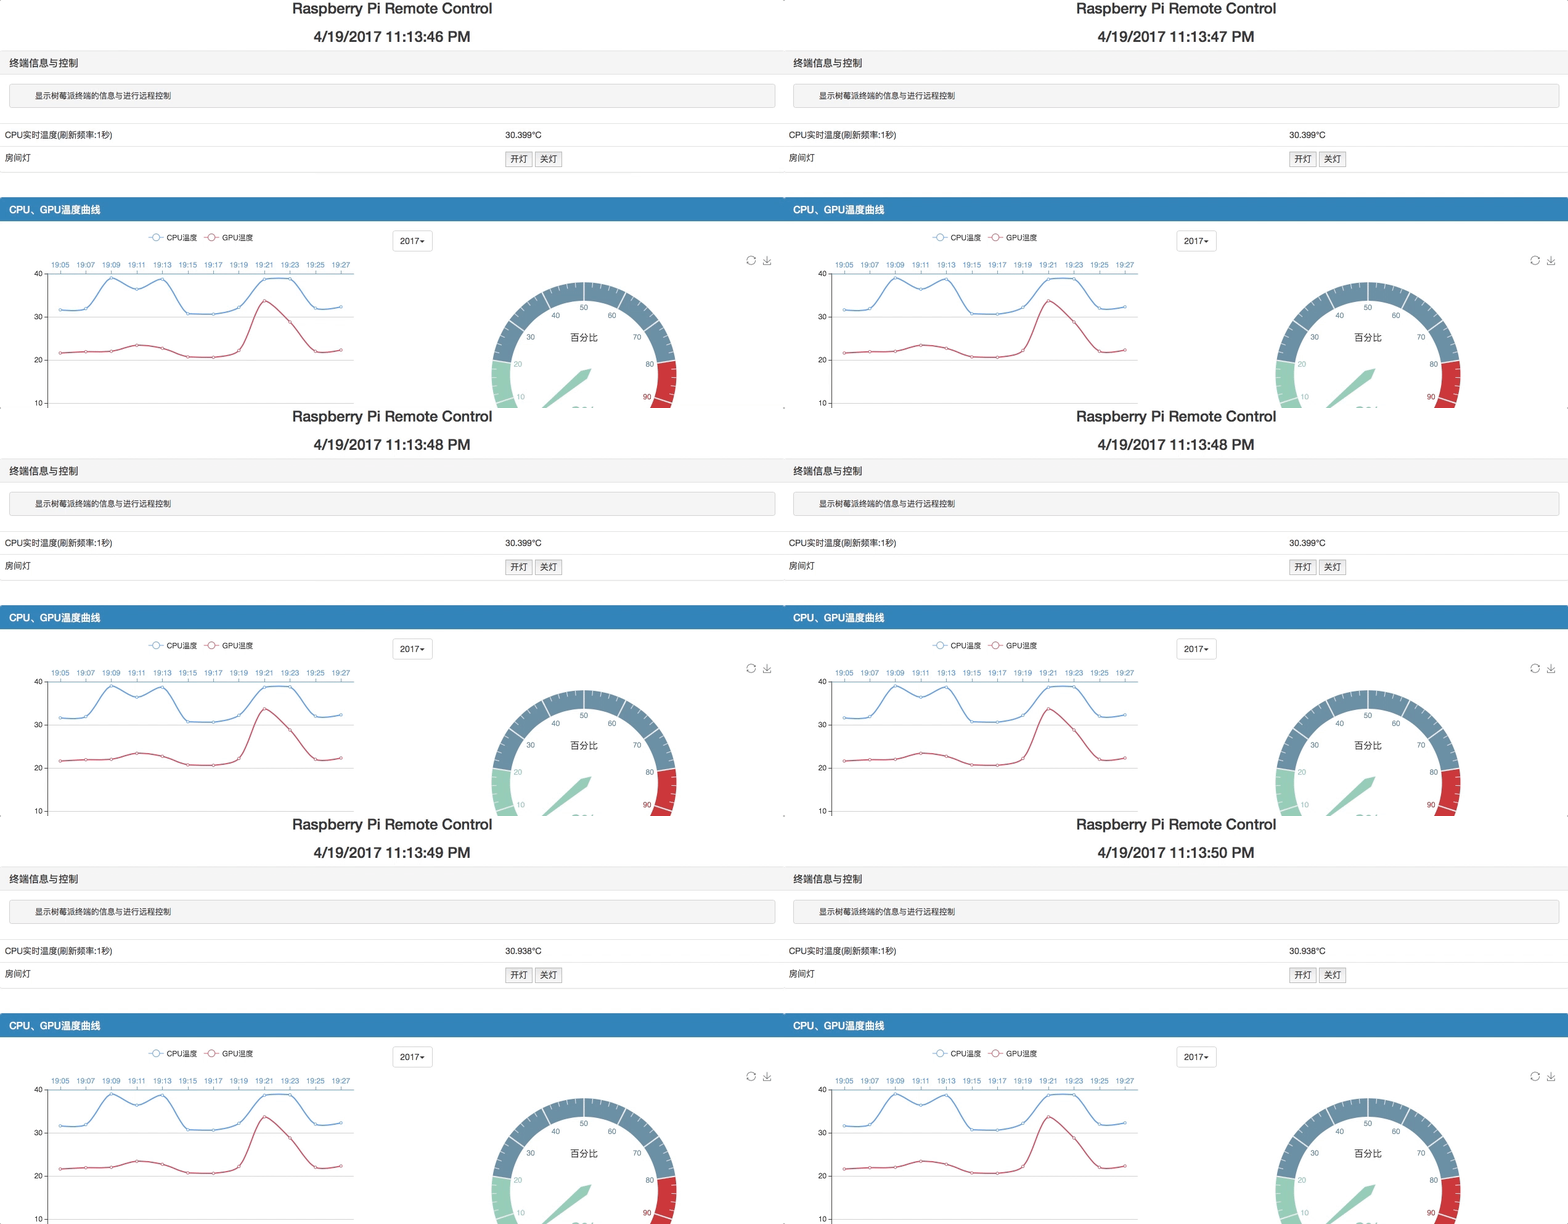
可以看到,CPU的溫度在實時變化,達到我們的要求,後面如果要監控更多引數,實現如CPU持續過高就郵件通知就可以了,現在只是一個我業餘做的一個智慧家居系統雛形,下面的曲線和麵板都是死資料,後面再慢慢修改實現真正的監控了,這裡只搭建好一個基礎框架。
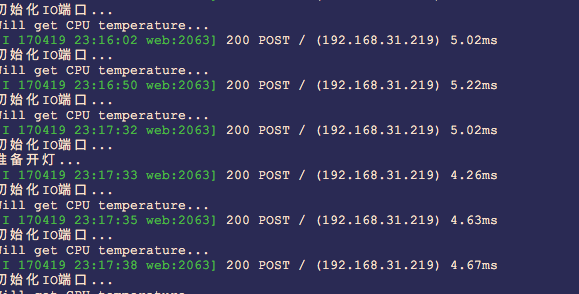
我們點選“開燈”按鈕,可以看到後臺也確實呼叫了對應程式碼,實際的硬體還在畫板,這裡先不弄了,弄好再繼續吧~:


