
ELK (ElasticSearch + Logstash + Kibaba + Marvel)系統的搭建學習與簡單使用
ELK 實時日誌分析系統平臺的學習與使用
- ElasticSearch
- Logstash
- Kibana
- Marvel
- Log
- Linux
簡介
工作工程中,不論是開發還是運維,都會遇到各種各樣的日誌,主要包括系統日誌、應用程式日誌和安全日誌,對於開發人員來說,檢視日誌,可以實時檢視程式的執行錯誤,以及效能分析,通常,一個大中型的應用程式會被部署到多臺伺服器,那日誌檔案也會分散到不同的機器上,這樣檢視日誌難道要一臺一臺去檢視?顯然是太麻煩了,開源的日誌分析系統 ELK 完美的解決了這個問題。
ELK 並不是一個獨立的系統,她是由 ElasticSearch、Logstash、Kibana 三個開源的工具組成。
ElasticSearch
ElasticSearch是一個基於Lucene的搜尋伺服器。它提供了一個分散式多使用者能力的全文搜尋引擎,基於RESTful web介面。Elasticsearch是用Java開發的,並作為Apache許可條款下的開放原始碼釋出,是當前流行的企業級搜尋引擎。設計用於雲端計算中,能夠達到實時搜尋,穩定,可靠,快速,安裝使用方便。
Logstash
Logstash 是一個開源的日誌分析、收集工具,並將日誌儲存以供以後使用。
Kibana
Kibana 是一個為 Logstash 和 ElasticSearch 提供的日誌分析的 Web 介面。可使用它對日誌進行高效的搜尋、視覺化、分析等各種操作。
搭建方法
基於一臺主機的搭建,沒有使用多臺叢集,logstah 收集日誌後直接寫入 elasticseach,可以用 redis 來作為日誌佇列
jdk 安裝
jdk 1.8 安裝
elasticseach 安裝
解壓目錄:
[phachon@localhost elk]$ tar -zxf elasticsearch-2.4.0
[phachon@localhost elasticsearch-2.4.0]$
安裝 head 外掛
[phachon@localhost elasticsearch-2.4.0]$./bin/plugin install mobz/elasticsearch-head
[phachon@localhost elasticsearch-2.4.0]$ ls plugins/
head
編輯 elasticseach 的配置檔案
[phachon@localhost elasticsearch-2.4.0]$ vim config/elasticseach.yml
13# ---------------------------------- Cluster -----------------------------------
14 #
15 # Use a descriptive name for your cluster:
16 #
17  cluster.name: es_cluster #這裡是你的el叢集的名稱
18 #
19 # ------------------------------------ Node ------------------------------------
20 #
21 # Use a descriptive name for the node:
22 #
23  node.name: node0 # elseach 叢集中的節點
24 #
25 # Add custom attributes to the node:
26 #
27 # node.rack: r1
28 #
29 # ----------------------------------- Paths ------------------------------------
30 #
31 # Path to directory where to store the data (separate multiple locations by comma):
32 #
33  path.data: /tmp/elasticseach/data #設定 data 目錄
34 #
35 # Path to log files:
36 #
37  path.logs: /tmp/elasticseach/logs # 設定 logs 目錄
#
39 # ----------------------------------- Memory -----------------------------------
40 #
41 # Lock the memory on startup:
42 #
43 # bootstrap.memory_lock: true
44 #
45 # Make sure that the `ES_HEAP_SIZE` environment variable is set to about half the memory
46 # available on the system and that the owner of the process is allowed to use this limit.
47 #
48 # Elasticsearch performs poorly when the system is swapping the memory.
49 #
50 # ---------------------------------- Network -----------------------------------
51 #
52 # Set the bind address to a specific IP (IPv4 or IPv6):
53 #
54 # network.host: 192.168.0.1
55  network.host: 192.168.30.128  # 這裡配置本機的 ip 地址,這個是我的虛擬機器的 ip
56 #
57 # Set a custom port for HTTP:
58 #
59  http.port: 9200 # 預設的埠
其他配置可先不設定
啟動 elstaicseach[root@localhost elasticsearch-2.4.0]$ ./bin/elasticsearch注意,這裡肯定會報錯:
[root@localhost elasticsearch-2.4.0]# ./bin/elasticsearch
   Exception in thread "main" java.lang.RuntimeException: don't run elasticsearch as root.
   at org.elasticsearch.bootstrap.Bootstrap.initializeNatives(Bootstrap.java:94)
   at org.elasticsearch.bootstrap.Bootstrap.setup(Bootstrap.java:160)
   at org.elasticsearch.bootstrap.Bootstrap.init(Bootstrap.java:286)
   at org.elasticsearch.bootstrap.Elasticsearch.main(Elasticsearch.java:35)
 Refer to the log for complete error details.
之前在網上搜的教程這裡都沒有詳細說明,導致花了很長時間卡在這裡安裝不成功。
提示的原因已經說的很清楚了,不能以 root 許可權來安裝 elasticseach
為 elseach 新增專門的使用者組和使用者[root@localhost elasticsearch-2.4.0]# groupadd elseach [root@localhost elasticsearch-2.4.0]# adduser -G elseach elseach [root@localhost elasticsearch-2.4.0]# passwd elseach 123456將 elasticseach 的安裝目錄設定為 elseach 使用者組和使用者所有
[root@localhost elk]# chown -R elseach:elseach elasticsearch-2.4.0/別忘了將 /tmp/elasticseach/data 和 /tmp/elasticseach/logs 目錄也設定為 elseach 使用者所有,要不然會沒有許可權讀寫
[root@localhost tmp]# chown -R elseach:elseach elasticseach/好了。終於設定完畢。切換到 elseach 重新啟動
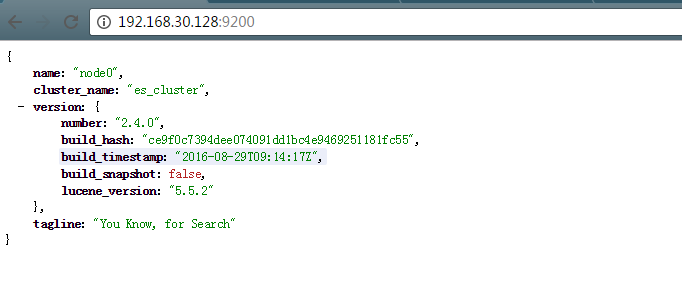
[elseach@localhost elasticsearch-2.4.0]# ./bin/elasticsearch[2016-09-22 01:51:42,102][WARN ][bootstrap] unable to install syscall filter: seccomp unavailable: requires kernel 3.5+ with CONFIG_SECCOMP andCONFIG_SECCOMP_FILTER compiled in [2016-09-22 01:51:42,496][INFO ][node] [node0] version[2.4.0], pid[4205], build[ce9f0c7/2016-08-29T09:14:17Z] [2016-09-22 01:51:42,496][INFO ][node] [node0] initializing ... [2016-09-22 01:51:43,266][INFO ][plugins] [node0] modules [reindex, lang-expression, lang-groovy], plugins [head], sites [head] [2016-09-22 01:51:43,290][INFO ][env] [node0] using [1] data paths, mounts [[/ (/dev/sda5)]], net usable_space [8.4gb], net total_space [14.6gb], spins?[possibly], types [ext4] [2016-09-22 01:51:43,290][INFO ][env] [node0] heap size [998.4mb], compressed ordinary object pointers [unknown] [2016-09-22 01:51:43,290][WARN ][env] [node0] max file descriptors [4096] for elasticsearch process likely too low, consider increasing to at least[65536] [2016-09-22 01:51:45,697][INFO ][node] [node0] initialized [2016-09-22 01:51:45,697][INFO ][node] [node0] starting ... [2016-09-22 01:51:45,832][INFO ][transport] [node0] publish_address {192.168.30.128:9300}, bound_addresses {192.168.30.128:9300} [2016-09-22 01:51:45,839][INFO ][discovery] [node0] es_cluster/kJMDfFMwQXGrigfknNs-_g [2016-09-22 01:51:49,039][INFO ][cluster.service] [node0] new_master {node0}{kJMDfFMwQXGrigfknNs-_g}{192.168.30.128} {192.168.30.128:9300}, reason:zen-disco-join(elected_as_master, [0] joins received) [2016-09-22 01:51:49,109][INFO ][http] [node0] publish_address {192.168.30.128:9200}, bound_addresses {192.168.30.128:9200} [2016-09-22 01:51:49,109][INFO ][node] [node0] started [2016-09-22 01:51:49,232][INFO ][gateway] [node0] recovered [2] indices into cluster_state說明搜尋引擎 API 返回正常。注意要在伺服器將 9200 埠開啟,否則訪問失敗。
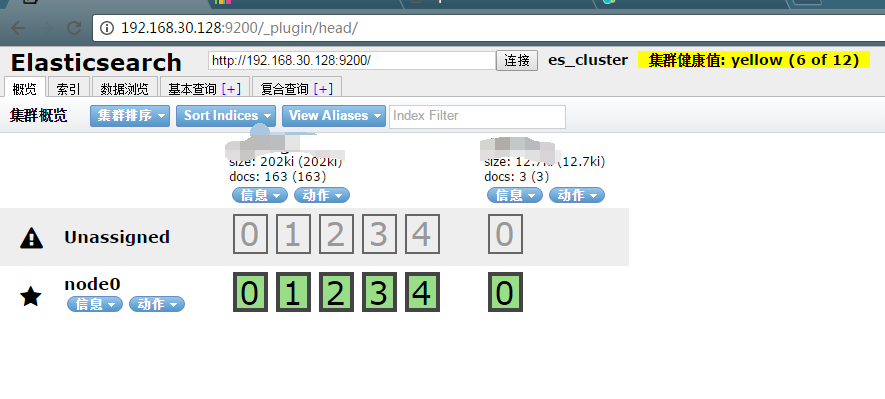
如果是第一次搭建好,裡面是沒有資料的,node0 節點也沒有叢集資訊,這裡我搭建完成後已經添加了資料。所以顯示的有資訊
Logstash安裝
[root@localhost elk]# tar -zxvf logstash-2.4.0
[root@localhost elk]# cd logstash-2.4.0
編輯 logstash 配置檔案:
[root@localhost logstash-2.4.0]# mkdir config
[root@localhost logstash-2.4.0]# vim config/logstash.conf
這裡因為為了簡單來顯示一下資料,我這裡將 apache 的日誌作為資料來源,也就是 logstash 的 input,直接輸出到 elstaticseach 裡,即 ouput
 input {
     # For detail config for log4j as input,
     # See: https://www.elastic.co/guide/en/logstash/
     file {
           type => "apache-log" # log 名
           path => "/etc/httpd/logs/access_log" # log 路徑
     }
 }
filter {
    #Only matched data are send to output. 這裡主要是用來過濾資料
}
output {
   # For detail config for elasticsearch as output,
   # See: https://www.elastic.co/guide/en/logstash/current
   elasticsearch {
     action => "index"          #The operation on ES
     hosts  => "192.168.30.128:9200"   #ElasticSearch host, can be array. # elasticseach 的 host
     index  => "apachelog"         #The index to write data to.
   }
}
使用命令來檢測配置檔案是否正確
[root@localhost logstash-2.4.0]# ./bin/logstash -f config/logstash.conf --configtest
Configuration OK
啟動 logstash 來收集日誌
 [root@localhost logstash-2.4.0]# ./bin/logstash -f config/logstash.conf
 Settings: Default pipeline workers: 4
 Pipeline main started
好了,logstash 可以開始收集日誌了,當日志文件有變化時,會動態的寫入到 elastaticseach 中,先讓我們來產生一些日誌吧。
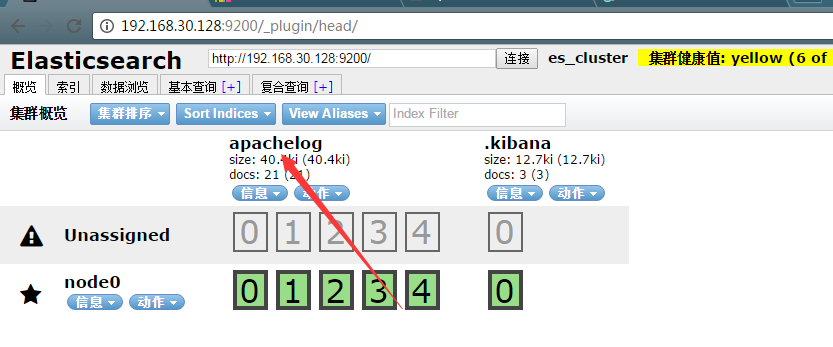
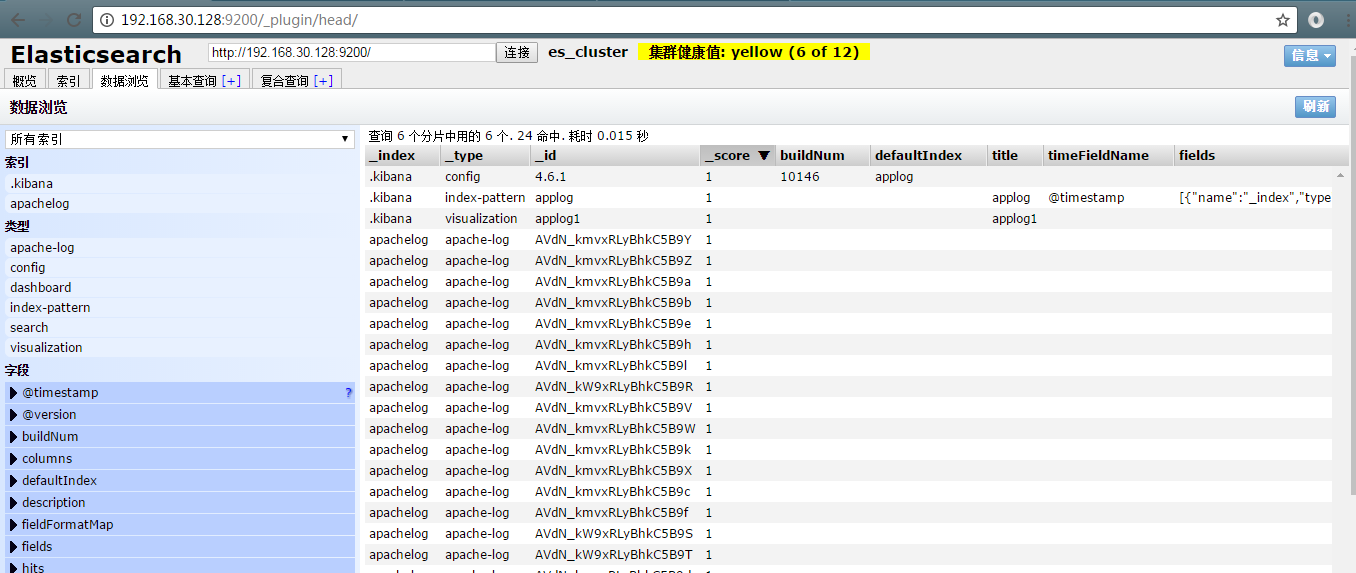
重新整理 http://192.168.30.128/ 一直重新整理,apache 產生訪問日誌。ok,開啟我們的 elasticseach 的 web 頁面 http://192.168.30.128:9200/_plugin/head/這裡就出現了我們剛剛配置的 apachelog 的日誌,點開資料瀏覽
這裡很詳細的列出了我們的日誌檔案,還有欄位,左邊可進行相應的搜尋,右邊點選可檢視具體的日誌資訊。
至此我們已經能夠收集日誌,並進行搜尋,接下來我們來將搜尋資料視覺化成圖表Kibana 的安裝
解壓目錄:
[root@localhost elk]# tar -zxvf kibana-4.6.1-linux-x86
[root@localhost elk]# cd kibana-4.6.1-linux-x86
編輯配置檔案:
 [root@localhost kibana-4.6.1-linux-x86]# vim config/kibana.yml
 # Kibana is served by a back end server. This controls which port to use.
 server.port: 5601  # kibaba 服務 port
 # The host to bind the server to.
 server.host: "192.168.30.128"  # 你的kibaba 的服務host
 # If you are running kibana behind a proxy, and want to mount it at a path,
 # specify that path here. The basePath can't end in a slash.
 # server.basePath: ""
 # The maximum payload size in bytes on incoming server requests.
 # server.maxPayloadBytes: 1048576
 # The Elasticsearch instance to use for all your queries.
 elasticsearch.url: "http://192.168.30.128:9200"  # elastaticseach 的host
 # preserve_elasticsearch_host true will send the hostname specified in `elasticsearch`. If you set it to false,
 # then the host you use to connect to *this* Kibana instance will be sent.
 # elasticsearch.preserveHost: true

# Kibana uses an index in Elasticsearch to store saved searches, visualizations
# and dashboards. It will create a new index if it doesn't already exist.
kibana.index: ".kibana" # kibana

# The default application to load.
# kibana.defaultAppId: "discover"

# If your Elasticsearch is protected with basic auth, these are the user credentials
# used by the Kibana server to perform maintenance on the kibana_index at startup. Your Kibana
配置比較簡單
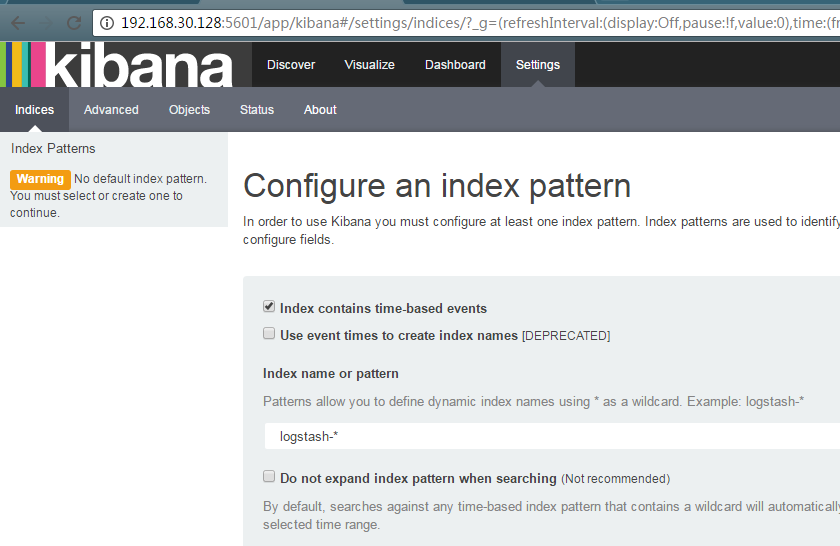
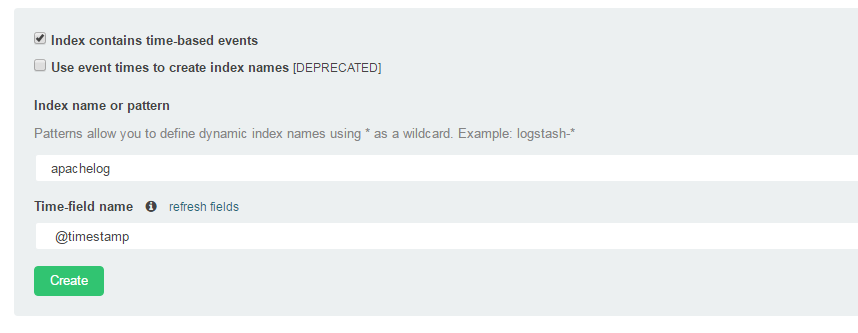
配置完成後開始執行[root@localhost kibana-4.6.1-linux-x86]# ./bin/kibana log [02:48:34.732] [info][status][plugin:[email protected]] Status changed from uninitialized to green - Ready log [02:48:34.771] [info][status][plugin:[email protected]] Status changed from uninitialized to yellow - Waiting for Elasticsearch log [02:48:34.803] [info][status][plugin:[email protected]] Status changed from uninitialized to green - Ready log [02:48:34.823] [info][status][plugin:[email protected]] Status changed from uninitialized to green - Ready log [02:48:34.827] [info][status][plugin:[email protected]] Status changed from uninitialized to green - Ready log [02:48:34.835] [info][status][plugin:[email protected]] Status changed from yellow to green - Kibana index ready log [02:48:34.840] [info][status][plugin:[email protected]] Status changed from uninitialized to green - Ready log [02:48:34.847] [info][status][plugin:[email protected]] Status changed from uninitialized to green - Ready log [02:48:34.857] [info][status][plugin:[email protected]] Status changed from uninitialized to green - Ready log [02:48:34.867] [info][listening] Server running at http://192.168.30.128:5601這裡要先新增 index,在 輸入框輸入我們剛剛收集的 apachelog 作為 index 名稱
點選 create 建立
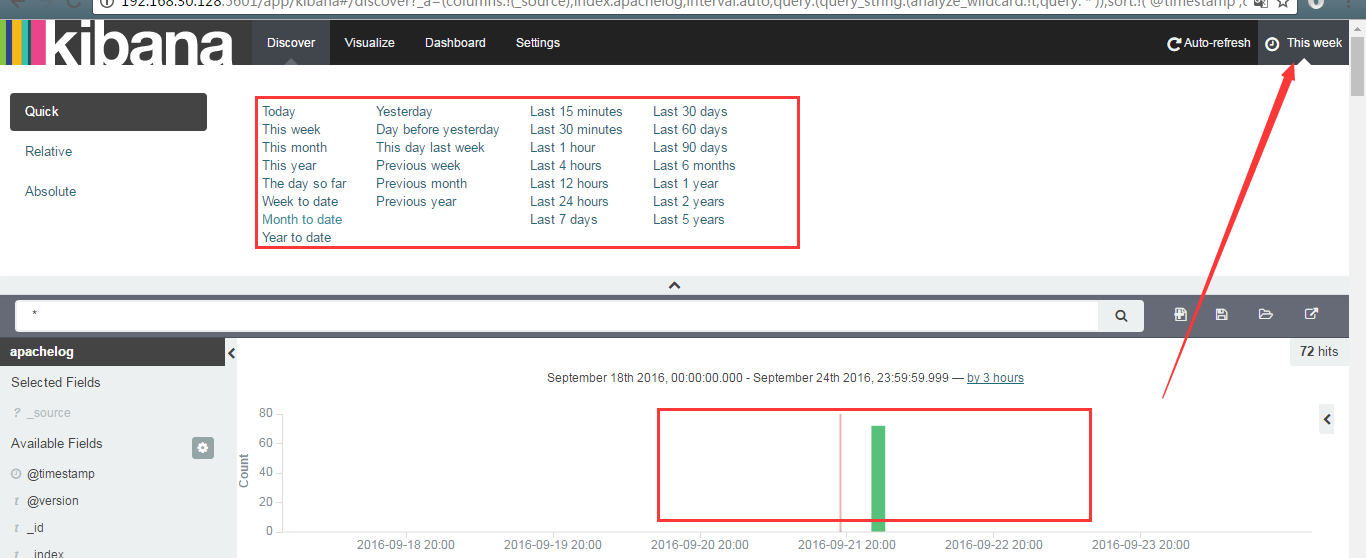
右上角選擇時間來顯示我們的資料訪問,下面是資料的訪問量
中間的搜尋框可輸入搜尋條件搜尋,搜尋完成後點選右上角的 save seach 儲存搜尋資料
點選 visualize 可以畫出其他的資料分析圖,比如餅狀圖

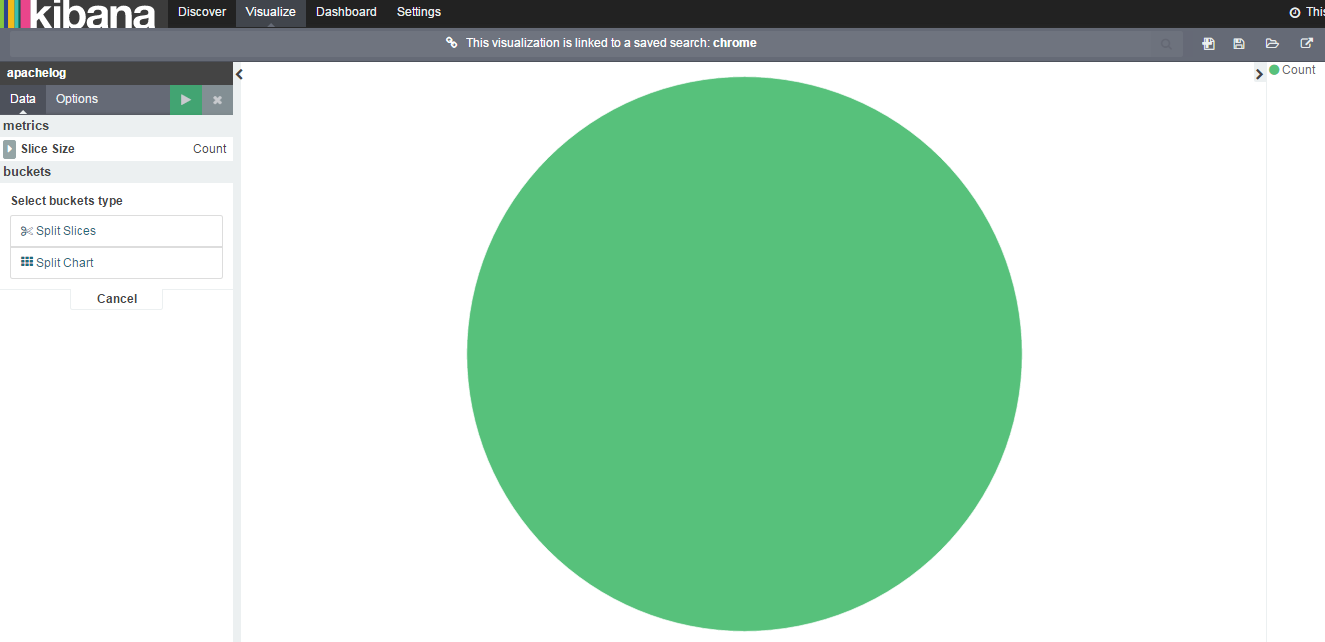
選擇我們剛剛儲存的 chrome 的檔案來生成餅狀圖
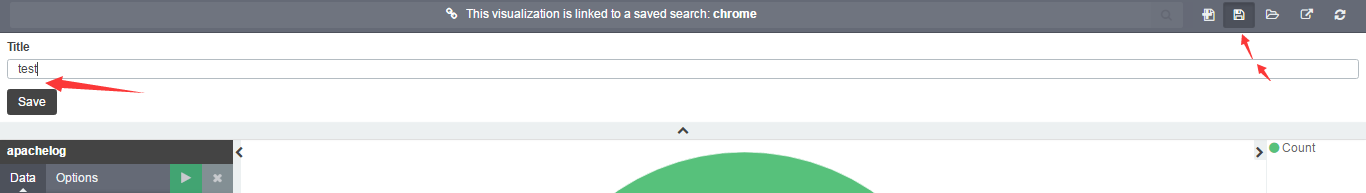
因為資料沒什麼變化,所以只能全部是一樣的。還是點選右上角的儲存按鈕,將餅狀圖儲存為 test
新增到 面板中,點選 dashboard
點選 + 號新增
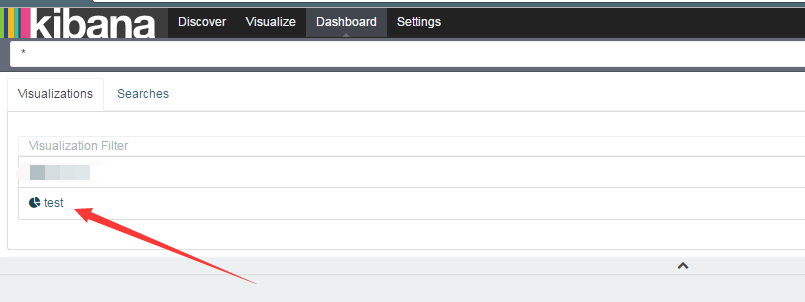
選擇 test 來顯示到面板,效果如下
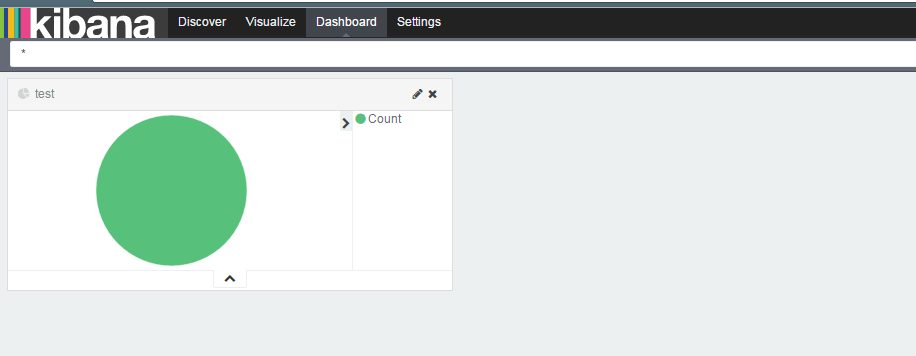
這樣簡單的 ELK 系統就搭建起來了,當然,正真的使用環境中,我們會使用叢集搭建。利用 redis 來處理日誌佇列。
marvel 外掛
Marvel是Elasticsearch的管理和監控工具,在開發環境下免費使用。擁有更好的資料圖表介面。
首先在 elastaticsearch 下安裝 marvel-agent 外掛
[elseach@localhost elasticsearch-2.4.0]$ ./bin/plugin install license
[elseach@localhost elasticsearch-2.4.0]$ ./plugin install marvel-agent
這裡注意,必須先執行 license 安裝,再執行 marvel-agent 安裝,安裝完成後重啟 elastaticseach
接下來 kibana 來安裝 marvel 外掛
[root@localhost kibana-4.6.1-linux-x86]# cd bin
[root@localhost bin]# ./kibana plugin --install elasticsearch/marvel/latest
安裝完成後重啟 kibana,選擇 marvel 外掛

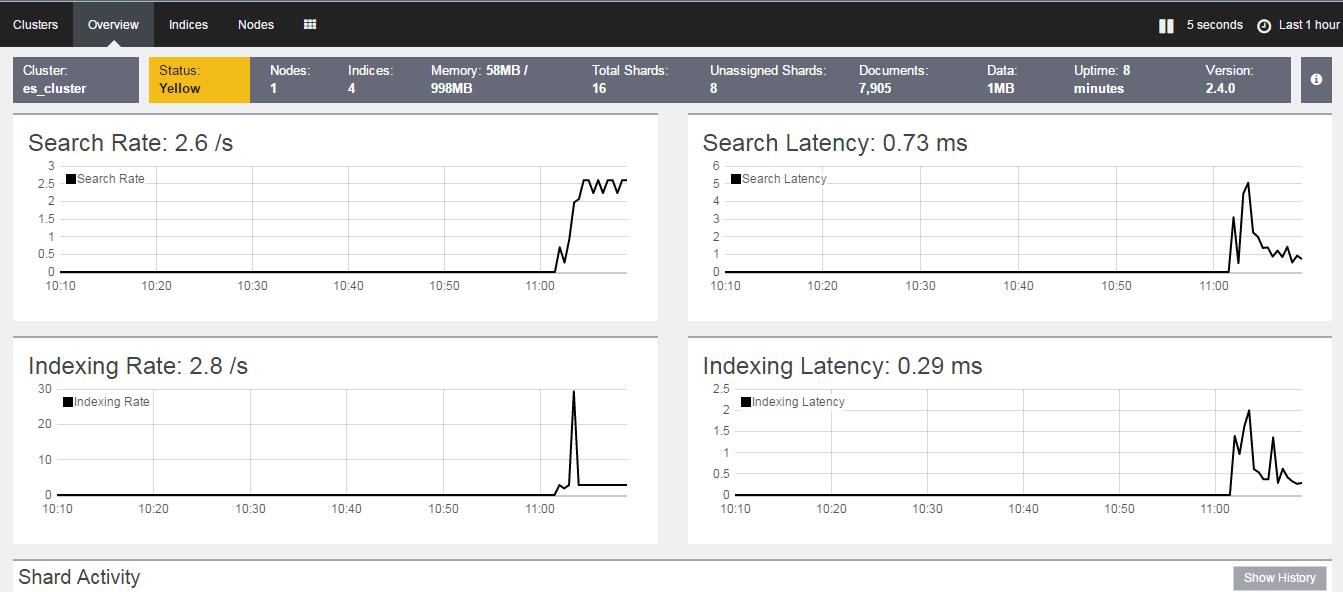
是不是感覺有點高大上。。。
好了 ELK 的基本搭建就算是完成了,接下來我們考慮如何叢集來使用這個系統。
歡迎指正, Thanks….