
你需要精通一種監控-prometheus服務端相關內容
阿新 • • 發佈:2019-07-08
[root@aliyun-hk-yabo-prod-jiranew prometheus210]# ll
total 117924
drwxr-xr-x  2 3434 3434     4096 May 25 21:54 console_libraries
drwxr-xr-x  2 3434 3434     4096 May 25 21:54 consoles
drwxr-xr-x 21 root root     4096 Jul  8 03:00 data
-rw-r--r--  1 3434 3434    11357 May 25 21:54 LICENSE
-rw-r--r--  1 3434 3434     2770 May 25 21:54 NOTICE
-rwxr-xr-x  1 3434 3434 74561203 May 25 20:29 prometheus
-rw-r--r--  1 3434 3434     1232 Jun 30 01:17 prometheus.yml
-rwxr-xr-x  1 3434 3434 46152675 May 25 20:31 promtool
我們需要關注的主要檔案
data 為資料目錄
prometheus 為程式二進位制檔案
prometheus.ym 為prometheus主配置檔案
1) data目錄
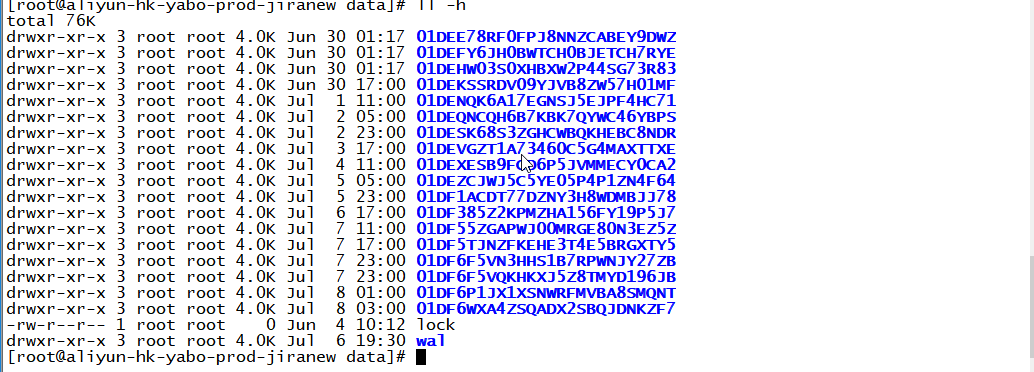
01**** 開頭的這些檔案為歷史資料檔案目錄
wal 資料保護檔案目錄,prometheus為了防止資料的突然斷電等情況,如果出現斷電狀況恢復後wal下的檔案會恢復到記憶體中
2) 主配置檔案
[root@aliyun-hk-yabo-prod-jiranew prometheus210]# cat prometheus.yml
# my global config
global:
  scrape_interval:     15s # Set the scrape interval to every 15 seconds. Default is every 1 minute.
  evaluation_interval: 15s # Evaluate rules every 15 seconds. The default is every 1 minute.
  # scrape_timeout is set to the global default (10s).

# Alertmanager configuration
alerting:
  alertmanagers:
  - static_configs:
    - targets:
       - 127.0.0.1:9093

# Load rules once and periodically evaluate them according to the global 'evaluation_interval'.
rule_files:
   - "first_rules.yml"
  # - "second_rules.yml"

# A scrape configuration containing exactly one endpoint to scrape:
# Here it's Prometheus itself.
scrape_configs:
  # The job name is added as a label `job=<job_name>` to any timeseries scraped from this config.
  - job_name: 'prometheus'

    # metrics_path defaults to '/metrics'
    # scheme defaults to 'http'.

    static_configs:
    - targets: ['localhost:9090']

  - job_name: 'jira-47-75-67-250'
    static_configs:
      - targets: ['47.75.67.250:9100']
        labels:
          instance: jira-old

  - job_name: 'jira-mysql'
    static_configs:
    - targets: ['47.75.67.250:9104']
      labels:
        instance: jira-mysql
注:prometheus伺服器預設監聽埠為9090 ,clie