
熱力圖與原始影象融合
阿新 • • 發佈:2020-07-29
使用神經網路進行預測時,一個明顯的缺陷就是缺少可解釋性,我們不能通過一些簡單的方法來知道網路做出決策或者預測的理由,這在很多方面就使得它的應用受限。
雖然不能通過一些數學方法來證明模型的有效性,但我們仍能夠通過一些視覺化熱力圖的方法來觀測一下原始資料中的哪些部分對我們網路影響較大。
實現熱力圖繪製的方法有很多,如:CAM, Grad-CAM, Contrastive EBP等。在熱力圖生成之後,因為沒有原始資料資訊,所以我們並不能很直觀地觀測到模型到底重點關注了影象的哪些區域。這時將熱力圖疊加到原始影象上的想法就會很自然的產生。這裡存在的一個問題是原始影象的色域空間可能和產生的熱力圖的色域空間是不一致的,當二者疊加的時候,會產生顏色的遮擋。並且因為產生的熱力圖的尺寸應該與原始影象尺寸一致或者調整到與原始尺寸一致,這樣當二者直接簡單地疊加的話,產生的影象可能並不是我們想要的,因此,我們需要先對熱力圖資料進行一些簡單的畫素處理,然後在考慮與原始影象的融合。以下部分的安排為:1. 熱力圖的產生 2. 熱力圖與原始圖的疊加 3. 熱力圖與原始圖融合優化
## 1. 熱力圖產生
在這裡使用3D-Grad-CAM的方法來實現熱力圖繪製的方法,使用的影象尺寸為144, 168, 152 程式碼如下:
```python
def cam(img_path, model_path, relu=True, sigmoid=False):
# grad-cam
img_data = np.load(img_path)
img_data = img_data[np.newaxis, :, :, :, np.newaxis]
max_ = np.max(img_data)
min_ = np.min(img_data)
img_data = (img_data - min_) / (max_ - min_)
model = load_model(model_path)
model.summary()
index = 0
pred = model.predict(img_data)
if sigmoid:
if pred >= 0.5:
index = 1
else:
max_ = np.max(pred)
for i in range(4):
if pred[0][i] == max_:
index = i
break
print(pred)
print("index: ", index)
pre_output = model.output[:, index]
last_conv_layer = model.get_layer('conv3d_7')
grads = K.gradients(pre_output, last_conv_layer.output)[0]
pooled_grads = K.mean(grads, axis=(0, 1, 2, 3))
iterate = K.function([model.input], [pooled_grads, last_conv_layer.output[0]])
pooled_grads_value, conv_layer_output_value = iterate([img_data])
if relu:
conv_layer_output_value[np.where(conv_layer_output_value < 0)] = 0
conv_max = np.max(conv_layer_output_value)
conv_min = np.min(conv_layer_output_value)
conv_layer_output_value = (conv_layer_output_value - conv_min) / (conv_max - conv_min)
pool_max = np.max(pooled_grads_value)
pool_min = np.min(pooled_grads_value)
pooled_grads_value = (pooled_grads_value - pool_min) / (pool_max - pool_min)
layer_number = len(pooled_grads_value)
for i in range(layer_number):
conv_layer_output_value[:, :, :, i] *= pooled_grads_value[i]
# along the last dim calculate the mean value
heatmap = np.mean(conv_layer_output_value, axis=-1)
# remove the value which less than 0
heatmap = np.maximum(heatmap, 0)
# uniformization
min_ = np.min(heatmap)
max_ = np.max(heatmap)
heatmap = (heatmap - min_) / (max_ - min_)
return heatmap
```
## 2. 熱力圖與原始圖的疊加
通過以下程式碼獲取熱力圖,並將其尺寸放縮到與原圖一致:
```python
heatmap = cam(img_path, model_path)
heatmap = resize(heatmap, (144, 168, 152))
```
載入資料:
```python
img_data = np.load(img_path)
```
熱力圖與原圖簡單疊加:
```python
def easy_show(data, heatmap):
plt.figure()
plt.subplot(221)
plt.axis('off')
plt.imshow(data, cmap='bone')
plt.subplot(222)
plt.axis('off')
plt.imshow(heatmap, cmap='rainbow')
plt.subplot(223)
plt.axis('off')
plt.imshow(data, cmap='bone')
plt.imshow(heatmap, cmap='rainbow', alpha=0.7)
plt.subplot(224)
plt.axis('off')
plt.imshow(data, cmap='bone')
plt.imshow(heatmap, cmap='rainbow', alpha=0.3)
plt.savefig(r'E:\study\研究生\筆記\studyNote\others\imgs\tmp.png')
# 使用
heatmap = np.load("CNcam.npy")
img_data = np.load(img_path)
easy_show(img_data[:, 84, :], heatmap[:, 84, :])
```
影象融合結果:
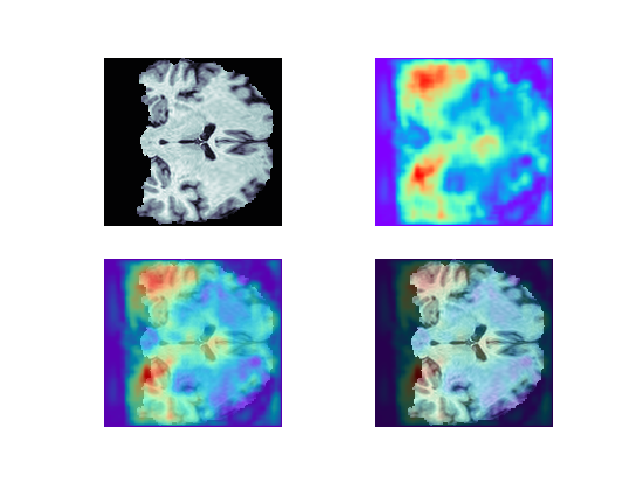
## 3. 熱力圖與原始圖融合優化
上面影象融合之後存在的問題是,前景熱力圖完全遮擋了原圖,使得最終的展示圖中,原圖結構存在模糊。首先對熱力圖進行優化,使背景顏色變為白色且去掉一些權重過小熱力。然後將熱力圖剩餘的部分疊加到原圖上。
```python
def img_fusion(img1, img2, save_path):
dpi = 100
save_fig(img1, dpi, "cam.png")
img = Image.open("cam.png")
img = np.array(img)
for i in range(len(img)):
for j in range(len(img[0])):
if img[i][j][0] == 127 and img[i][j][1] == 0 and img[i][j][2] == 255 \
and img[i][j][3] == 255:
img[i][j][:] = 255
save_fig(img2, dpi, "data.png", "bone")
cam_img = cv2.imread("cam.png")
data_img = cv2.imread("data.png")
cam_gray = cv2.cvtColor(cam_img, cv2.COLOR_BGR2GRAY)
rest, mask = cv2.threshold(cam_gray, 80, 255, cv2.THRESH_BINARY)
cam_fg = cv2.bitwise_and(cam_img, cam_img, mask=mask)
dst = cv2.addWeighted(cam_fg, 0.4, data_img, 1, 0)
add_cubic = cv2.resize(dst, (dst.shape[1] * 4, dst.shape[0] * 4), cv2.INTER_CUBIC)
cv2.imwrite(save_path, add_cubic)
```
使用上面的函式(上面的影象不正,首先向左旋轉90°,之後再進行融合):
```python
heatmap = np.load("CNcam.npy")
img_data = np.load(img_path)
heatmap = np.where(heatmap < 0.3, 0, heatmap) * 255
img_data = np.rot90(img_data[:, 84, :], 1) # 向左旋轉90度
heatmap = np.rot90(heatmap[:, 84, :], 1)
img_fusion(heatmap, img_data, r'tmp.png')
```
繪製結果:
![](https://img2020.cnblogs.com/blog/1503464/202007/1503464-20200729151548253-1041592