
Prometheus+Grafana監控MySQL
阿新 • • 發佈:2020-12-17
## Prometheus+Grafana監控MySQL
- Prometheus(由go語言(golang)開發)是一套開源的監控&報警&時間序列資料庫的組合。適合監控docker容器。因為kubernetes(俗稱k8s)的流行帶動了prometheus的發展。被很多人稱為下一代監控系統。
- Grafana是一個開源的圖表視覺化系統,簡單說圖表配置比較方便、生成的圖表比較漂亮,並能實現報警。支援五十多種資料來源,Prometheus就是其中支援的一種。
- 下面就介紹了利用Prometheus與Grafana對Mysql伺服器效能監控的方法。
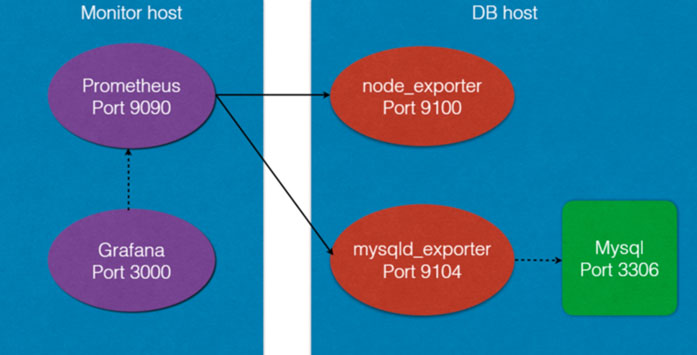
### 1 架構圖
#### 祖傳老圖,修一修拿來用
下面是本次部署的架構圖

### 2 實驗環境準備
- grafana伺服器:10.0.3.112
- Prometheus伺服器:10.0.3.112
- 被監控伺服器:10.0.3.105/115
1.時間同步(時間同步一定要確認一下)
2.關閉防火牆,selinux
### 3 安裝prometheus server
從 https://prometheus.io/download/ 下載相應版本,安裝到伺服器上
官網提供的是二進位制版,解壓就能用,不需要編譯
#### 3.1 安裝
```
# 解壓安裝包
tar -xf prometheus-2.23.0.linux-amd64.tar.gz -C /opt
# 建立連結目錄
cd /opt
ln -s prometheus-2.23.0.linux-amd64 prometheus
# 直接使用預設配置檔案啟動
/opt/prometheus/prometheus --config.file="/opt/prometheus/prometheus.yml" &
# 確認是否正常啟動(預設埠9090)
[root@server ~]# netstat -lnptu | grep 9090
tcp6 0 0 :::9090 :::* LISTEN 103006/prometheus
```
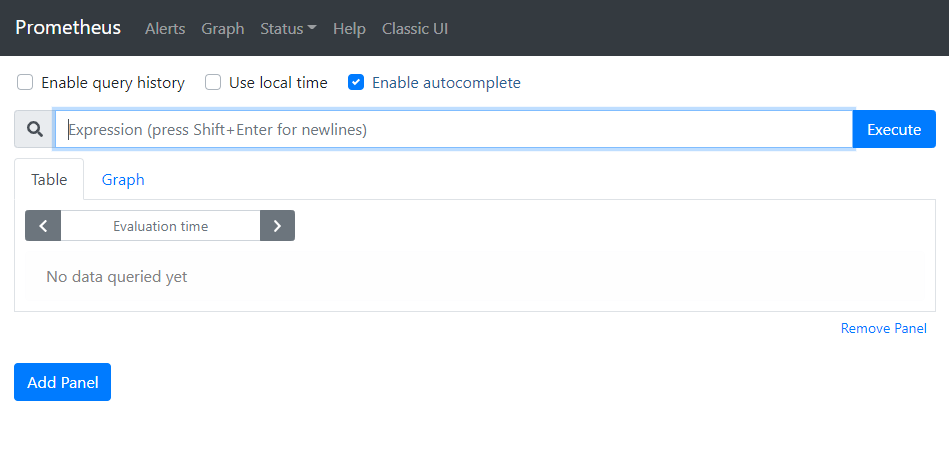
#### 3.2 prometheus介面
##### 通過瀏覽器訪問http://伺服器IP:9090就可以訪問到prometheus的主介面
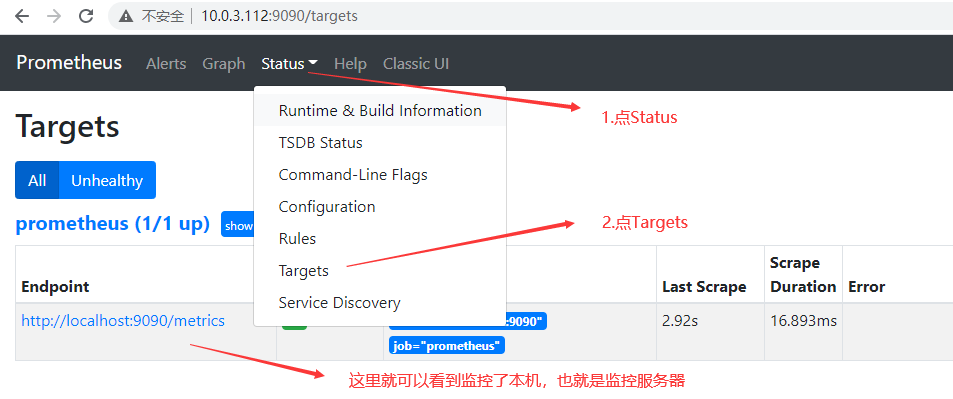
##### 點Status-->Targets-->就可以看到監控的本機
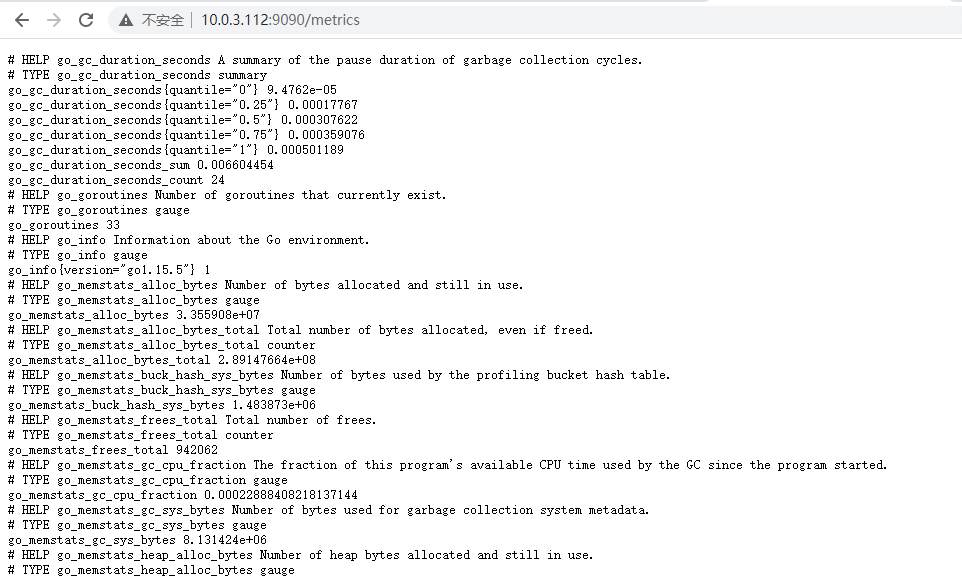
#### 3.3 監控本機資料展示
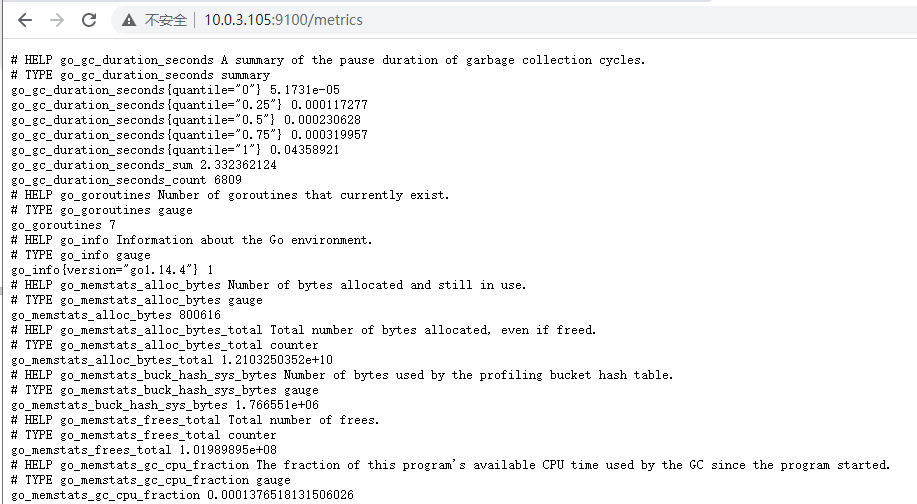
##### 通過http://伺服器IP:9090/metrics可以檢視到監控的資料
##### 在web主介面可以通過關鍵字查詢監控項
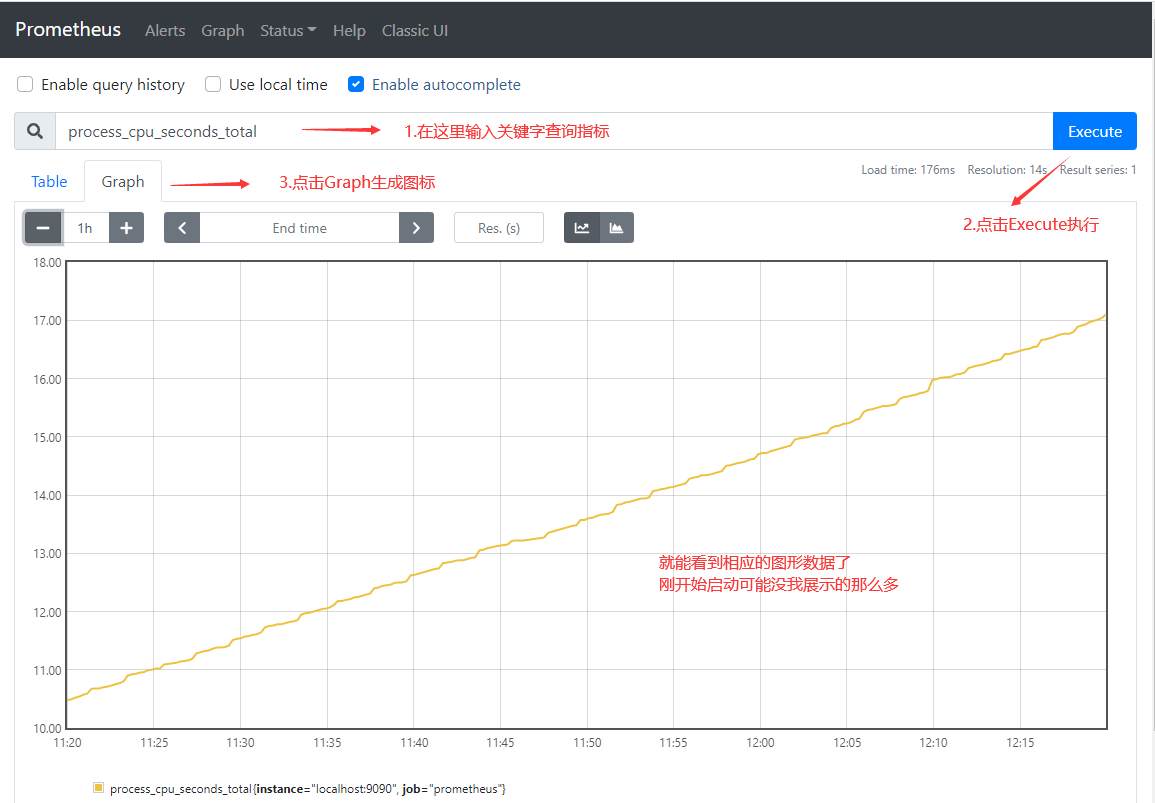
### 4 監控遠端Linux主機
#### 4.1 在被監控端上安裝node_exporter元件
下載地址: https://prometheus.io/download/
```
# 解壓安裝包
tar -xf node_exporter-1.0.1.linux-amd64.tar.gz -C /opt
# 建立連結目錄
cd /opt
ln -s node_exporter-1.0.1.linux-amd64 node_exporter
# 使用nohup後臺執行
nohup /opt/node_exporter/node_exporter &
# 確認是否正常啟動(預設埠9100)
[root@mysql01 ~]# netstat -lnptu | grep 9100
tcp6 0 0 :::9100 :::* LISTEN 20716/node_exporter
擴充套件: nohup命令: 如果把啟動node_exporter的終端給關閉,那麼程序也會
隨之關閉。nohup命令會幫你解決這個問題。
```
##### 同樣操作,將所有需要被監控主機安裝node_exporter元件
#### 4.2 通過瀏覽器訪問http://被監控端IP:9100/metrics就可以檢視到node_exporter在被監控端收集的監控資訊
#### 4.3 回到prometheus伺服器的配置檔案裡新增被監控機器的配置段
```
在主配置檔案最後面新增被監控主機資訊
[root@server ~]# vim /opt/prometheus/prometheus.yml
- job_name: '10.0.3.105' # 給被監控主機取個名字,我這裡直接填的IP
static_configs:
- targets: ['10.0.3.105:9100'] # 這裡填寫被監控主機的IP和埠
- job_name: '10.0.3.115'
static_configs:
- targets: ['10.0.3.115:9100']
有多少臺被監控主機就照格式新增在後面好了,我這裡監控了105/115兩臺主機
```
##### 改完配置檔案後,重啟服務
```
[root@server ~]# pkill prometheus
[root@server ~]# /opt/prometheus/prometheus --config.file="/opt/prometheus/prometheus.yml" &
[root@server ~]# netstat -lnptu | grep 9090
```
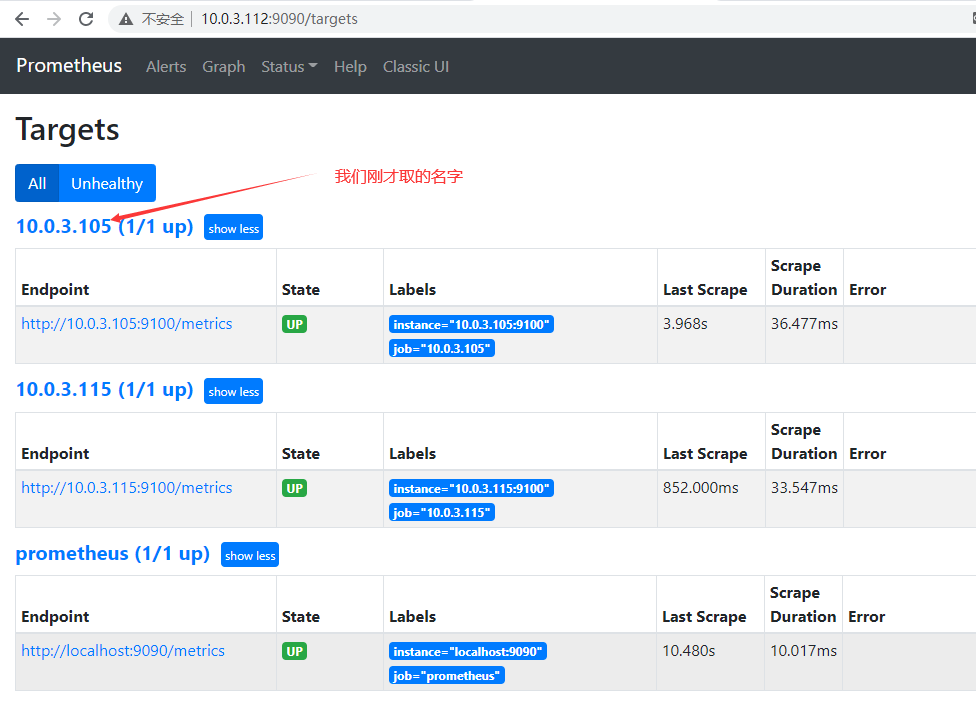
#### 4.4 回到web管理介面,可以看到多了兩臺監控主機
### 5 監控遠端MySQL
#### 5.1 在被管理MySQL伺服器上安裝mysqld_exporter元件
下載地址: https://prometheus.io/download/
```
# 解壓安裝包
tar -xf mysqld_exporter-0.12.1.linux-amd64.tar.gz -C /opt
# 建立連結目錄
cd /opt
ln -s mysqld_exporter-0.12.1.linux-amd64 mysqld_exporter
# 在MySQL伺服器上建立監控使用者
mysql> grant select,replication client, process on *.* to 'mysql_monitor'@'localhost' identified by '123';
Query OK, 0 rows affected, 1 warning (0.00 sec)
mysql> flush privileges;
Query OK, 0 rows affected (0.03 sec)
mysql> exit
Bye
# 將上面建立的mysql使用者資訊寫入mysqld_exporter配置檔案(新建立一個)
[root@mysql01 ~]# vim /opt/mysqld_exporter/.my.cnf
[client]
user=mysql_monitor
password=123
# 啟動mysqld_exporter
nohup /opt/mysqld_exporter/mysqld_exporter --config.my-cnf=/opt/mysqld_exporter/.my.cnf &
# 確認是否正常啟動(預設埠9104)
[root@mysql01 ~]# netstat -lnptu | grep 9104
tcp6 0 0 :::9104 :::* LISTEN 32688/mysqld_export
```
#### 5.2 回到prometheus伺服器的配置檔案裡新增被監控的mariadb的配置段
```
在主配置檔案最後面新增被監控主機資訊
[root@server ~]# vim /opt/prometheus/prometheus.yml
- job_name: 'mysql-105' # 給被監控主機取個名字
static_configs:
- targets: ['10.0.3.105:9104'] # 這裡填寫被監控主機的IP和埠
- job_name: 'mysql-115'
static_configs:
- targets: ['10.0.3.115:9104']
有多少臺被監控MySQL伺服器就照格式新增在後面好了,我這裡監控了105/115兩臺MySQL伺服器
```
##### 改完配置檔案後,重啟服務
```
[root@server ~]# pkill prometheus
[root@server ~]# /opt/prometheus/prometheus --config.file="/opt/prometheus/prometheus.yml" &
[root@server ~]# netstat -lnptu | grep 9090
```
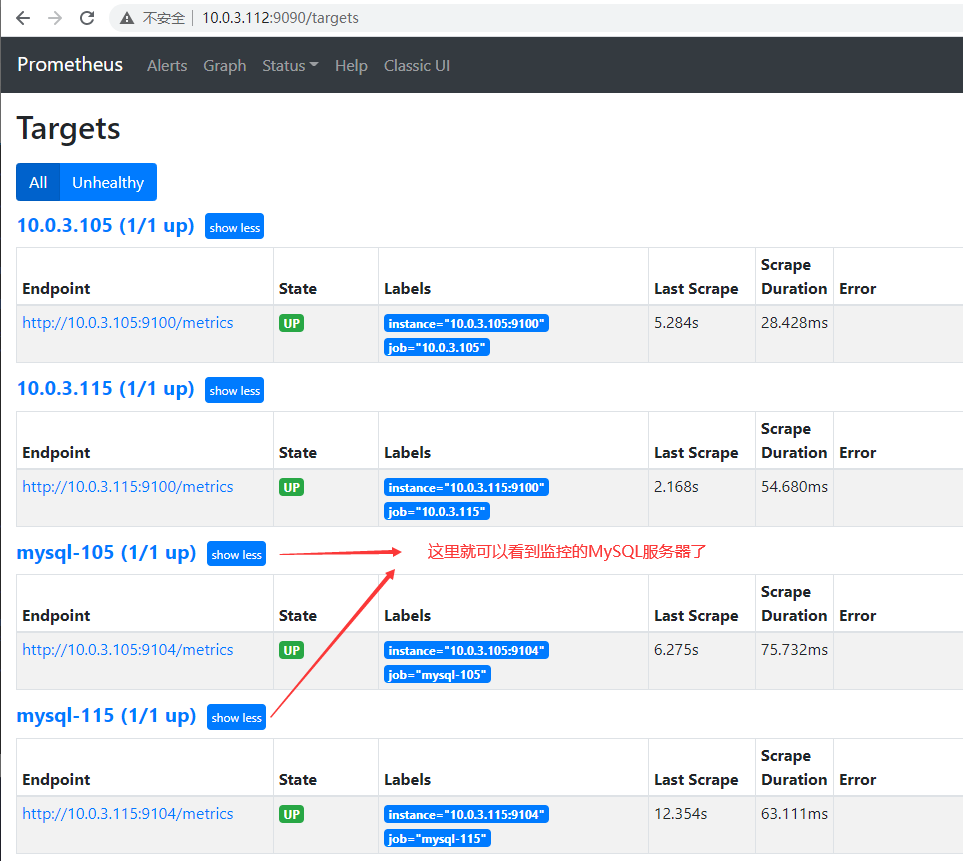
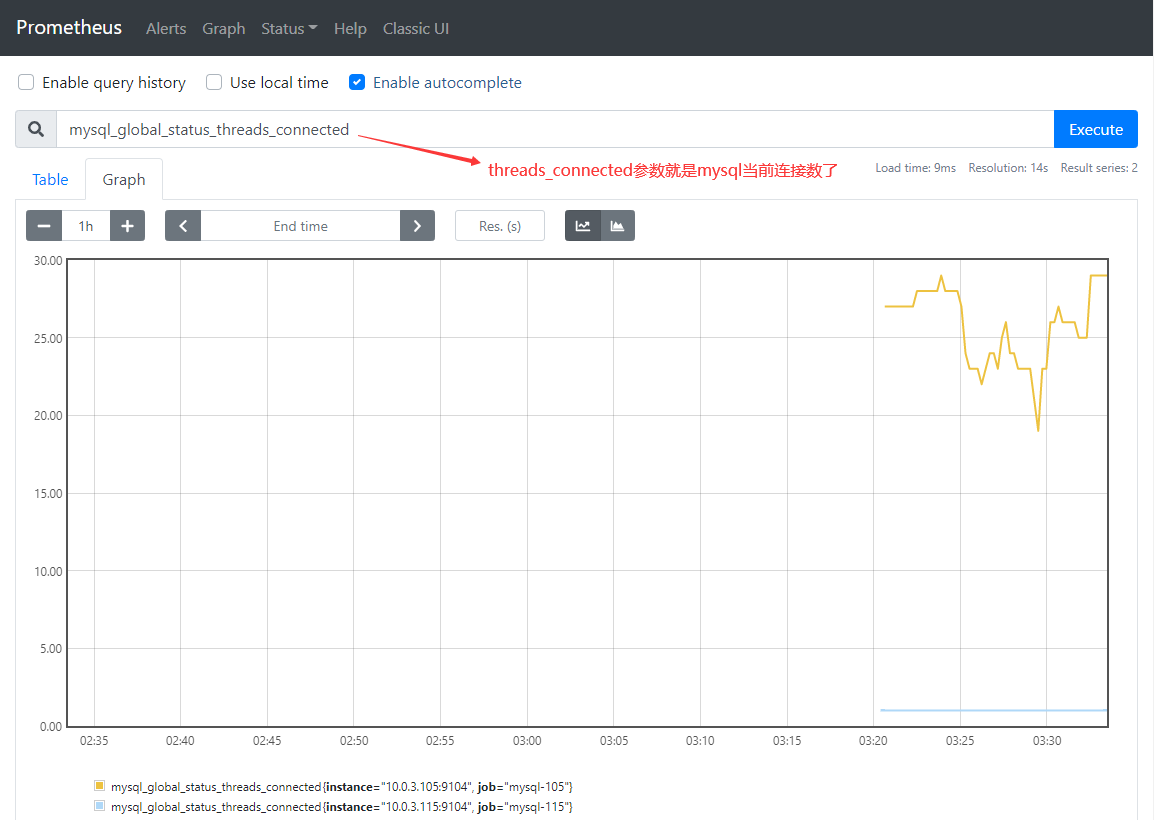
#### 5.3 回到web管理介面點Status-->Targets-->就可以看到監控的MySQL伺服器了
##### 回到主介面搜尋mysql相關引數
### 6 Grafana視覺化圖形工具
#### 6.1 什麼是Grafana
開頭已經講過了,官網:https://grafana.com/
#### 6.2 安裝grafana伺服器
下載地址:https://grafana.com/grafana/download
```
我這是使用的是CentOS系統,直接下載rpm包就好
yum localinstall grafana-7.3.5-1.x86_64.rpm
啟動服務並加入開機啟動
systemctl start grafana-server.service
systemctl enable grafana-server.service
檢查服務狀態(預設使用3000埠)
systemctl status grafana-server.service
netstat -lnptu | grep 3000
tcp6 0 0 :::3000 :::* LISTEN 112219/grafana-serv
```
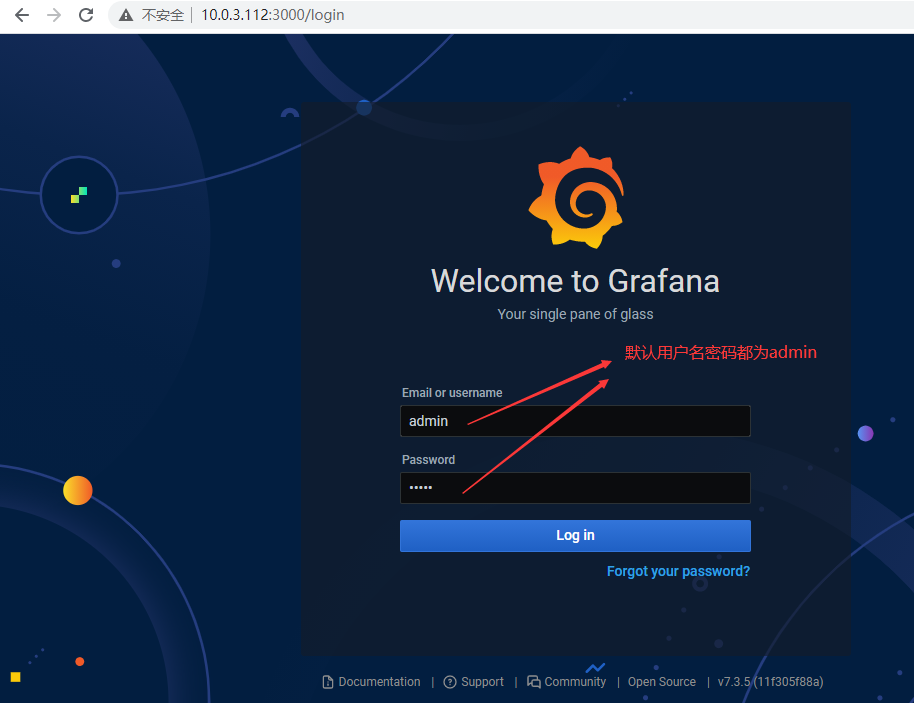
#### 6.3 登陸grafana WEB介面
##### 通過瀏覽器訪問 http:// grafana伺服器IP:3000就到了登入介面,使用預設使用者名稱admin,密碼admin
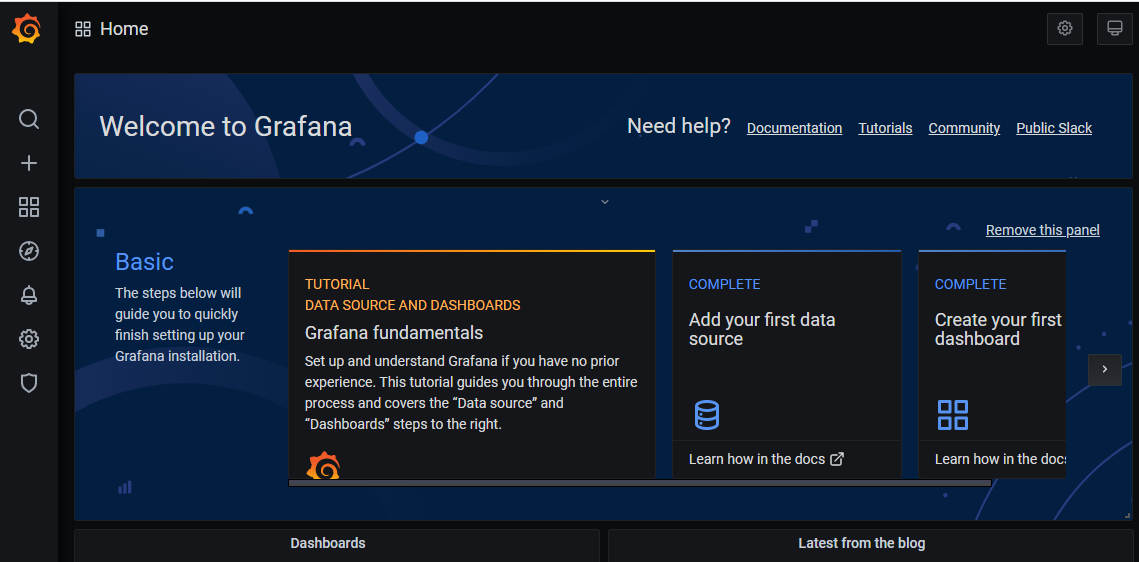
- 登陸後會提示你修改密碼,暫時不想修改話可以先跳過
##### 至此,我們就可以看到grafana主介面了
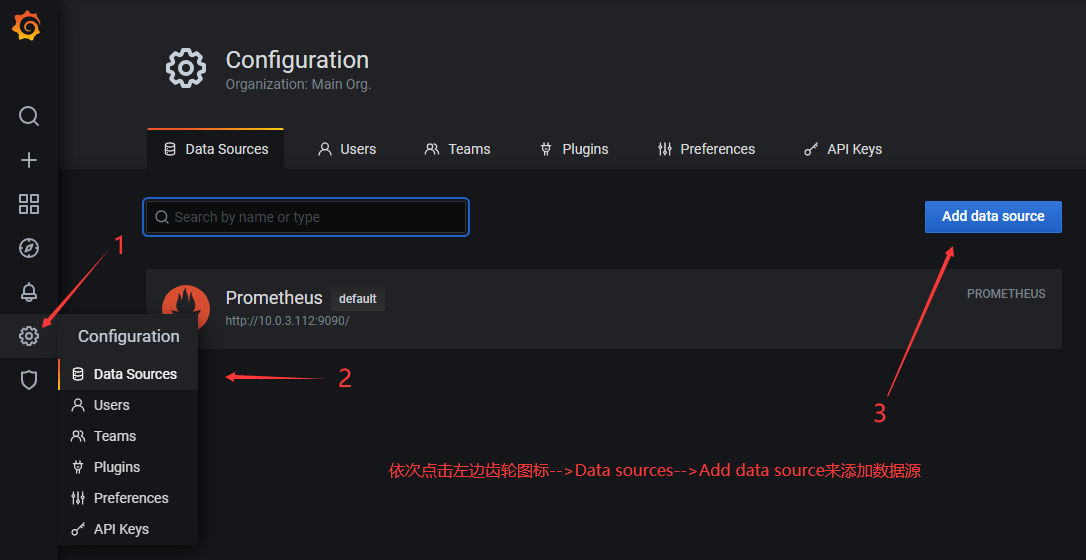
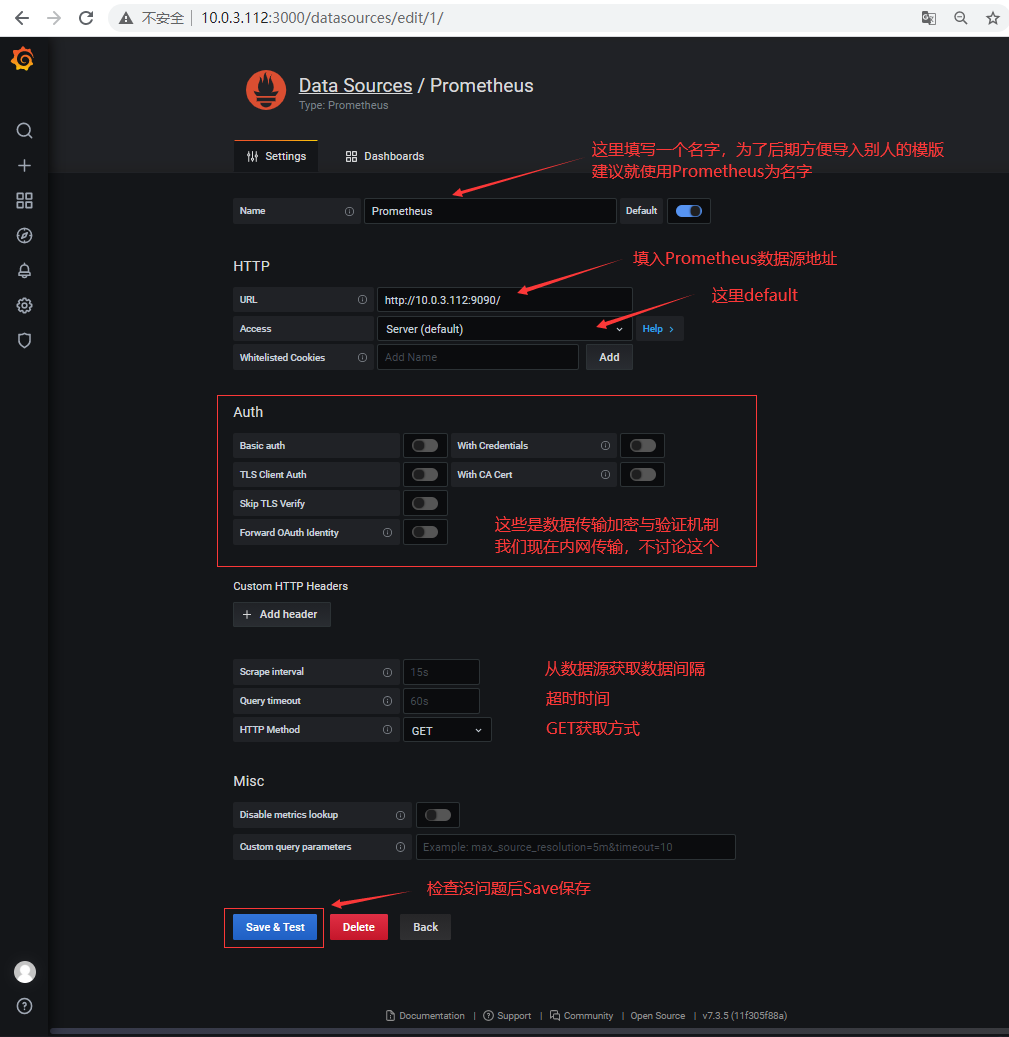
### 7 在Grafana上新增Prometheus資料來源
##### 我們把prometheus伺服器收集的資料做為一個數據源新增到grafana,讓grafana可以得到prometheus的資料

### 8 Grafana圖形顯示Linux硬體資訊
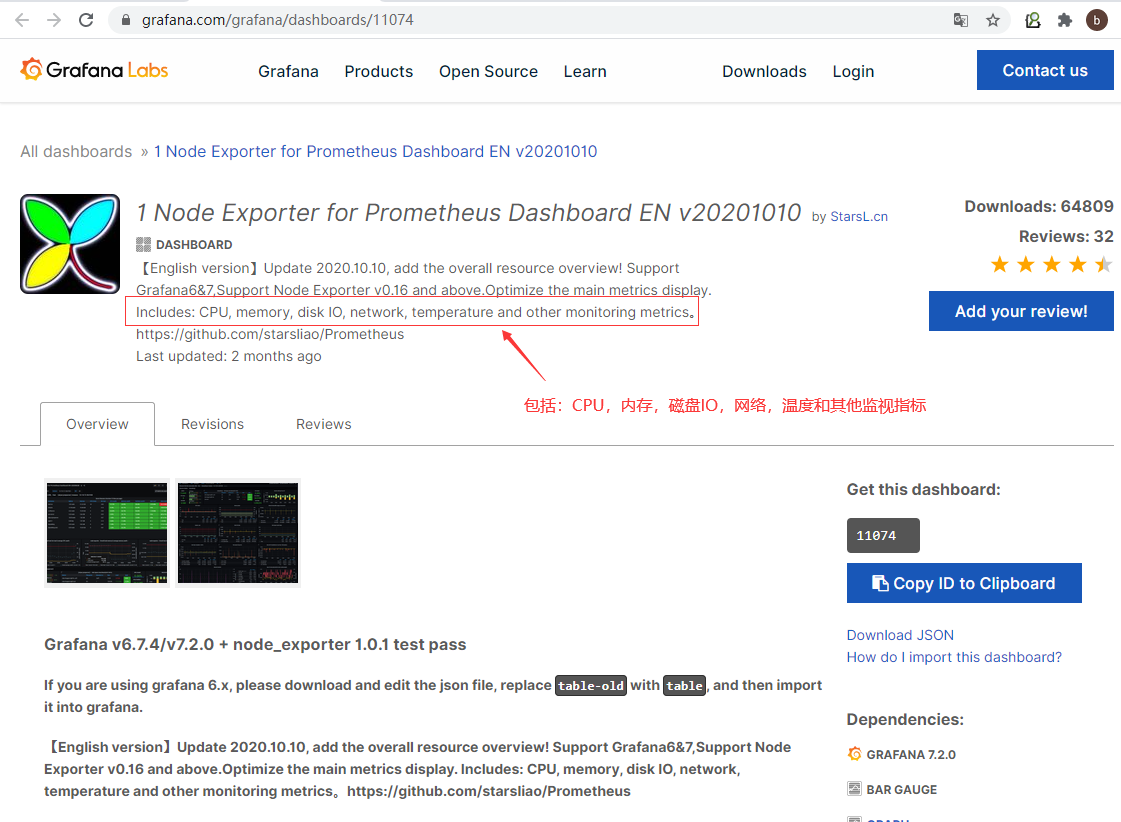
- Grafana官方提供模板地址:https://grafana.com/grafana/dashboards
- 本次要匯入的模板:https://grafana.com/grafana/dashboards/11074
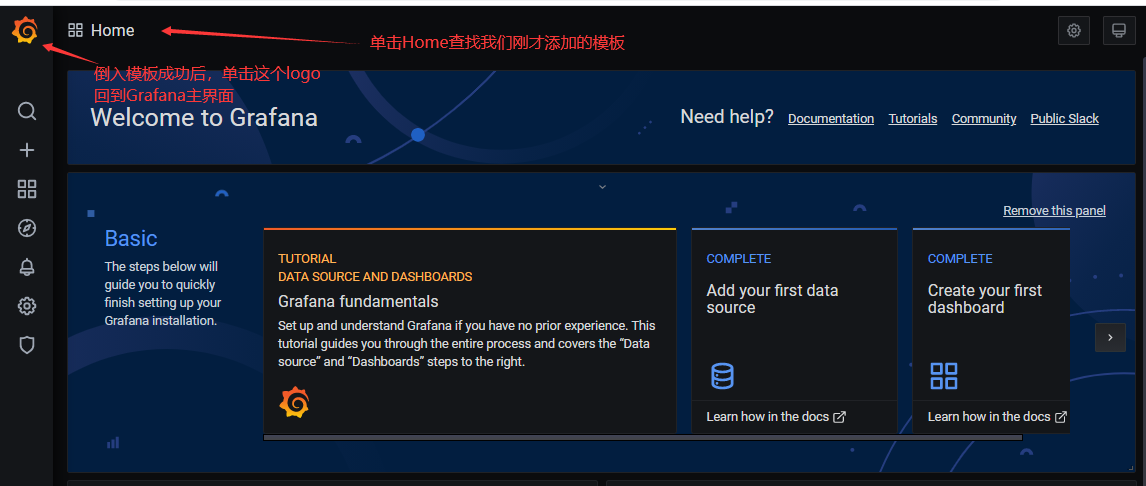
#### 8.1 Grafana匯入監控模板


#### 8.2 選擇匯入成功的模板檢視
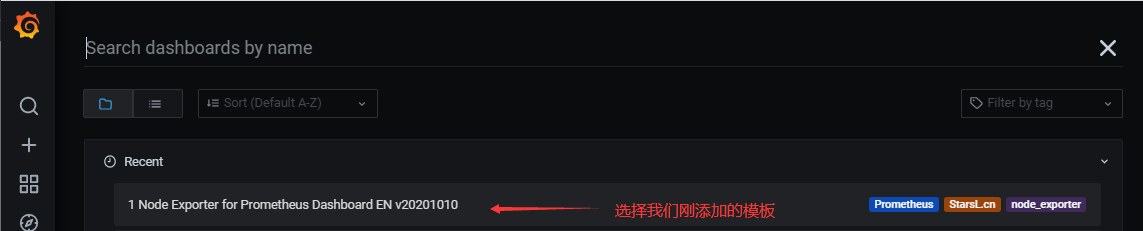
#### 8.3 即可看到逼格非常高的系統主機節點監控資訊
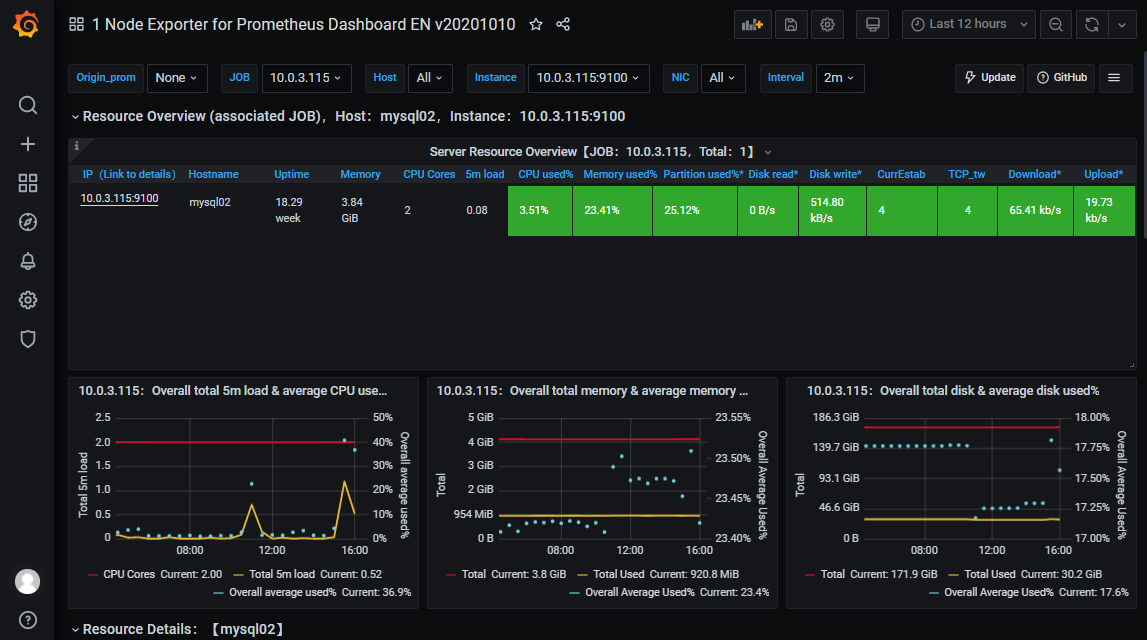
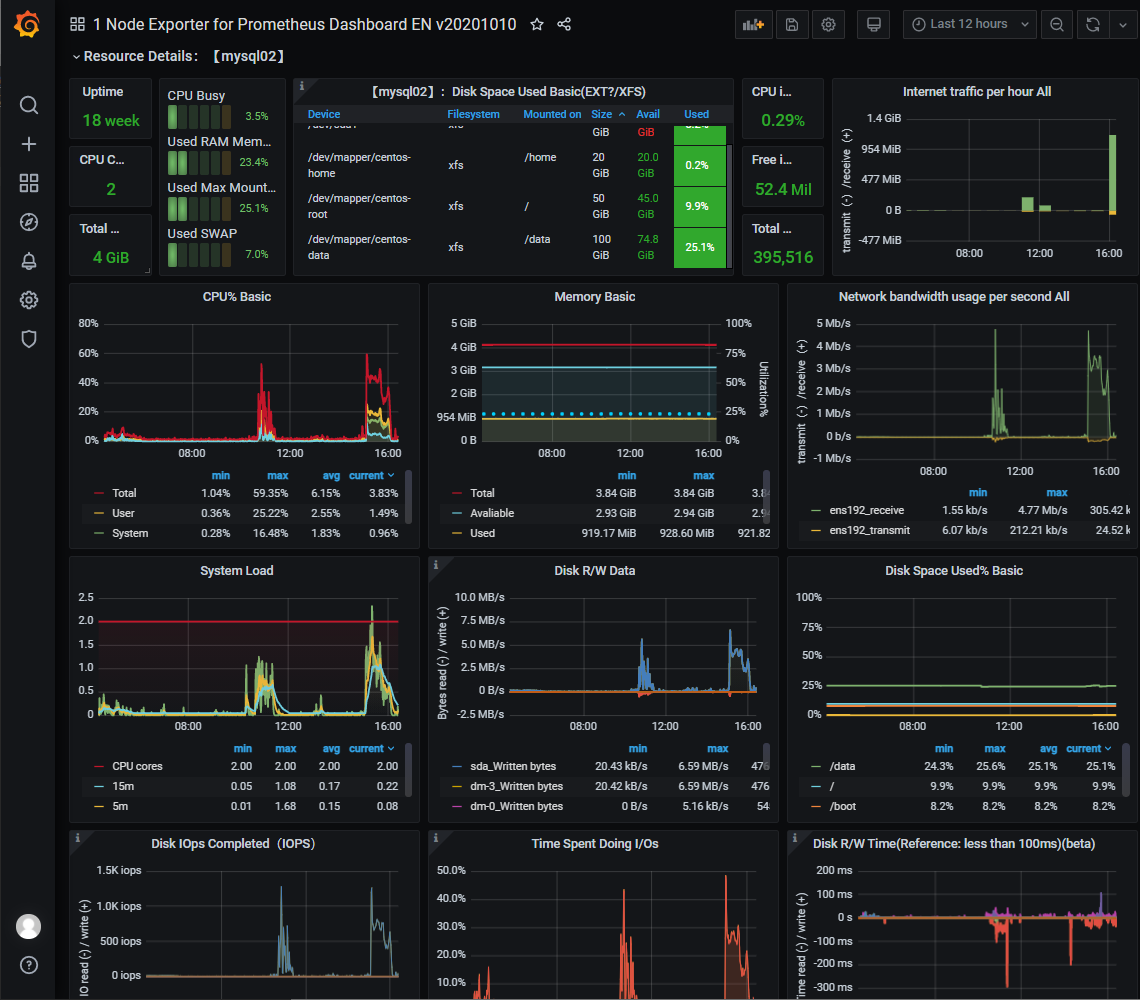
### 9 Grafana圖形顯示MySQL監控資料
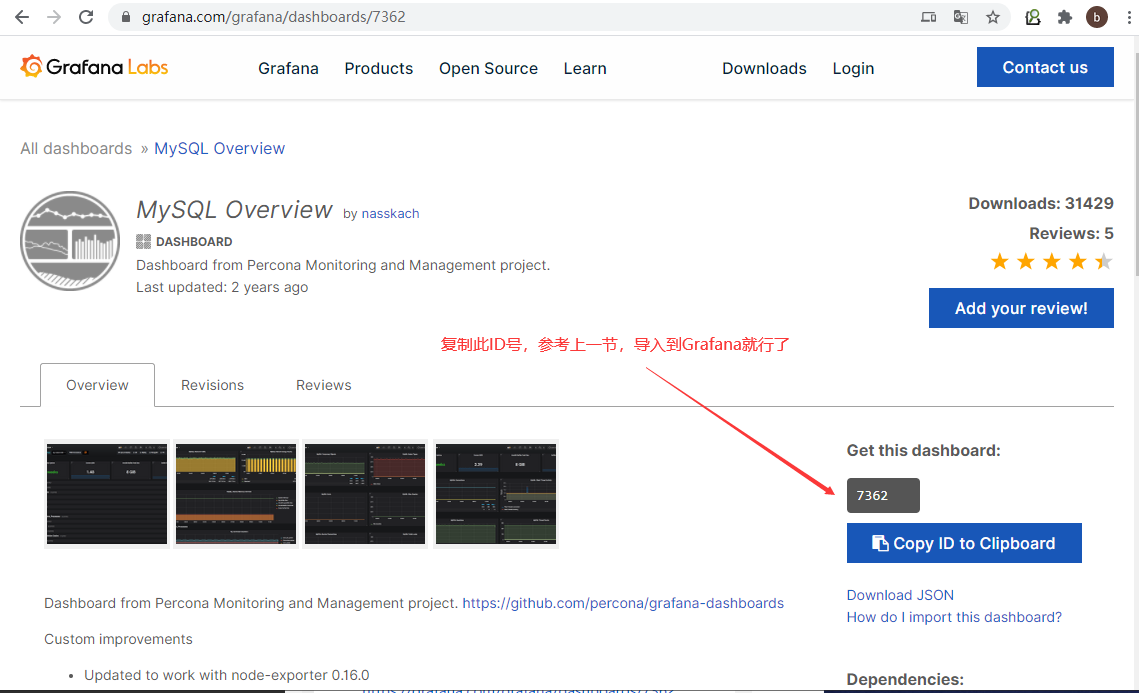
#### 方式一:通過Grafana官網匯入模板
- MySQL監控做的最好當屬percona公司的了
- Grafana官網地址:https://grafana.com/grafana/dashboards/7362
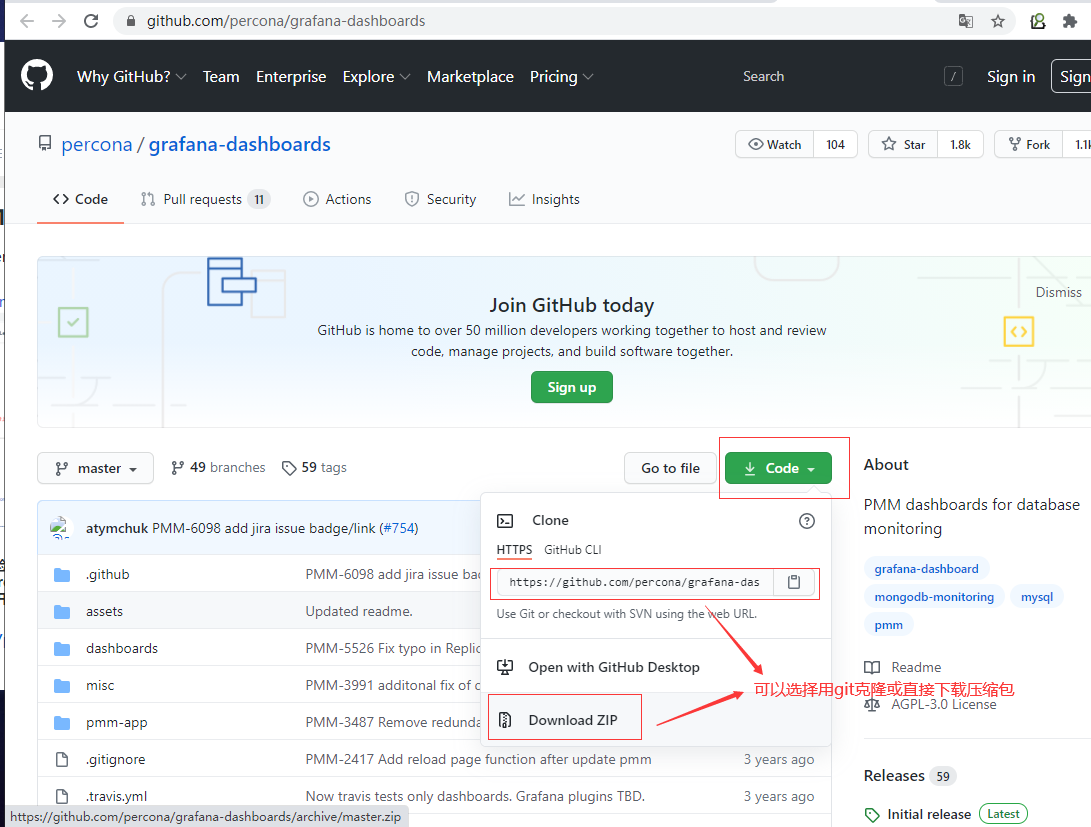
##### 當然,這個更新的不及時,要體驗最新的我們直接去專案地址下載安裝mysql監控的dashboard(包含相關json檔案,這些json檔案可以看作是開發人員開發的一個監控模板)
##### 下載網址: https://github.com/percona/grafana-dashboards
#### 方式二:匯入最新的json檔案
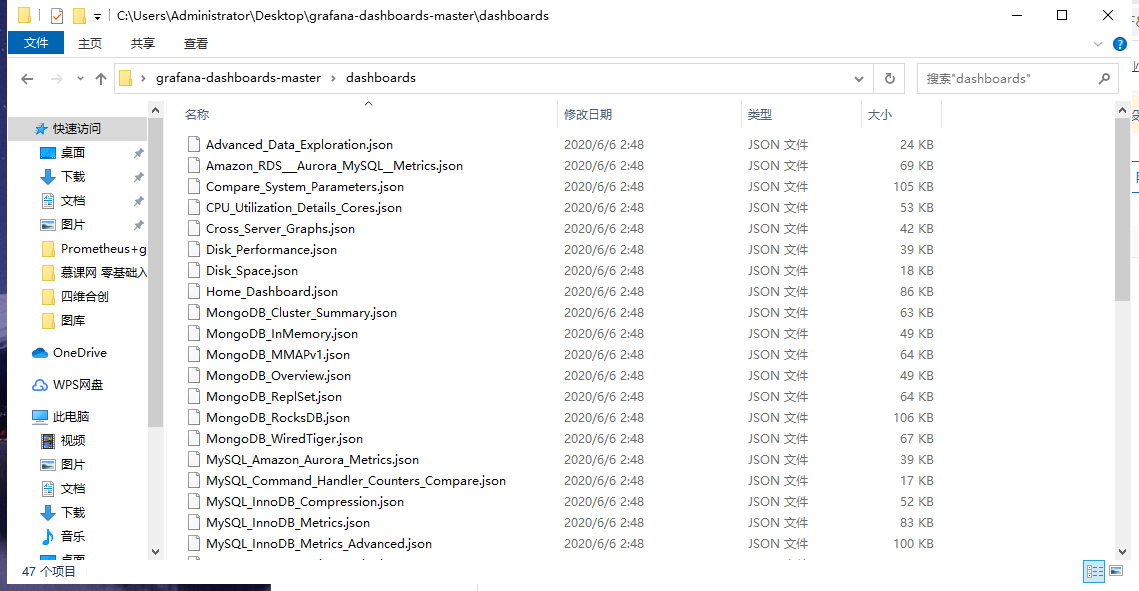
##### 9.2.1 下載最新json檔案包
##### 9.2.2 解壓得到相關JSON檔案
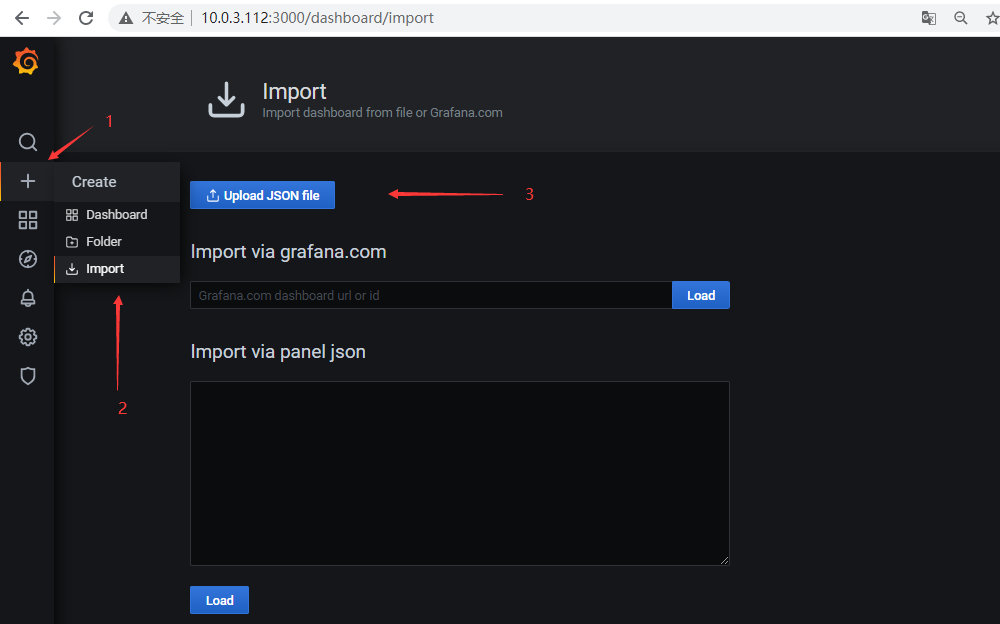
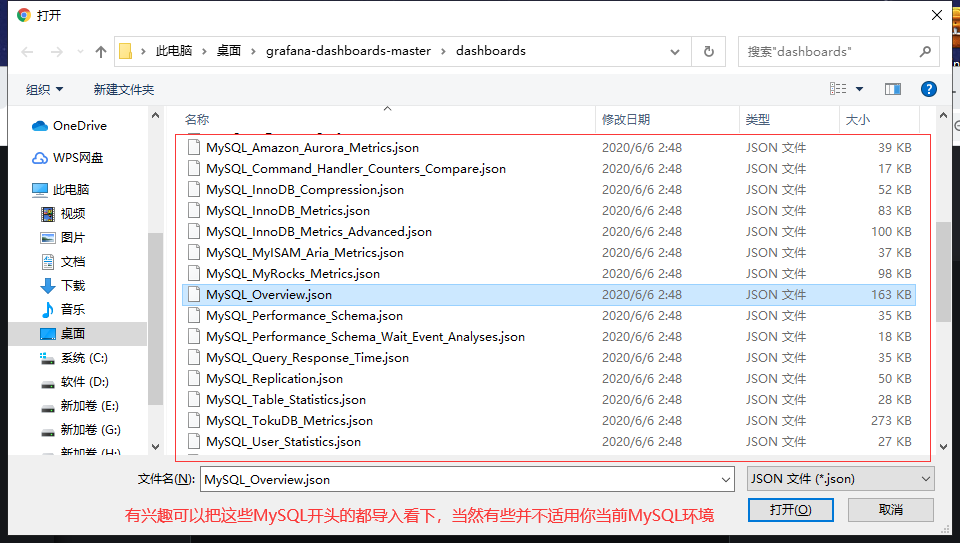
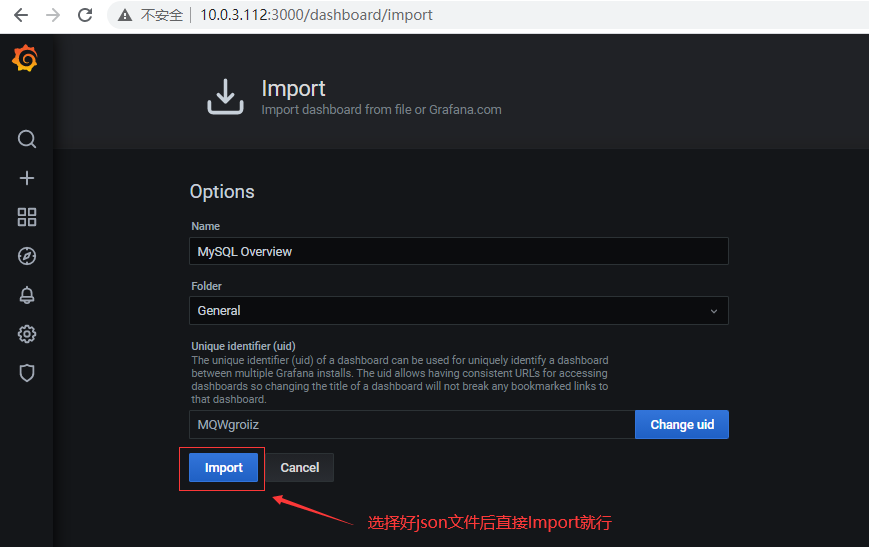
##### 9.2.3 在grafana圖形介面匯入MySQL相關json檔案
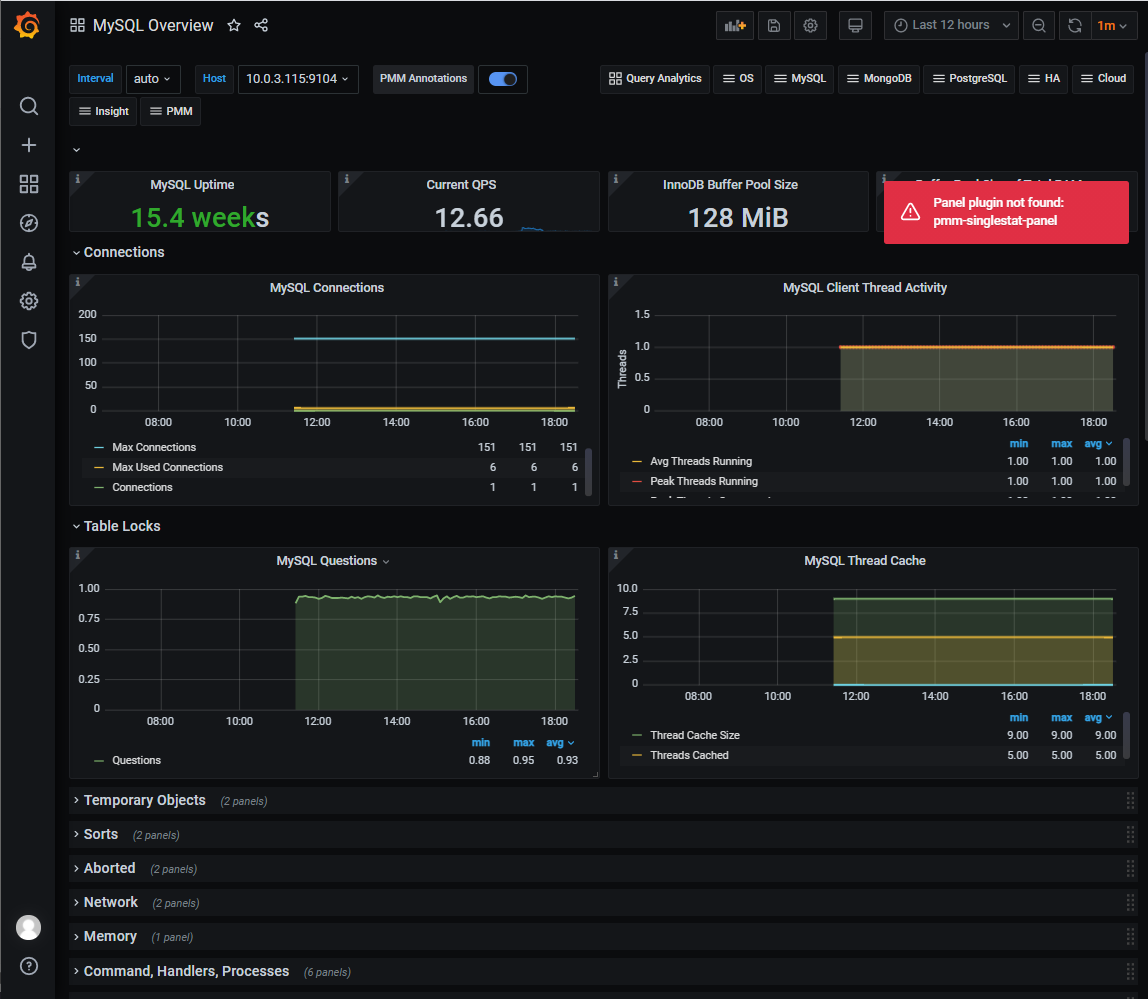
##### 9.2.4 grafana展示MySQL相關資料
1. 沒資料可能是需要等一會,讓資料傳過來。
2. 有些可能是Prometheus沒有采集相關指標。
3. 還有就是需要安裝percona公司外掛解決
### 10 監控報警
#### 具體方案有很多
- prometheus配合alertmanager這個元件報警,報警規則需要手動編寫,這需要對prometheus+alertmanager有一定的瞭解
- grafana配合SaaS模式的雲告警平臺onealert報警,onealert也是需要時間熟悉的
- 這裡演示最傳統的grafana+email報警
#### 10.1 修改grafana配置檔案,添加發件郵箱
```
vim /etc/grafana/grafana.ini # 找到smtp關鍵字
#################################### SMTP / Emailing ##########################
[smtp]
enabled = true # 改成true
host = smtp.exmail.qq.com:465 # 傳送伺服器地址和埠
user = # 這裡填寫發件郵箱
# If the password contains # or ; you have to wrap it with triple quotes. Ex """#password;"""
password = # 這裡填寫發件郵箱密碼或授權密碼
;cert_file =
;key_file =
skip_verify = true # 改成true
from_address = # 這裡填寫發件郵箱
;from_name = Grafana
# EHLO identity in SMTP dialog (defaults to instance_name)
;ehlo_identity = dashboard.example.com
# SMTP startTLS policy (defaults to 'OpportunisticStartTLS')
;startTLS_policy = NoStartTLS
```
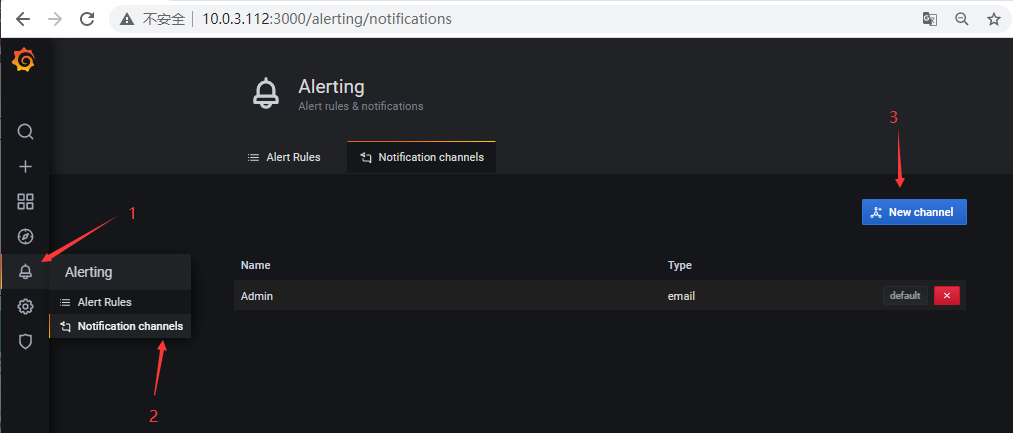
#### 10.2 在通知渠道建立收件人組

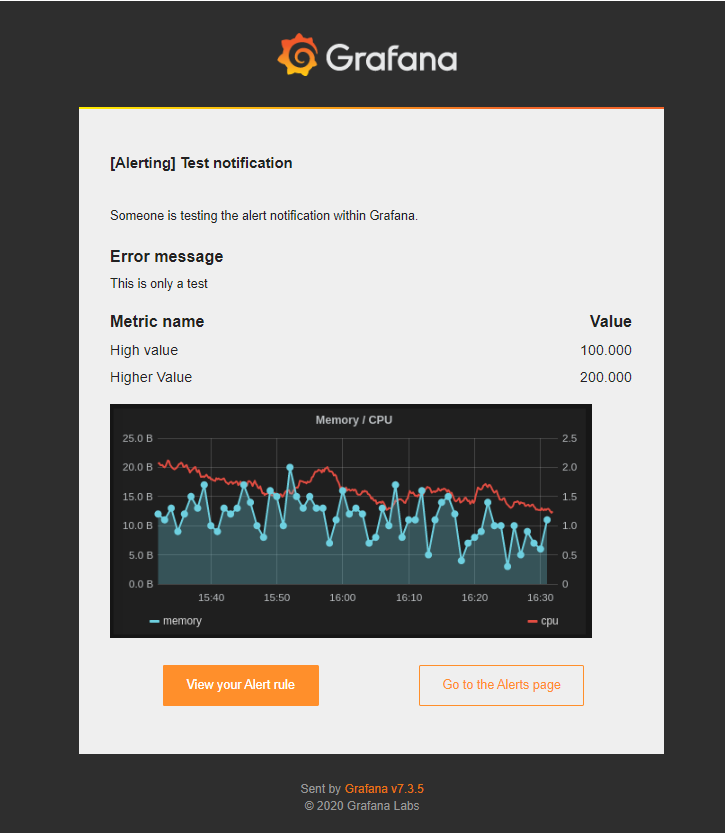
##### 剛才操作都沒問題話將測試郵件
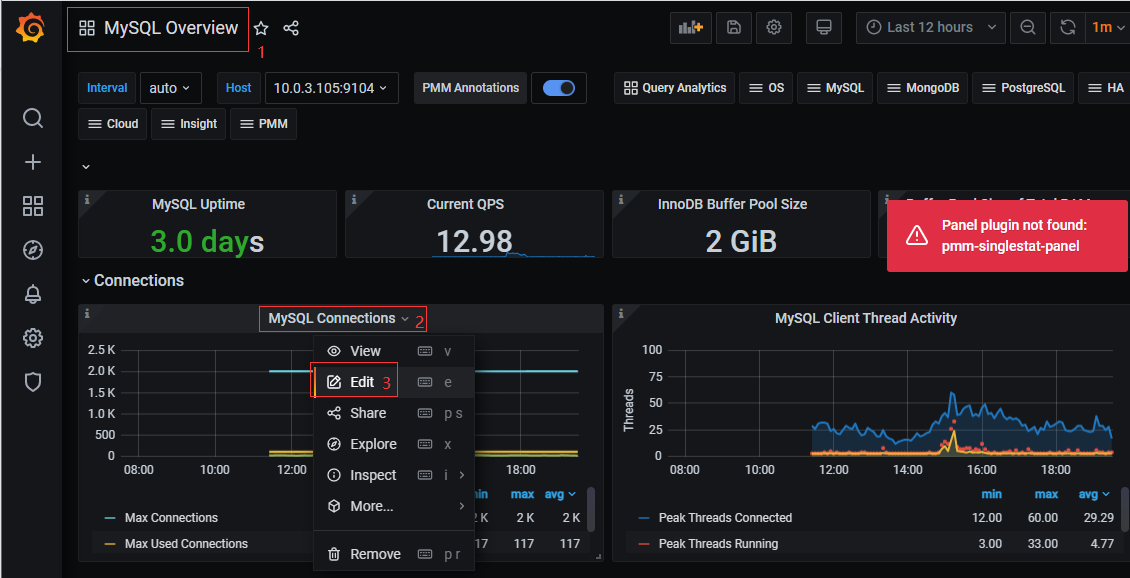
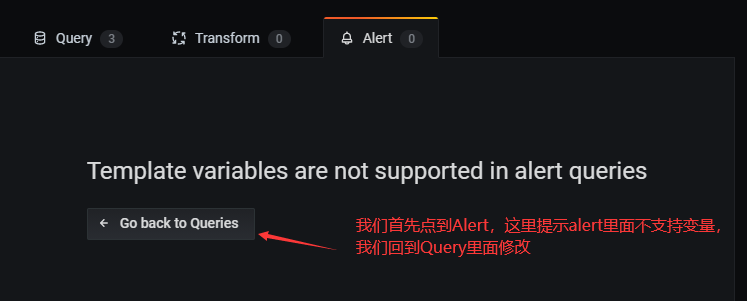
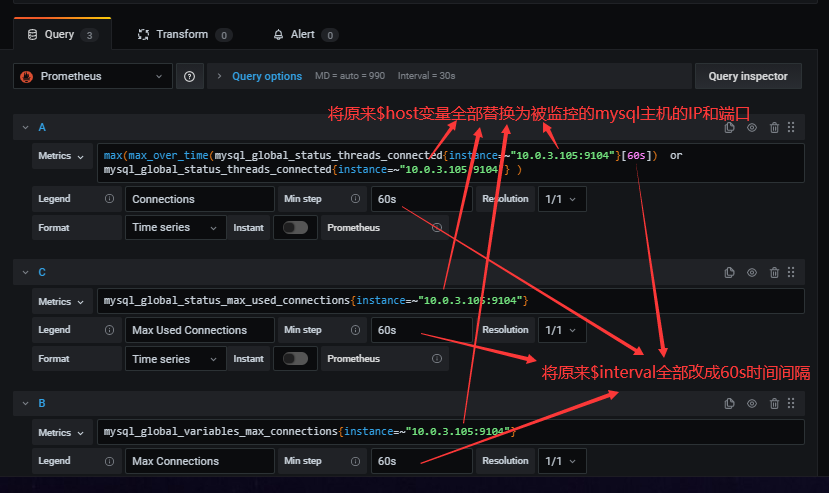
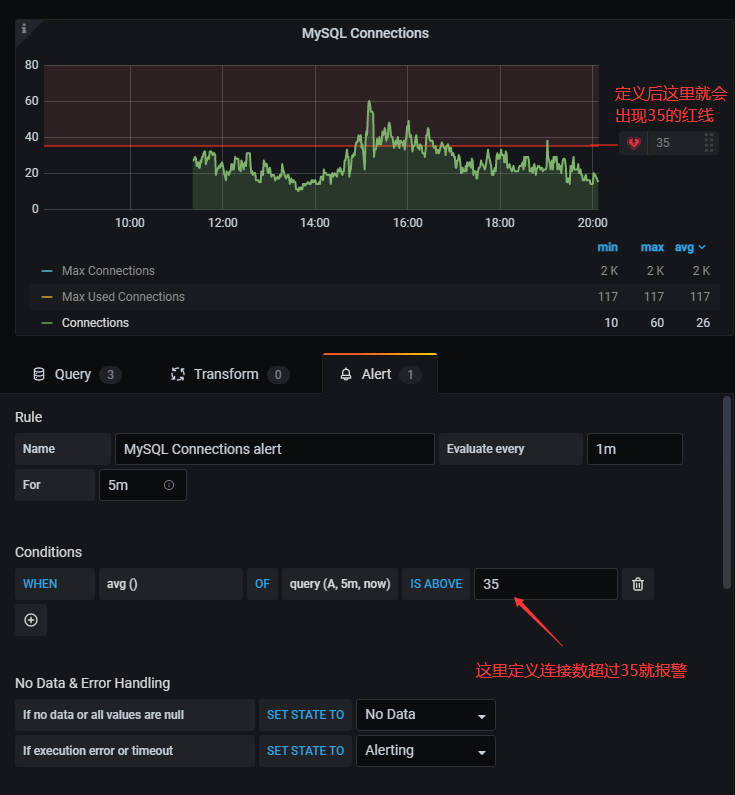
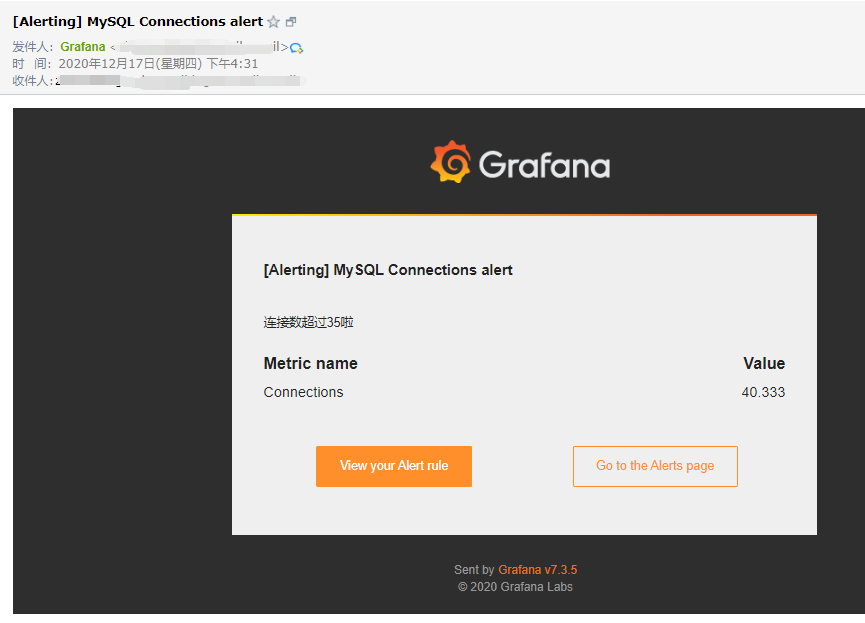
#### 10.3 測試觸發報警
##### 這裡我們以監控mysql連線數來做測試
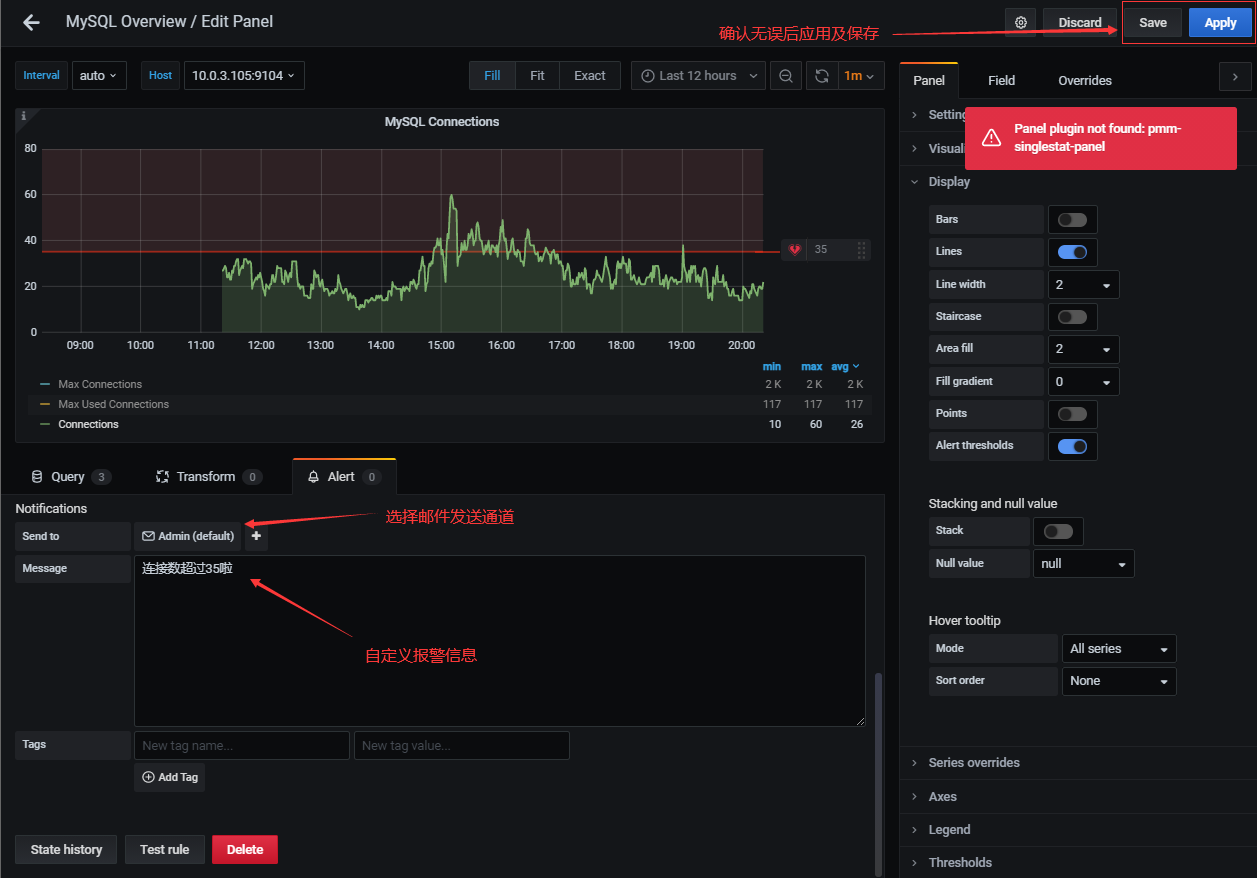
#### 10.4 報警效果
#### 10.5 報警不成功的可能原因
- 各伺服器之間時間不同步,這樣時序資料會出問題,也會造成報警出問題
- 必須寫通知內容,留空內容是不會發報警的
- 修改完報警配置後,記得要點右上角的儲存
- 儲存配置後,需要由OK狀態變為alerting狀態才會報警(也就是說,你配置儲存後,就已經是alerting狀態是不會報警的)
- grafana與郵箱通訊有問題
#### 因為有悔,所以披星戴月;因為有夢,所以奮不顧身! 個人部落格首發:`easydb.net` 微信公眾號:`easydb` 關注我,不走丟!
![image](https://easydb.oss-cn-shenzhen.aliyuncs.com/%E6%89%AB%E7%A0%81_%E6%90%9C%E7%B4%A2%E8%81%94%E5%90%88%E4%BC%A0%E6%92%AD%E6%A0%B7%E5%BC%8F-%E6%A0%87%E5%87%86%E8%89%B2%E7%89