Prometheus+Grafana監控報警系統搭建
阿新 • • 發佈:2019-01-22
1.基本概念
Prometheus
架構圖
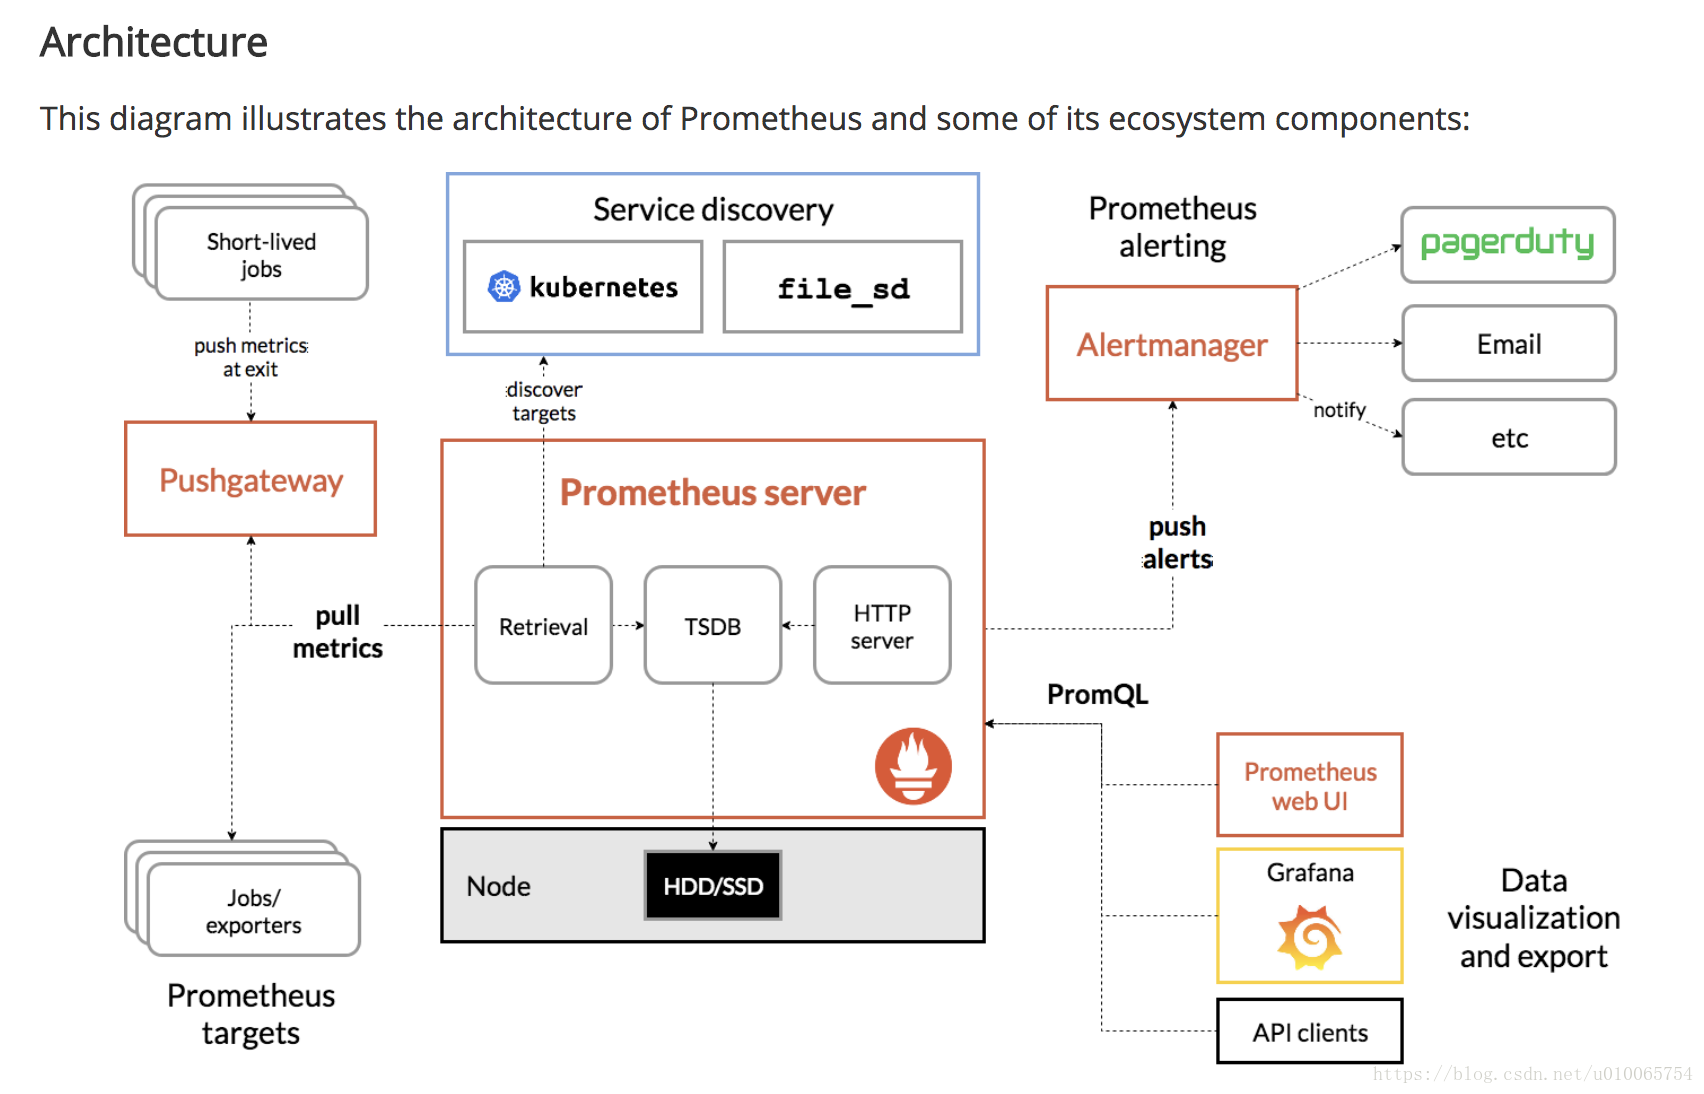
- 工作流程:通過exporters從資料來源主動拉取資料(metrics),儲存到時序資料庫(TSDB)中,可以通過HTTP Server訪問,同時可以發起報警,對於資料庫中的時序資料,提供PromeQL進行查詢,提供給web UI或者視覺化系統Grafana等展示。
Grafana
- 開源的資料分析和監控平臺
- 有不同的dashboards支援不同型別的資料視覺化
Exporters
- 資料採集
- Prometheus從不同的exorters中拉取資料,有不同的exporter支援不同的資料來源
- node-exporter 支援機器基本的資料 比如cpu mem 網路 等
2. 搭建步驟
安裝Prometheus
下載
– 官網下載(https://prometheus.io/)支援LInux、Mac、Windows系統,我這裡安裝Mac
– Mac 下載發行版為darwin版
– 下載後解壓, 進入目錄 prometheus-2.3.2.darwin-amd64:啟動
# Start Prometheus.
# By default, Prometheus stores its database in ./data (flag --storage.tsdb.path).
./prometheus --config.file=prometheus.yml - 訪問
– 預設埠為:9090
– 瀏覽器訪問:localhost:9090
– 出現以下介面,表示安裝成功
安裝Node-exporter
下載
– 官網下載(https://github.com/prometheus) 找到node-exporter
– 解壓,進入目錄:node_exporter-0.16.0.darwin-amd64啟動
./node_exporter 使用
– 預設監控9100埠,可以web 瀏覽器中開啟localhost:9100 or localhost:9100/metrics 可以檢視是否有資料,有就表示安裝成功,接下來需要配置到Prometheus中。配置Prometheus
# 開啟Promethues配置檔案,新增targets配置
$ vim prometheus.yml
# A scrape configuration containing exactly one endpoint to scrape:
# Here it's Prometheus itself.
scrape_configs:
# The job name is added as a label `job=<job_name>` to any timeseries scraped from this config.
- job_name: 'prometheus'
# metrics_path defaults to '/metrics'
# scheme defaults to 'http'.
static_configs:
- targets: ['localhost:9090']
# add config of node-exporter
- job_name: 'node-exporter'
# metrics_path defaults to '/metrics'
# scheme defaults to 'http'.
static_configs:
- targets: ['localhost:9100']- 重啟Prometheus 服務
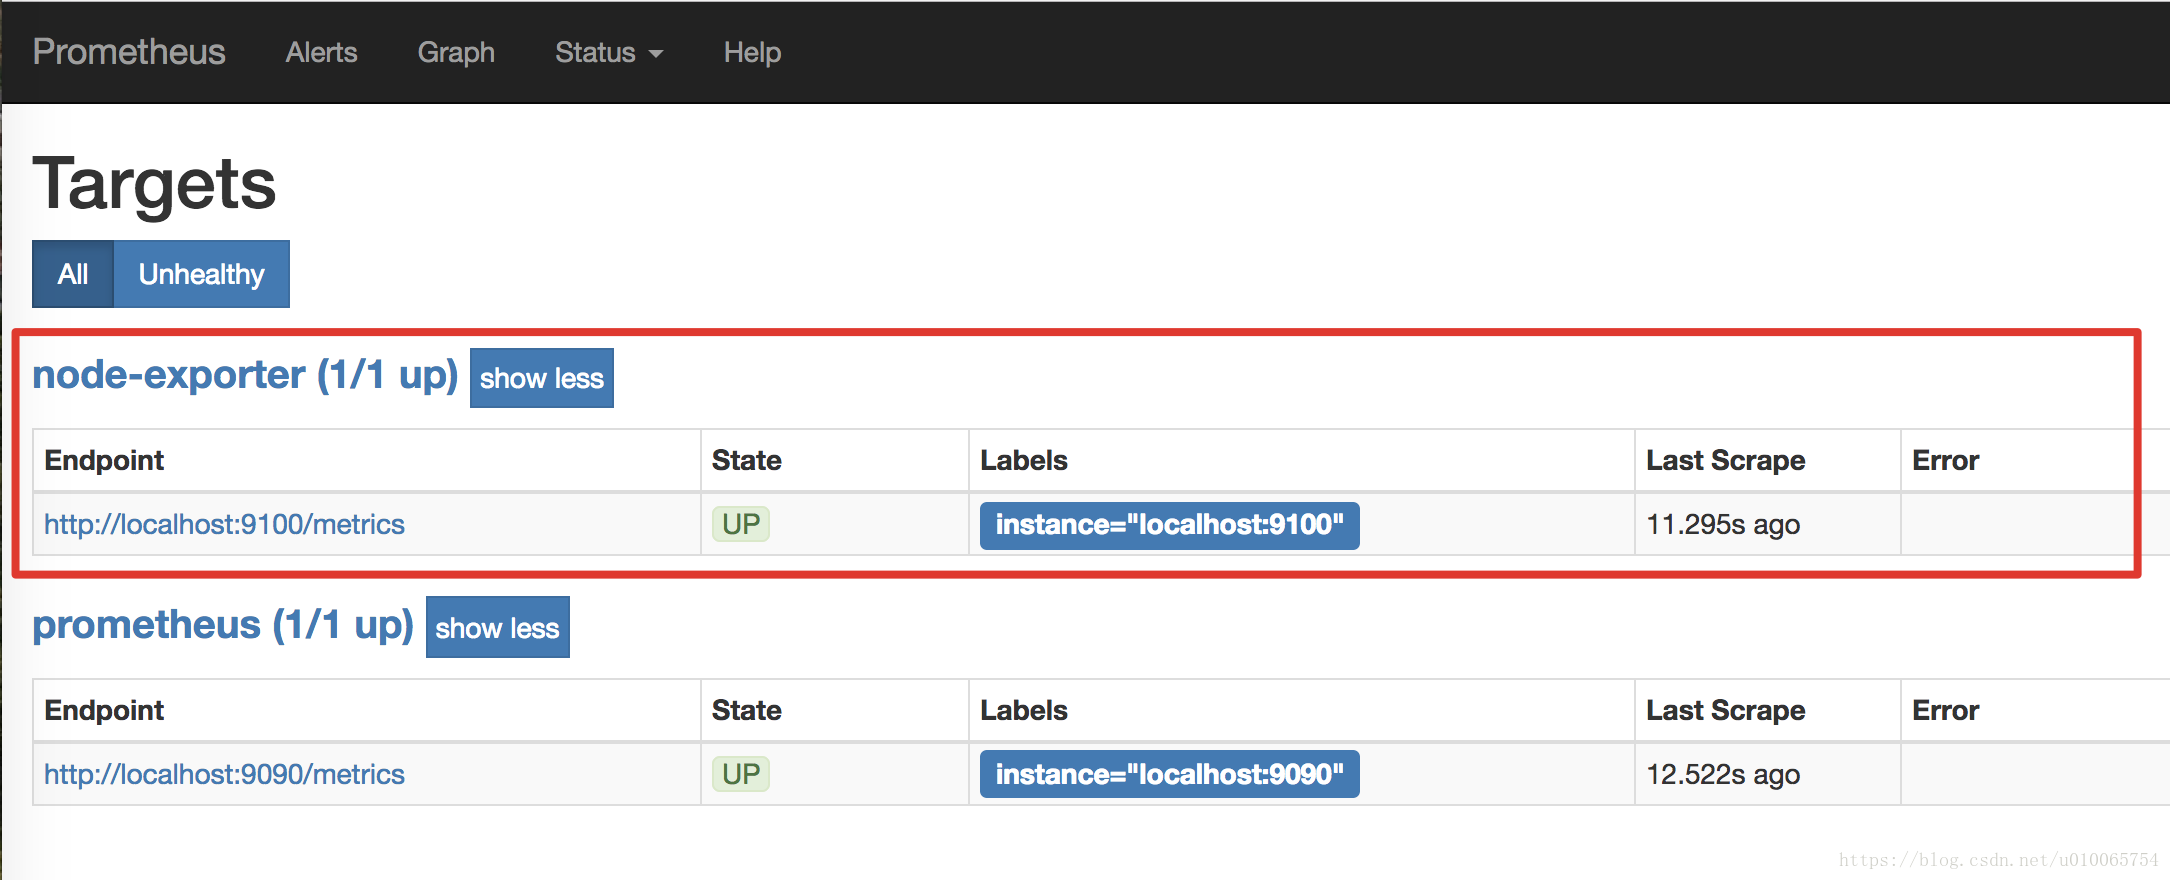
– 在瀏覽器中訪問:http://localhost:9090/targets
– 可以看到有兩個endpoint,9090是prometheus的監聽埠,9100是我們新增的node-exporter,看到兩個狀態都是UP,就表示node-exporter已經新增到Prometheus中了。
安裝Grafana
啟動
./bin/grafana-server web訪問
– 預設埠3000,可以用瀏覽器訪問:localhost:3000
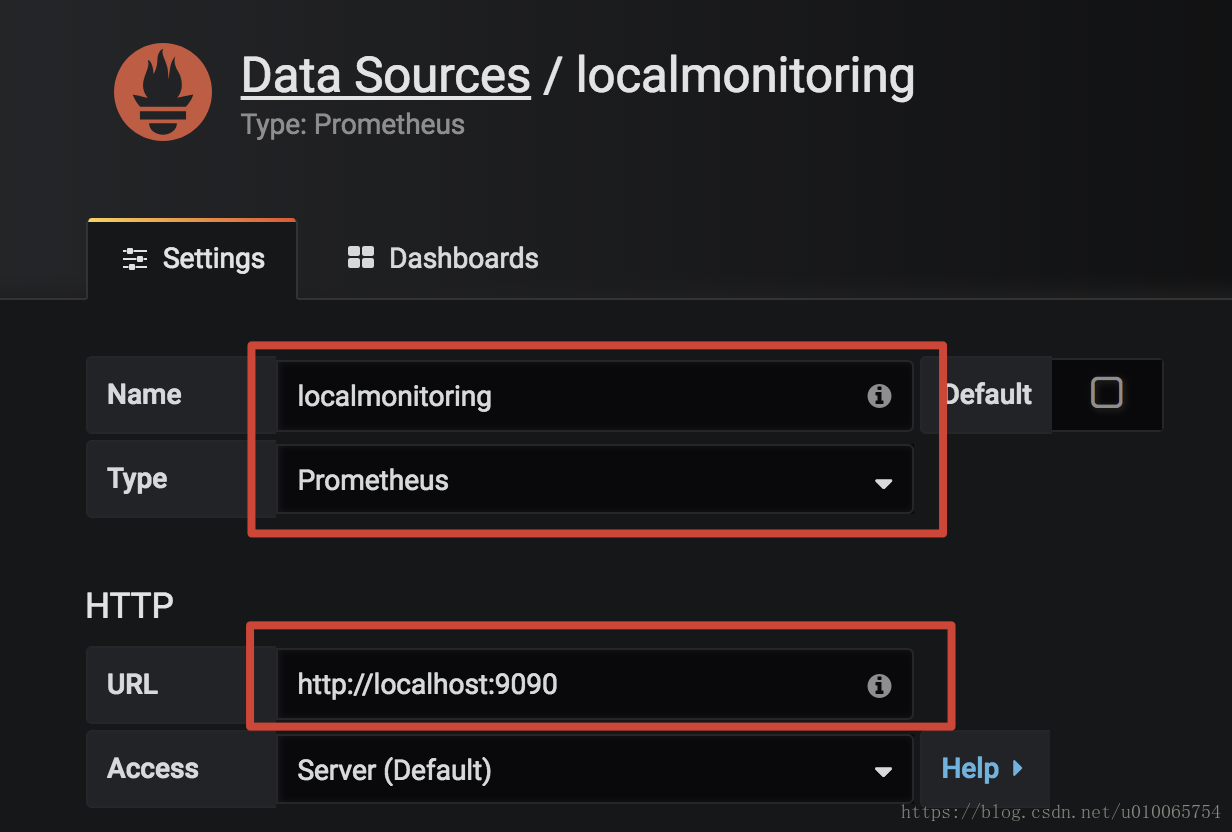
– 預設登入賬號:admin/admin新增資料來源
– Type選擇 Prometheus,其他自己填
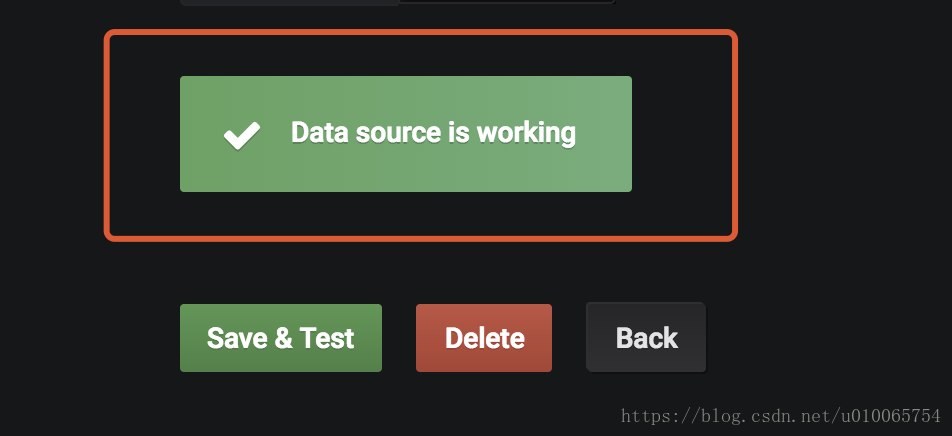
– 點選Save & Test,看到Data source is working,就表示新增成功了。新增Dashboard
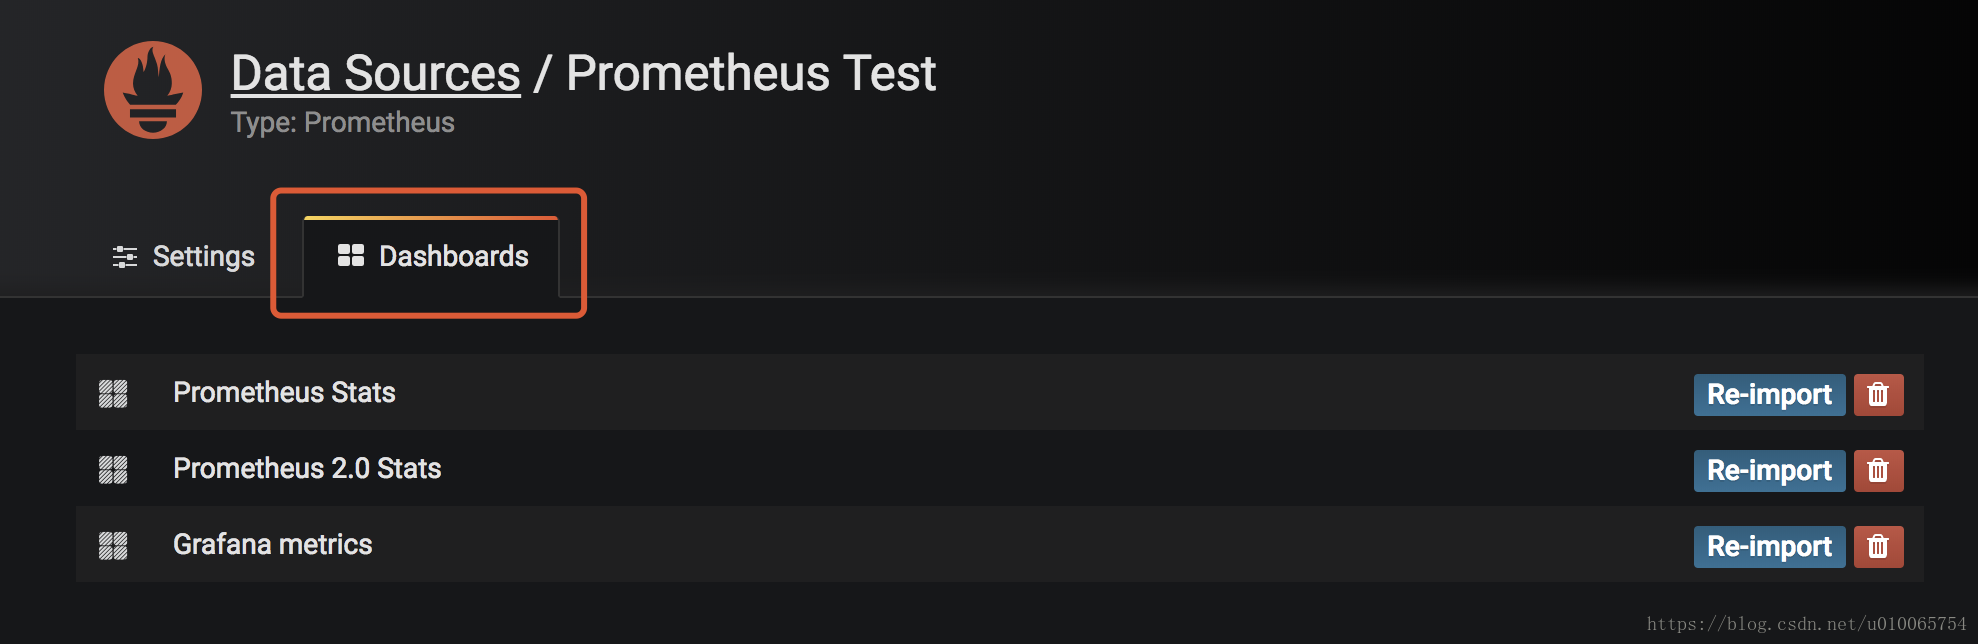
– 將資料來源合適的展示出來,就需要新增相應的dashboard
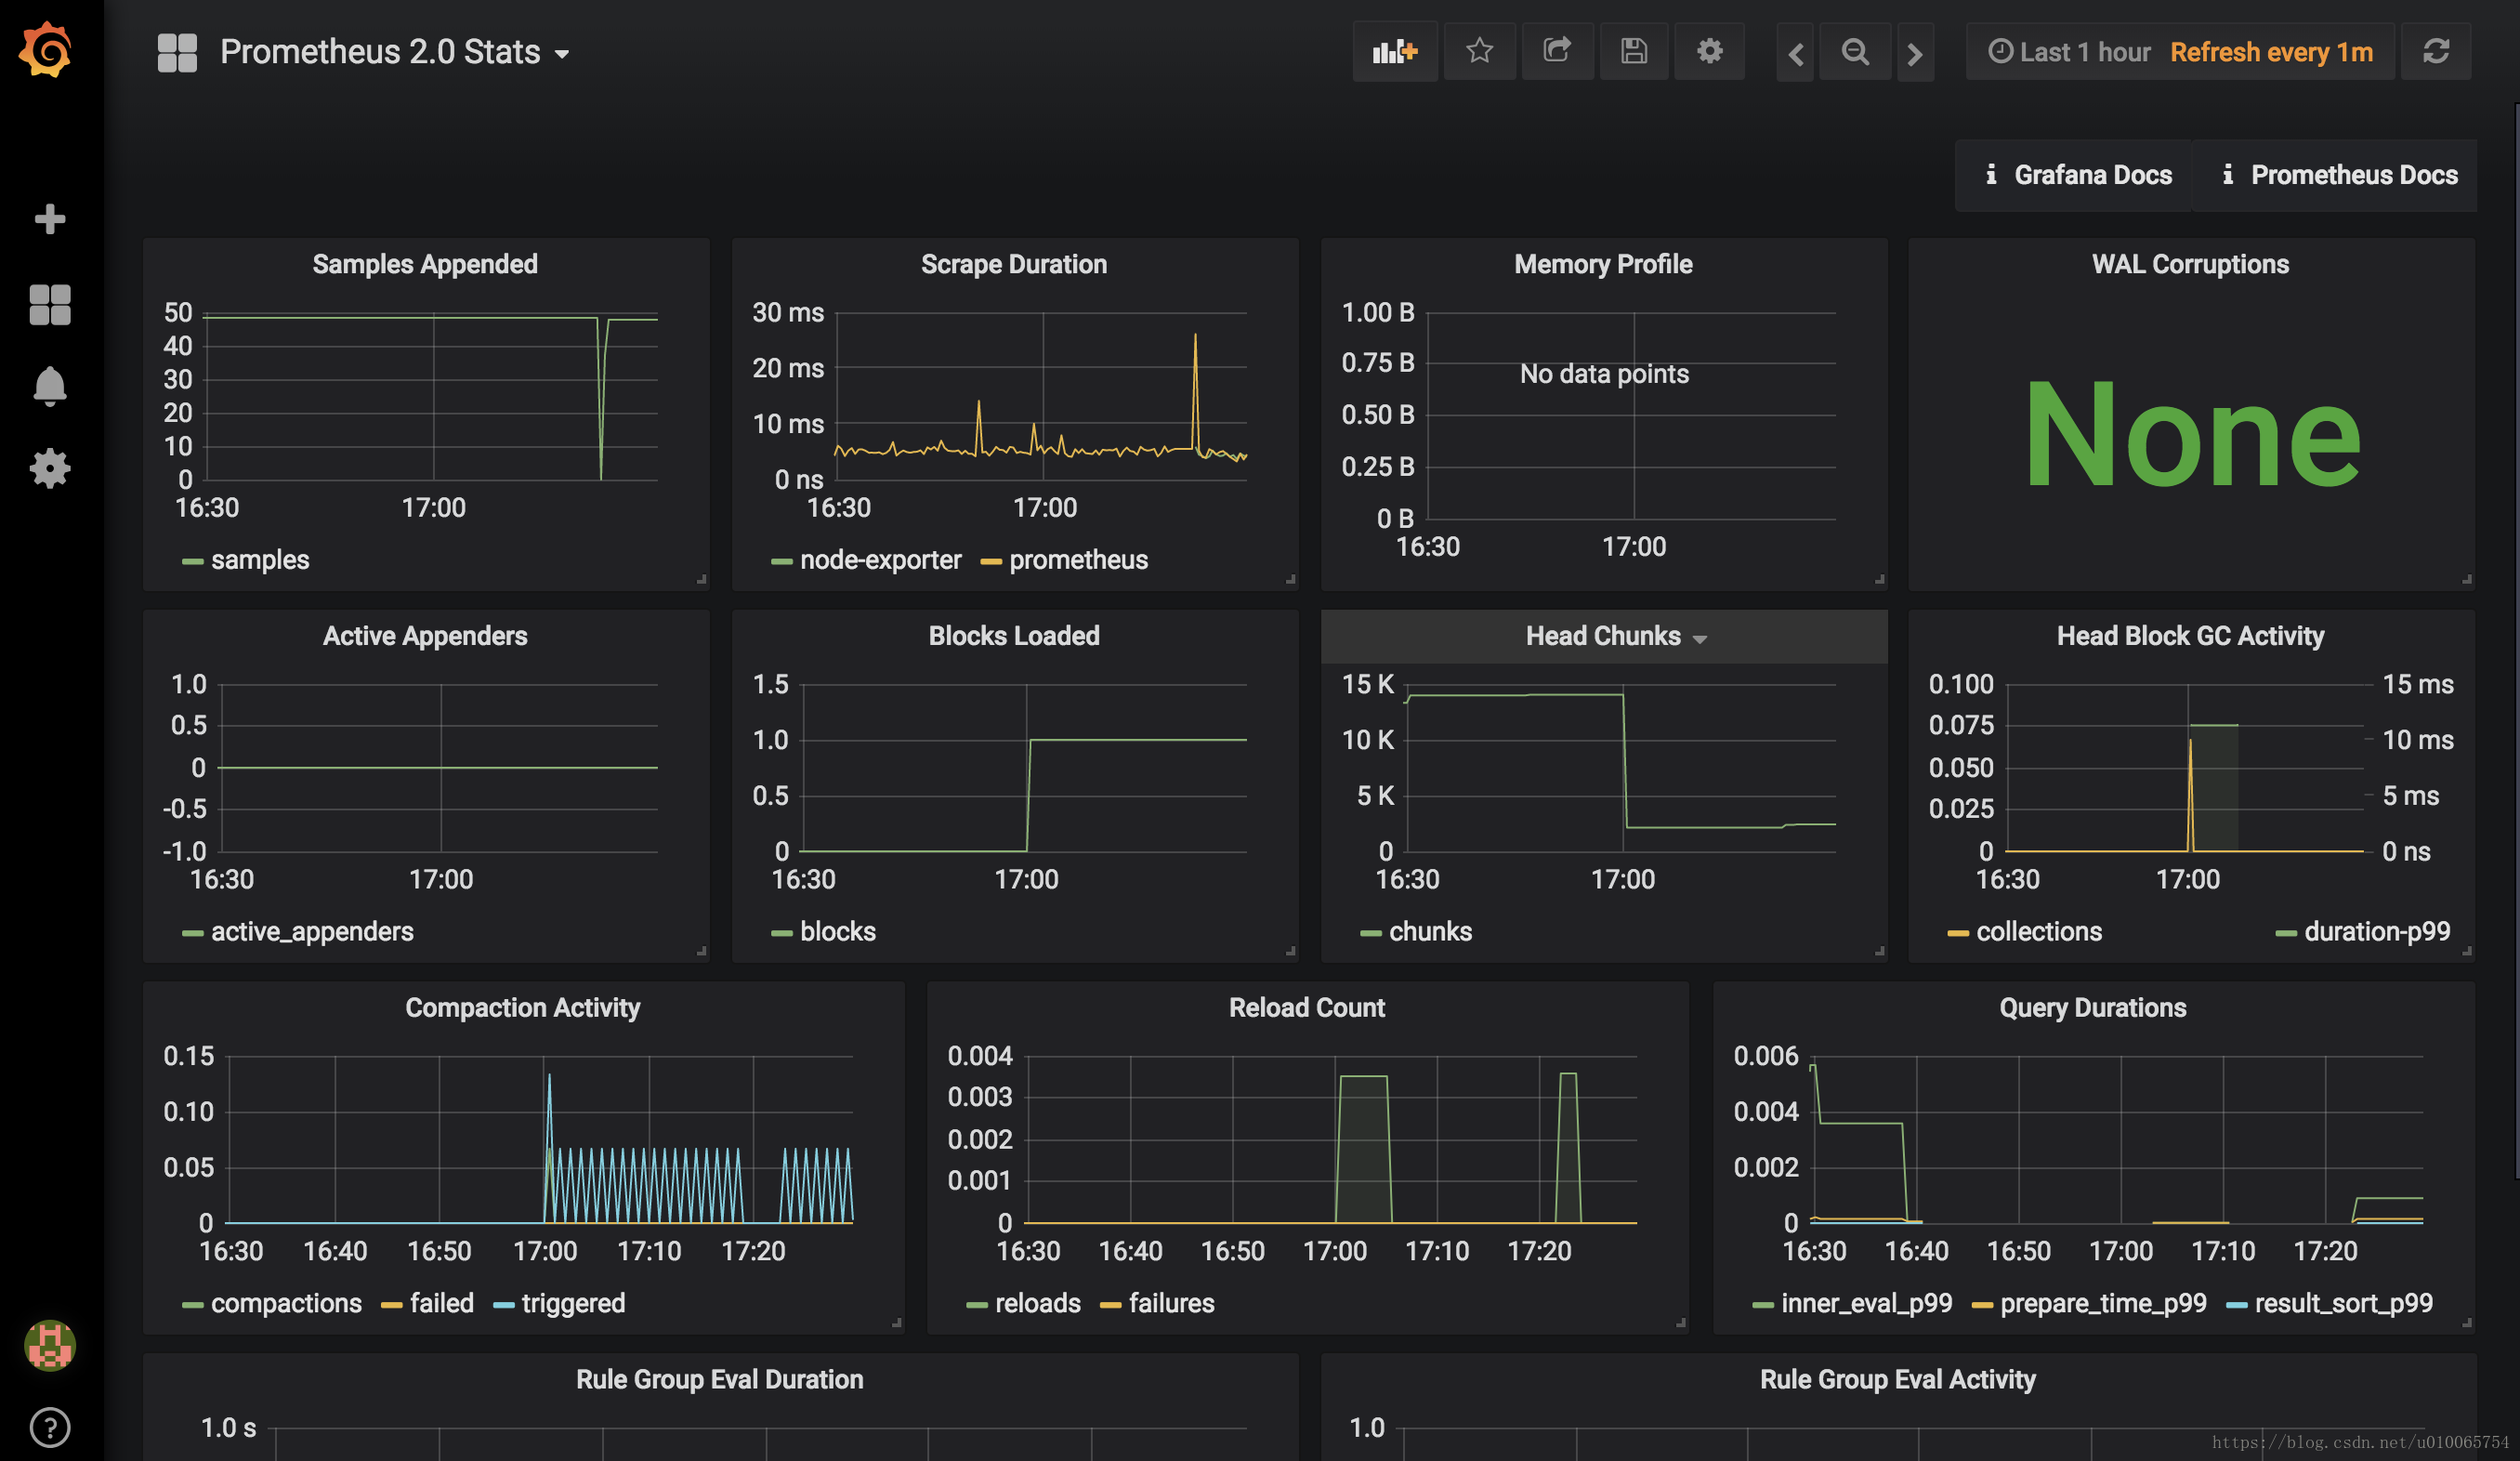
– 選擇你喜歡的模板,import,這裡我三種提供的都import過。- 檢視Dashboard
成功!! 撒花!!