
Python matplotib 畫圖
阿新 • • 發佈:2017-06-11
close example ext current lower -- des art mar 
使用Python 程序來生成可視化圖像,具有明確的表達性。
demo1:曲線圖和直線圖

#!/usr/bin/env python
# -*- coding: utf-8 -*-

import numpy as np
import matplotlib.pyplot as plt

t = np.arange(0.0, 1.01, 0.01)
s = np.sin(2*2*np.pi*t)

plt.fill(t, s*np.exp(-5*t), ‘r‘)
plt.grid(True)

#保存為PDF格式,也可保存為PNG等圖形格式
plt.savefig(‘test.png‘)
plt.show()
View Code

import numpy as np import matplotlib.pyplot as plt x=np.linspace(0,10,1000) y=np.sin(x) z=np.cos(x**2) plt.figure(figsize=(8,4)) plt.plot(x,y,label=‘$sin(x)$‘,color=‘red‘,linewidth=2) plt.plot(x,z,‘g--‘,label=‘$cos(x^2)$‘,lw=3) plt.xlabel(‘Time(s)‘) plt.ylabel(‘volt‘) plt.title(‘First python firgureView Code‘) plt.ylim(-1.2,1.2) plt.legend() plt.savefig("test.png") plt.show()

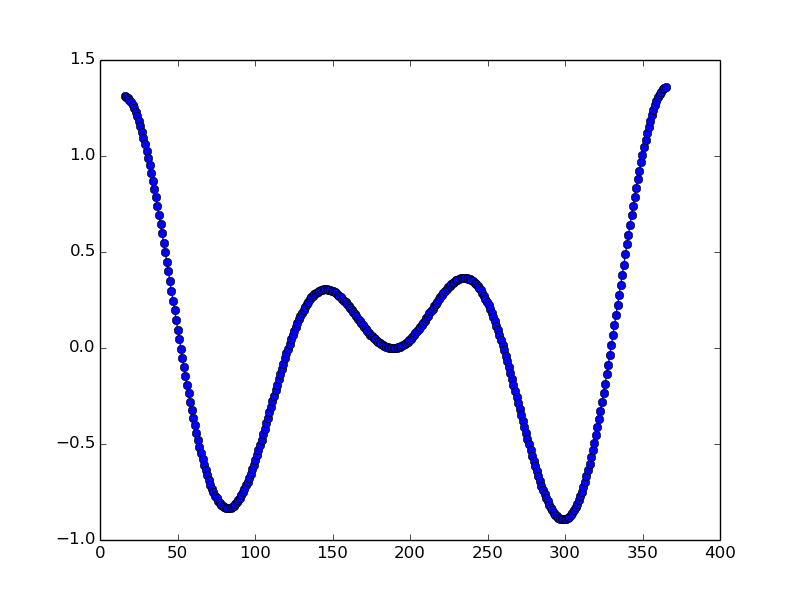
import numpy as np import matplotlib.pyplot as plt # A class that will downsample the data and recompute when zoomed. class DataDisplayDownsampler(object): def __init__(self, xdata, ydata): self.origYDataView Code= ydata self.origXData = xdata self.ratio = 5 self.delta = xdata[-1] - xdata[0] def downsample(self, xstart, xend): # Very simple downsampling that takes the points within the range # and picks every Nth point mask = (self.origXData > xstart) & (self.origXData < xend) xdata = self.origXData[mask] xdata = xdata[::self.ratio] ydata = self.origYData[mask] ydata = ydata[::self.ratio] return xdata, ydata def update(self, ax): # Update the line lims = ax.viewLim if np.abs(lims.width - self.delta) > 1e-8: self.delta = lims.width xstart, xend = lims.intervalx self.line.set_data(*self.downsample(xstart, xend)) ax.figure.canvas.draw_idle() # Create a signal xdata = np.linspace(16, 365, 365-16) ydata = np.sin(2*np.pi*xdata/153) + np.cos(2*np.pi*xdata/127) d = DataDisplayDownsampler(xdata, ydata) fig, ax = plt.subplots() # Hook up the line d.line, = ax.plot(xdata, ydata, ‘o-‘) ax.set_autoscale_on(False) # Otherwise, infinite loop # Connect for changing the view limits ax.callbacks.connect(‘xlim_changed‘, d.update) plt.savefig("test.png") plt.show()
#!/usr/bin/env python
# -*- coding: utf-8 -*-
import numpy as np
import matplotlib.pyplot as plt
plt.figure(1) # 創建圖表1
plt.figure(2) # 創建圖表2
ax1 = plt.subplot(211) # 在圖表2中創建子圖1
ax2 = plt.subplot(212) # 在圖表2中創建子圖2
x = np.linspace(0, 3, 100)
for i in xrange(5):
    plt.figure(1)  #? # 選擇圖表1
    plt.plot(x, np.exp(i*x/3))
    plt.sca(ax1)   #? # 選擇圖表2的子圖1
    plt.plot(x, np.sin(i*x))
    plt.sca(ax2)  # 選擇圖表2的子圖2
    plt.plot(x, np.cos(i*x))
plt.savefig("test.png")
plt.show()
View Code

import matplotlib.pyplot as plt
X1 = range(0, 50)
Y1 = [num**2 for num in X1] # y = x^2
X2 = [0, 1]
Y2 = [0, 1]  # y = x
Fig = plt.figure(figsize=(8,4))                      # Create a `figure‘ instance
Ax = Fig.add_subplot(111)               # Create a `axes‘ instance in the figure
Ax.plot(X1, Y1, X2, Y2)                 # Create a Line2D instance in the axes
Fig.show()
Fig.savefig("test.png"
View Code

import numpy as np
import pylab as pl
x = [1, 2, 3, 4, 5]# Make an array of x values
y = [1, 4, 9, 16, 25]# Make an array of y values for each x value
pl.plot(x, y)# use pylab to plot x and y
pl.show()# show the plot on the screen
View Code

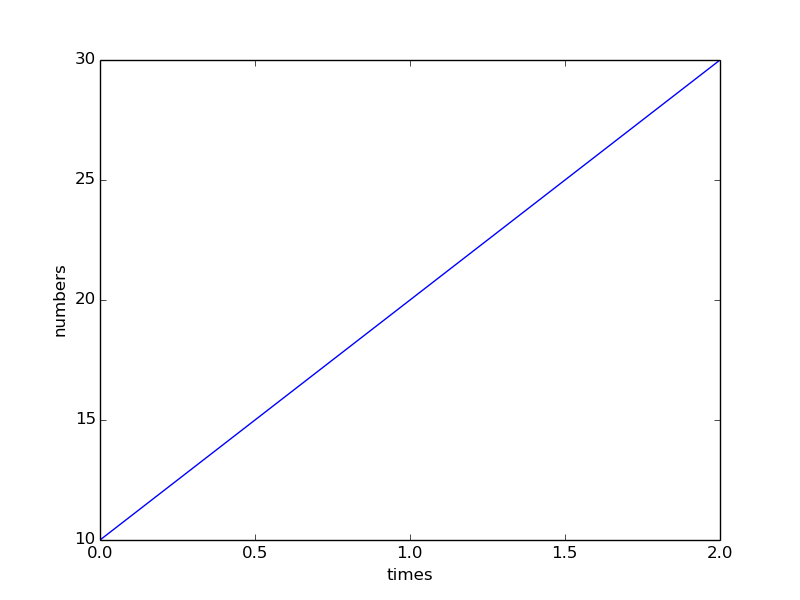
#!/usr/bin/env python
import matplotlib.pyplot as plt

plt.plot([10, 20, 30])
plt.xlabel(‘times‘)
plt.ylabel(‘numbers‘)
plt.savefig("test.png")
plt.show()
View Code
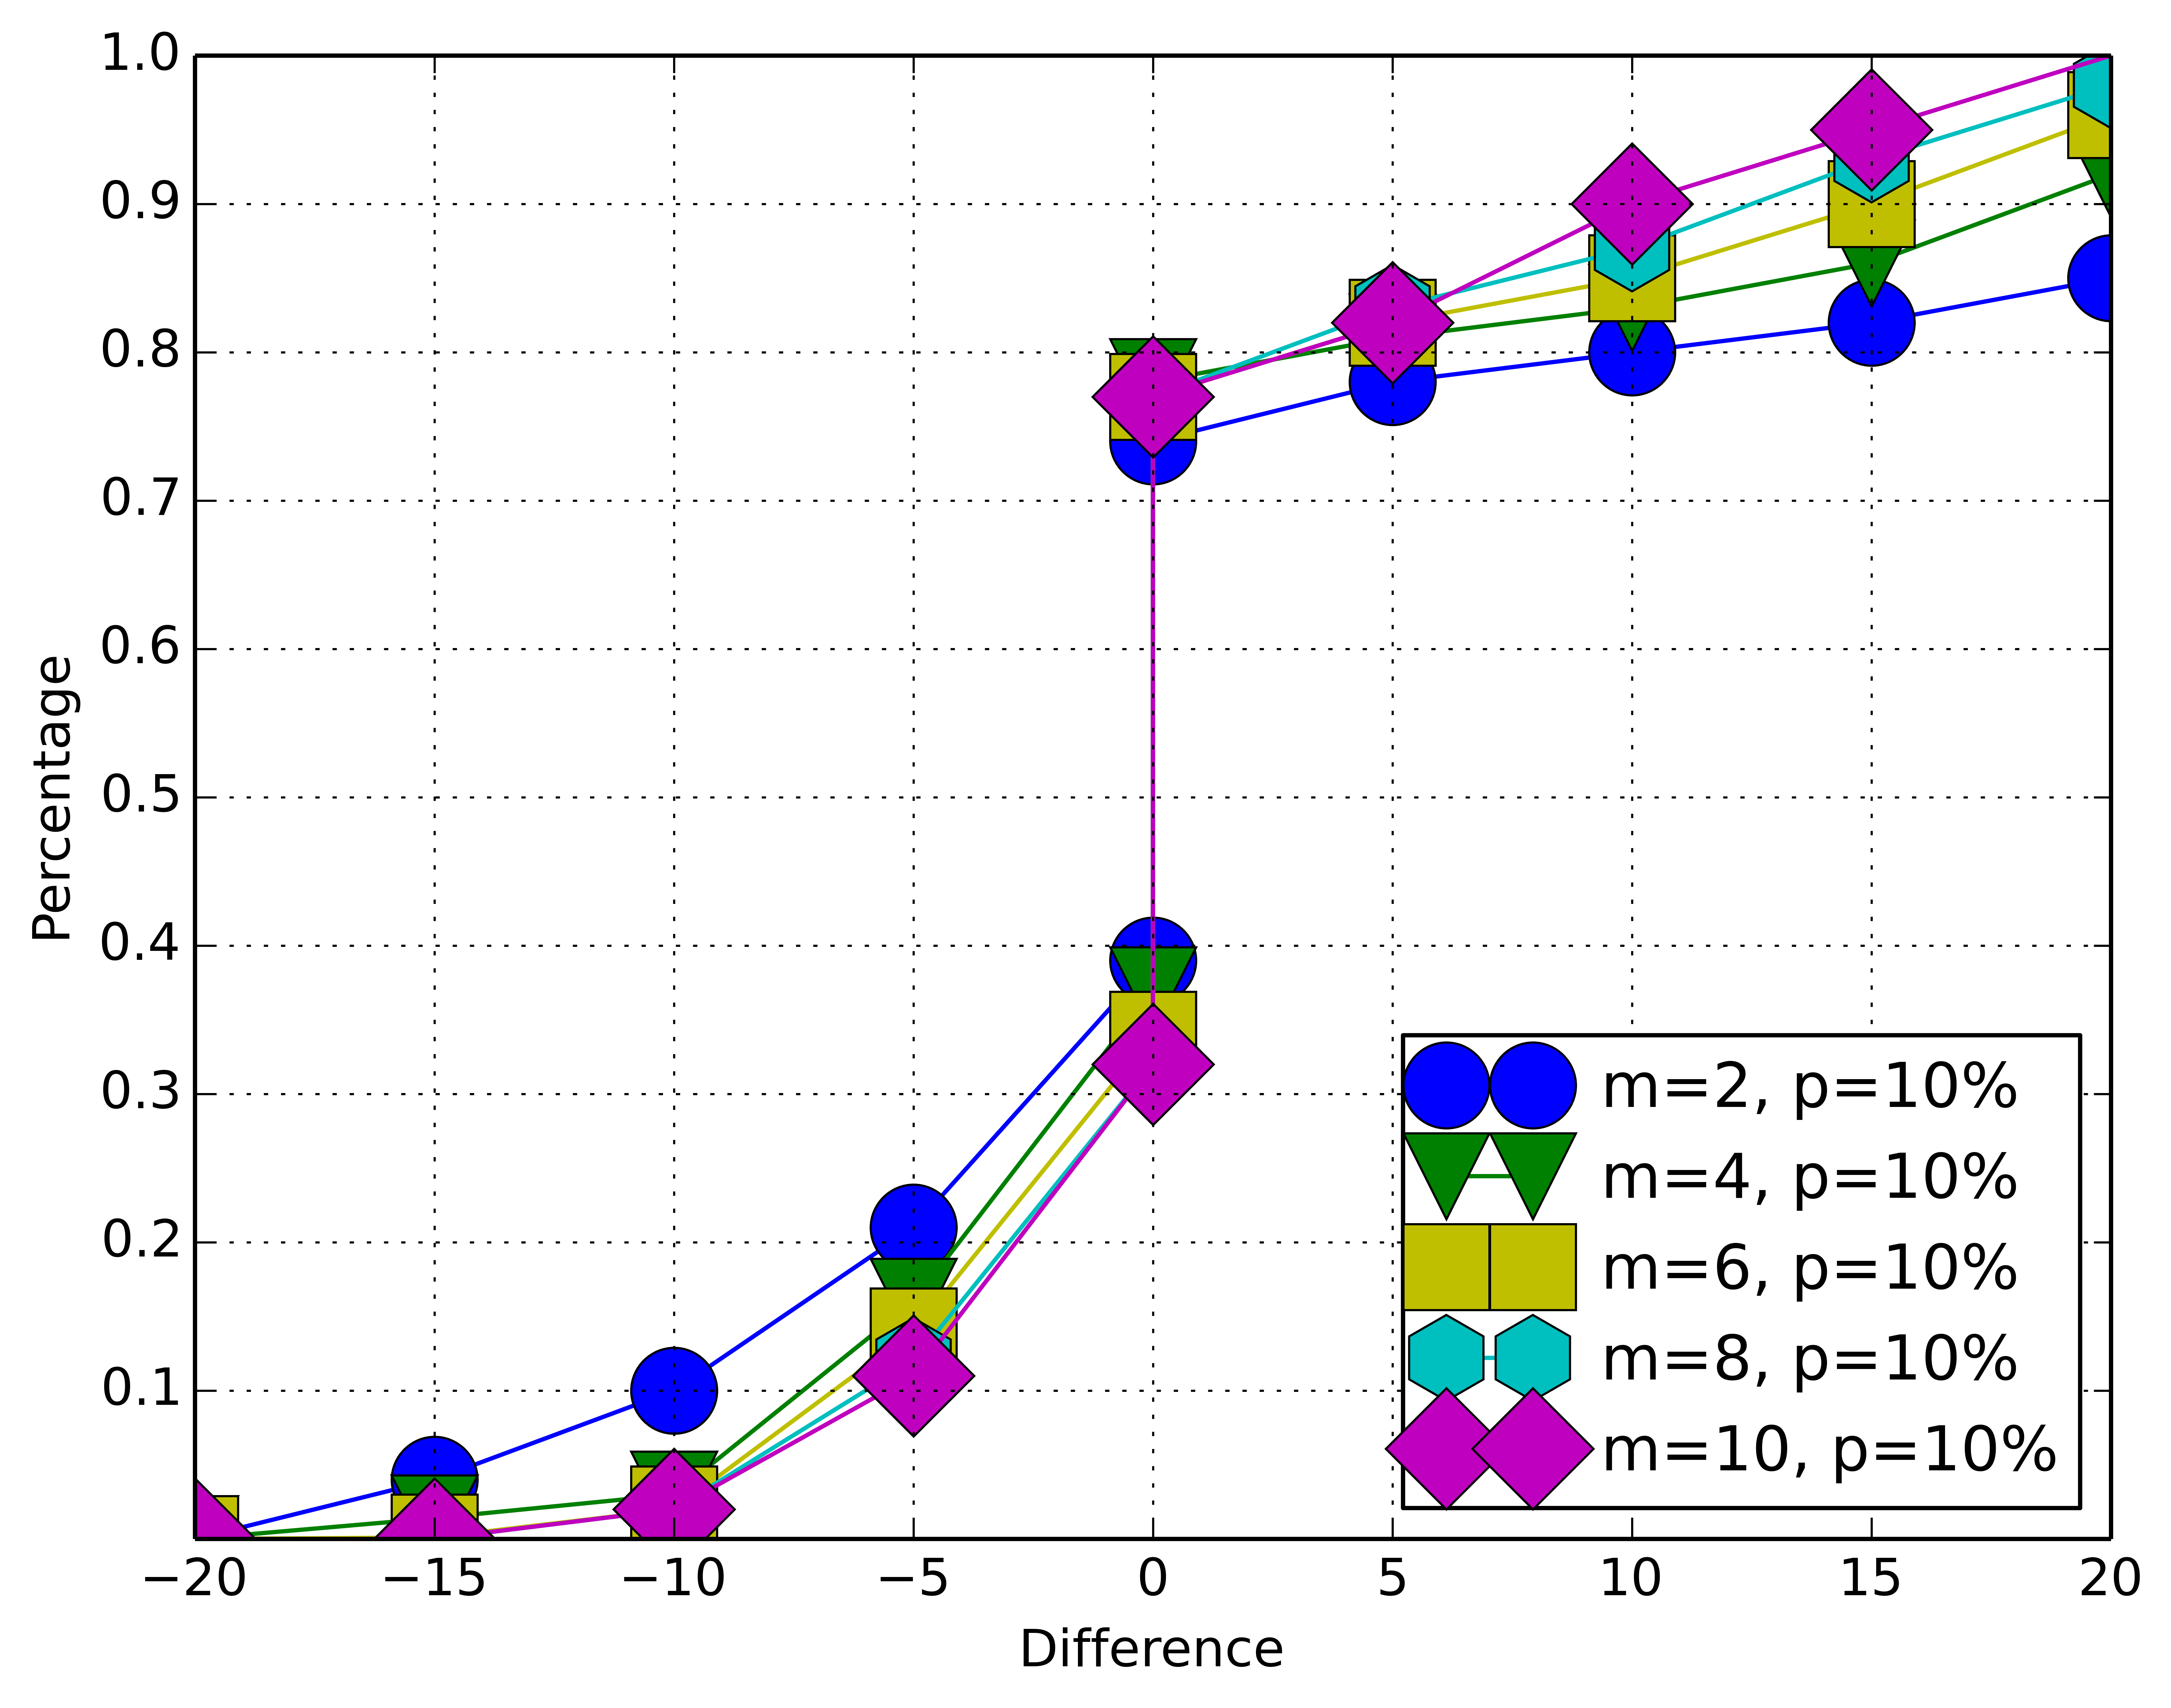
import matplotlib.pyplot as plt
import matplotlib.pylab as pylab
import scipy.io
import numpy as np
# params={
    # ‘axes.labelsize‘: ‘35‘,
    # ‘xtick.labelsize‘:‘27‘,
    # ‘ytick.labelsize‘:‘27‘,
    # ‘lines.linewidth‘:2 ,
    # ‘legend.fontsize‘: ‘27‘,
    # ‘figure.figsize‘   : ‘12, 9‘    # set figure size
# }
# pylab.rcParams.update(params)            #set figure parameter
line_styles=[‘ro-‘,‘b^-‘,‘gs-‘,‘ro--‘,‘b^--‘,‘gs--‘]  #set line style

#We give the coordinate date directly to give an example.
x1 = [-20,-15,-10,-5,0,0,5,10,15,20]
y1 = [0,0.04,0.1,0.21,0.39,0.74,0.78,0.80,0.82,0.85]
y2 = [0,0.014,0.03,0.16,0.37,0.78,0.81,0.83,0.86,0.92]
y3 = [0,0.001,0.02,0.14,0.34,0.77,0.82,0.85,0.90,0.96]
y4 = [0,0,0.02,0.12,0.32,0.77,0.83,0.87,0.93,0.98]
y5 = [0,0,0.02,0.11,0.32,0.77,0.82,0.90,0.95,1]


plt.plot(x1,y1,‘bo-‘,label=‘m=2, p=10%‘,markersize=20) # in ‘bo-‘, b is blue, o is O marker, - is solid line and so on
plt.plot(x1,y2,‘gv-‘,label=‘m=4, p=10%‘,markersize=20)
plt.plot(x1,y3,‘ys-‘,label=‘m=6, p=10%‘,markersize=20)
plt.plot(x1,y4,‘ch-‘,label=‘m=8, p=10%‘,markersize=20)
plt.plot(x1,y5,‘mD-‘,label=‘m=10, p=10%‘,markersize=20)


fig1 = plt.figure(1)
axes = plt.subplot(111)
#axes = plt.gca()
axes.set_yticks([0.1,0.2,0.3,0.4,0.5,0.6,0.7,0.8,0.9,1.0])
axes.grid(True)  # add grid

plt.legend(loc="lower right")  #set legend location
plt.ylabel(‘Percentage‘)   # set ystick label
plt.xlabel(‘Difference‘)  # set xstck label

plt.savefig(‘test.png‘,dpi = 1000,bbox_inches=‘tight‘)
plt.show()
View Code
demo2:餅圖
#!/usr/bin/env python
# -*- coding: utf-8 -*-

from pylab import *

# make a square figure and axes
figure(1, figsize=(6,6))
ax = axes([0.1, 0.1, 0.8, 0.8])

labels = ‘Frogs‘, ‘Hogs‘, ‘Dogs‘, ‘Logs‘
fracs = [15,30,45, 10]

explode=(0, 0.05, 0, 0)
pie(fracs, explode=explode, labels=labels, autopct=‘%1.1f%%‘, shadow=True)
title(‘Raining Hogs and Dogs‘, bbox={‘facecolor‘:‘0.8‘, ‘pad‘:5})
savefig(‘pie.png‘)
show()
View Code

import matplotlib.pyplot as plt
for idx,color in enumerate(‘rgbyck‘):
    plt.subplot(321+idx,axisbg=color)
plt.savefig("test.png")
plt.show()
View Code

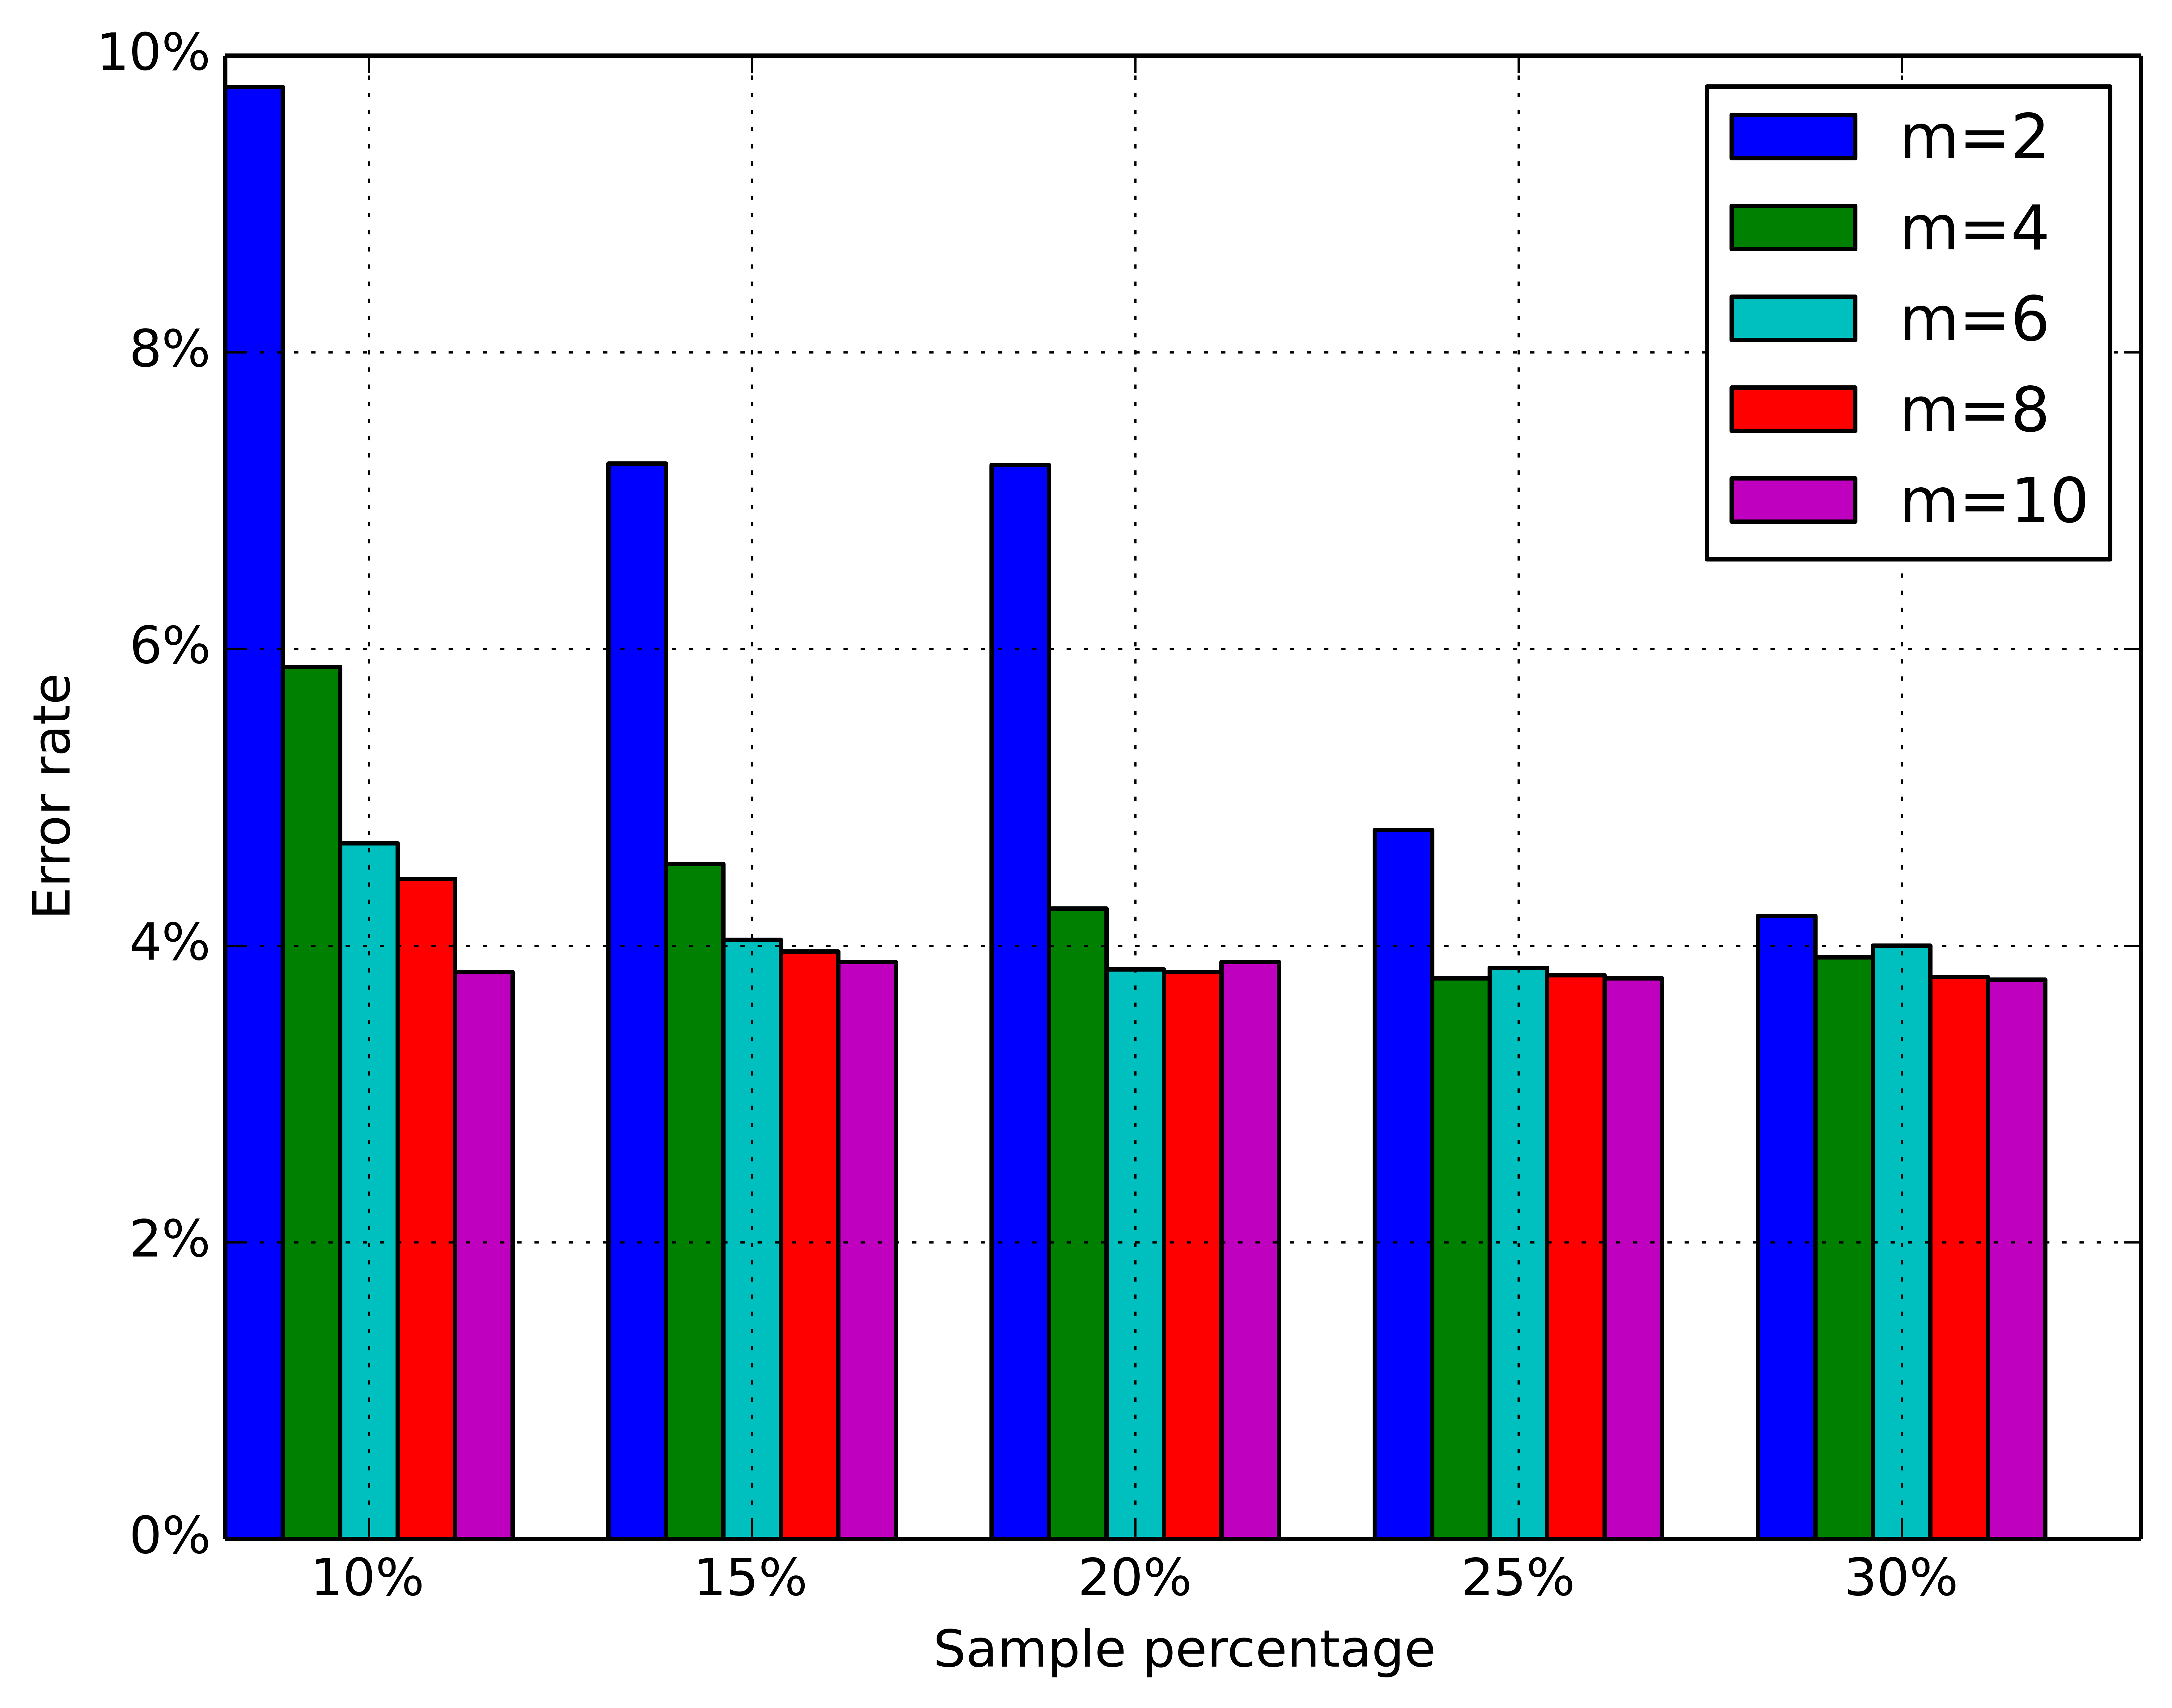
demo3:柱狀圖
import scipy.io
import numpy as np
import matplotlib.pylab as pylab
import matplotlib.pyplot as plt
import matplotlib.ticker as mtick
# params={
    # ‘axes.labelsize‘: ‘35‘,
    # ‘xtick.labelsize‘:‘27‘,
    # ‘ytick.labelsize‘:‘27‘,
    # ‘lines.linewidth‘:2 ,
    # ‘legend.fontsize‘: ‘27‘,
    # ‘figure.figsize‘   : ‘24, 9‘
# }
# pylab.rcParams.update(params)


y1 = [9.79,7.25,7.24,4.78,4.20]
y2 = [5.88,4.55,4.25,3.78,3.92]
y3 = [4.69,4.04,3.84,3.85,4.0]
y4 = [4.45,3.96,3.82,3.80,3.79]
y5 = [3.82,3.89,3.89,3.78,3.77]


ind = np.arange(5)                # the x locations for the groups
width = 0.15
plt.bar(ind,y1,width,color = ‘blue‘,label = ‘m=2‘)
plt.bar(ind+width,y2,width,color = ‘g‘,label = ‘m=4‘) # ind+width adjusts the left start location of the bar.
plt.bar(ind+2*width,y3,width,color = ‘c‘,label = ‘m=6‘)
plt.bar(ind+3*width,y4,width,color = ‘r‘,label = ‘m=8‘)
plt.bar(ind+4*width,y5,width,color = ‘m‘,label = ‘m=10‘)
plt.xticks(np.arange(5) + 2.5*width, (‘10%‘,‘15%‘,‘20%‘,‘25%‘,‘30%‘))

plt.xlabel(‘Sample percentage‘)
plt.ylabel(‘Error rate‘)

fmt = ‘%.0f%%‘ # Format you want the ticks, e.g. ‘40%‘
xticks = mtick.FormatStrFormatter(fmt)
# Set the formatter
axes = plt.gca()   # get current axes
axes.yaxis.set_major_formatter(xticks) # set % format to ystick.
axes.grid(True)
plt.legend(loc="upper right")
plt.savefig(‘test.png‘, format=‘png‘,dpi = 1000,bbox_inches=‘tight‘)

plt.show()
View Code
demo4:網狀圖
import networkx as nx
import pylab as plt
g = nx.Graph()
g.add_edge(1,2,weight = 4)
g.add_edge(1,3,weight = 7)
g.add_edge(1,4,weight = 8)
g.add_edge(1,5,weight = 3)
g.add_edge(1,9,weight = 3)

g.add_edge(1,6,weight = 6)
g.add_edge(6,7,weight = 7)
g.add_edge(6,8,weight = 7)

g.add_edge(6,9,weight = 6)
g.add_edge(9,10,weight = 7)
g.add_edge(9,11,weight = 6)


fixed_pos = {1:(1,1),2:(0.7,2.2),3:(0,1.8),4:(1.6,2.3),5:(2,0.8),6:(-0.6,-0.6),7:(-1.3,0.8), 8:(-1.5,-1), 9:(0.5,-1.5), 10:(1.7,-0.8), 11:(1.5,-2.3)} #set fixed layout location


#pos=nx.spring_layout(g) # or you can use other layout set in the module
nx.draw_networkx_nodes(g,pos = fixed_pos,nodelist=[1,2,3,4,5],
node_color = ‘g‘,node_size = 600)
nx.draw_networkx_edges(g,pos = fixed_pos,edgelist=[(1,2),(1,3),(1,4),(1,5),(1,9)],edge_color=‘g‘,width = [4.0,4.0,4.0,4.0,4.0],label = [1,2,3,4,5],node_size = 600)


nx.draw_networkx_nodes(g,pos = fixed_pos,nodelist=[6,7,8],
node_color = ‘r‘,node_size = 600)
nx.draw_networkx_edges(g,pos = fixed_pos,edgelist=[(6,7),(6,8),(1,6)],width = [4.0,4.0,4.0],edge_color=‘r‘,node_size = 600)

nx.draw_networkx_nodes(g,pos = fixed_pos,nodelist=[9,10,11],
node_color = ‘b‘,node_size = 600)
nx.draw_networkx_edges(g,pos = fixed_pos,edgelist=[(6,9),(9,10),(9,11)],width = [4.0,4.0,4.0],edge_color=‘b‘,node_size = 600)

plt.text(fixed_pos[1][0],fixed_pos[1][1]+0.2, s = ‘1‘,fontsize = 40)
plt.text(fixed_pos[2][0],fixed_pos[2][1]+0.2, s = ‘2‘,fontsize = 40)
plt.text(fixed_pos[3][0],fixed_pos[3][1]+0.2, s = ‘3‘,fontsize = 40)
plt.text(fixed_pos[4][0],fixed_pos[4][1]+0.2, s = ‘4‘,fontsize = 40)
plt.text(fixed_pos[5][0],fixed_pos[5][1]+0.2, s = ‘5‘,fontsize = 40)
plt.text(fixed_pos[6][0],fixed_pos[6][1]+0.2, s = ‘6‘,fontsize = 40)
plt.text(fixed_pos[7][0],fixed_pos[7][1]+0.2, s = ‘7‘,fontsize = 40)
plt.text(fixed_pos[8][0],fixed_pos[8][1]+0.2, s = ‘8‘,fontsize = 40)
plt.text(fixed_pos[9][0],fixed_pos[9][1]+0.2, s = ‘9‘,fontsize = 40)
plt.text(fixed_pos[10][0],fixed_pos[10][1]+0.2, s = ‘10‘,fontsize = 40)
plt.text(fixed_pos[11][0],fixed_pos[11][1]+0.2, s = ‘11‘,fontsize = 40)

plt.show()
View Code

Python matplotib 畫圖