ECharts 從後臺動態獲取資料 (asp.net)
阿新 • • 發佈:2018-11-15
(一) 使用工具 visual studio 2017;Web開發:asp.net
(程式碼中的js引用路徑以及ajax方法呼叫的url,記得修改哦)
(二) 準備工作(此處寫給和我一樣小白)
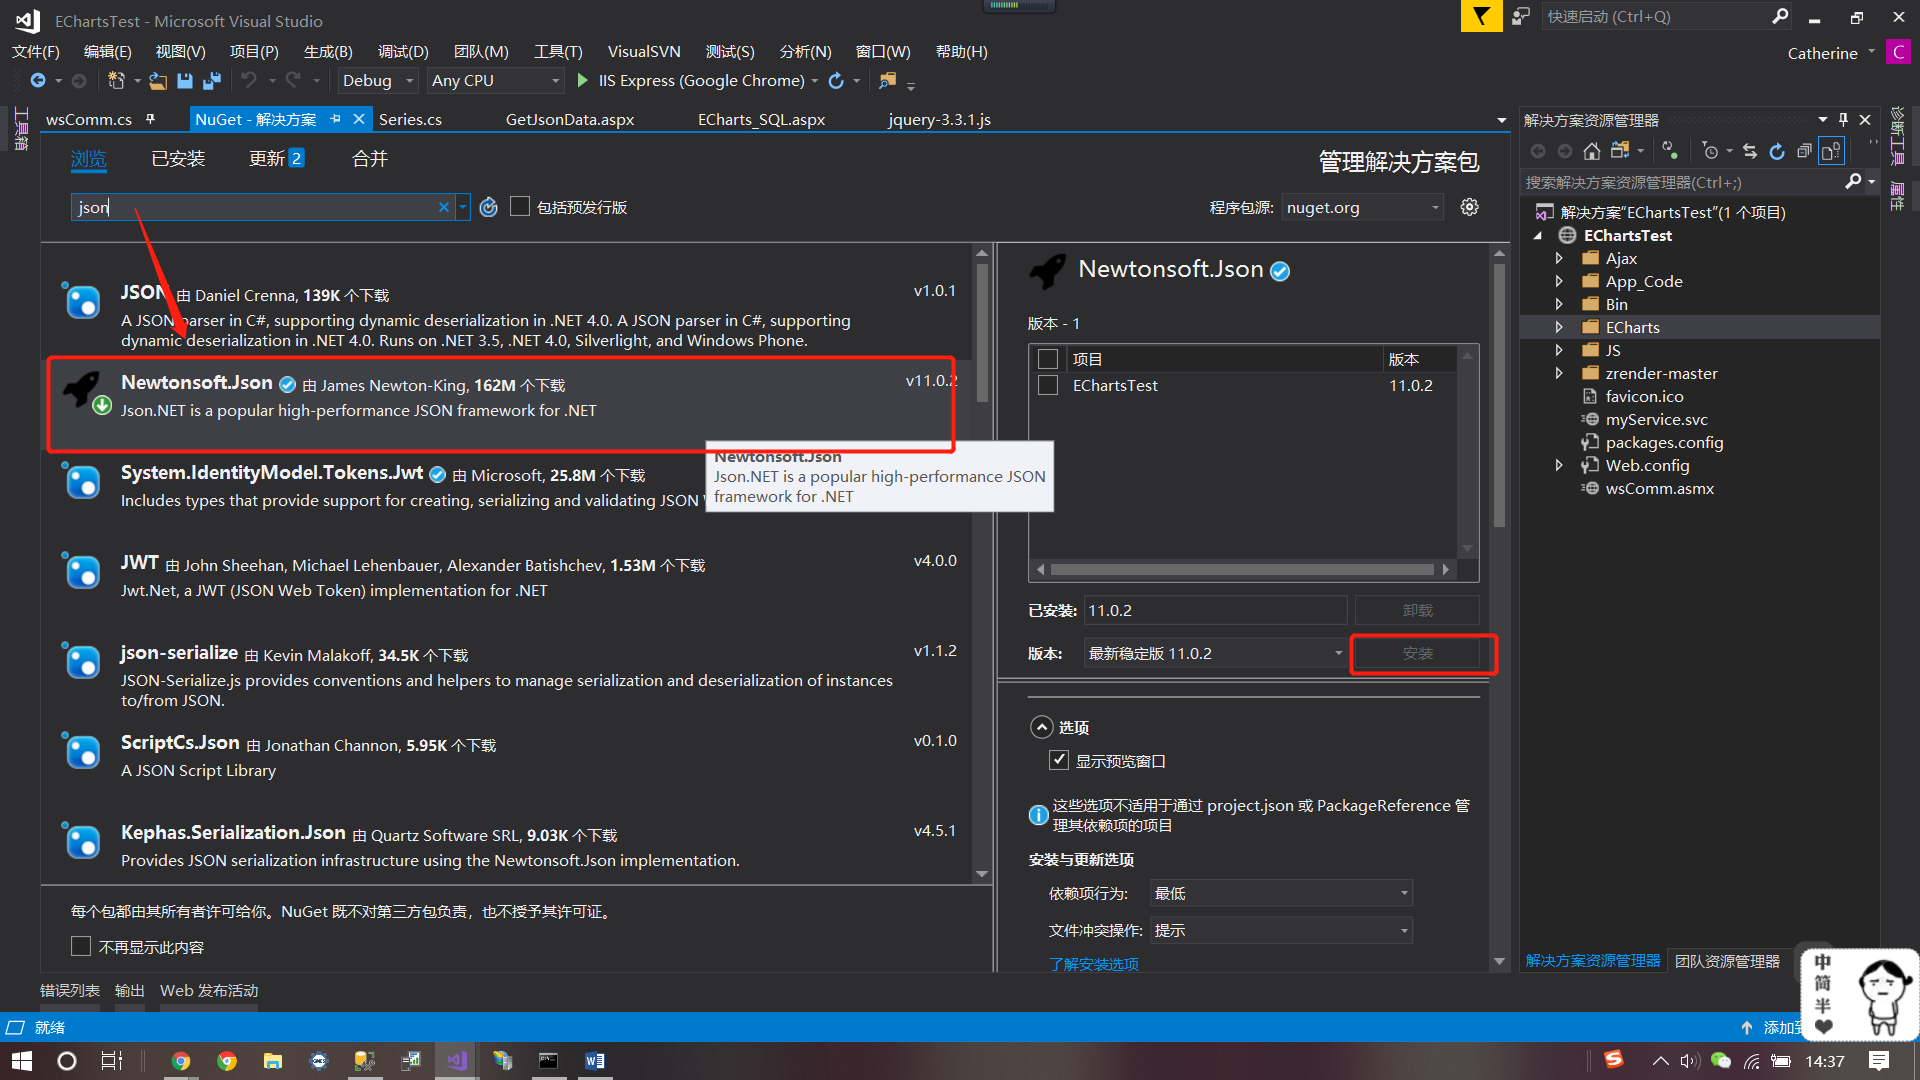
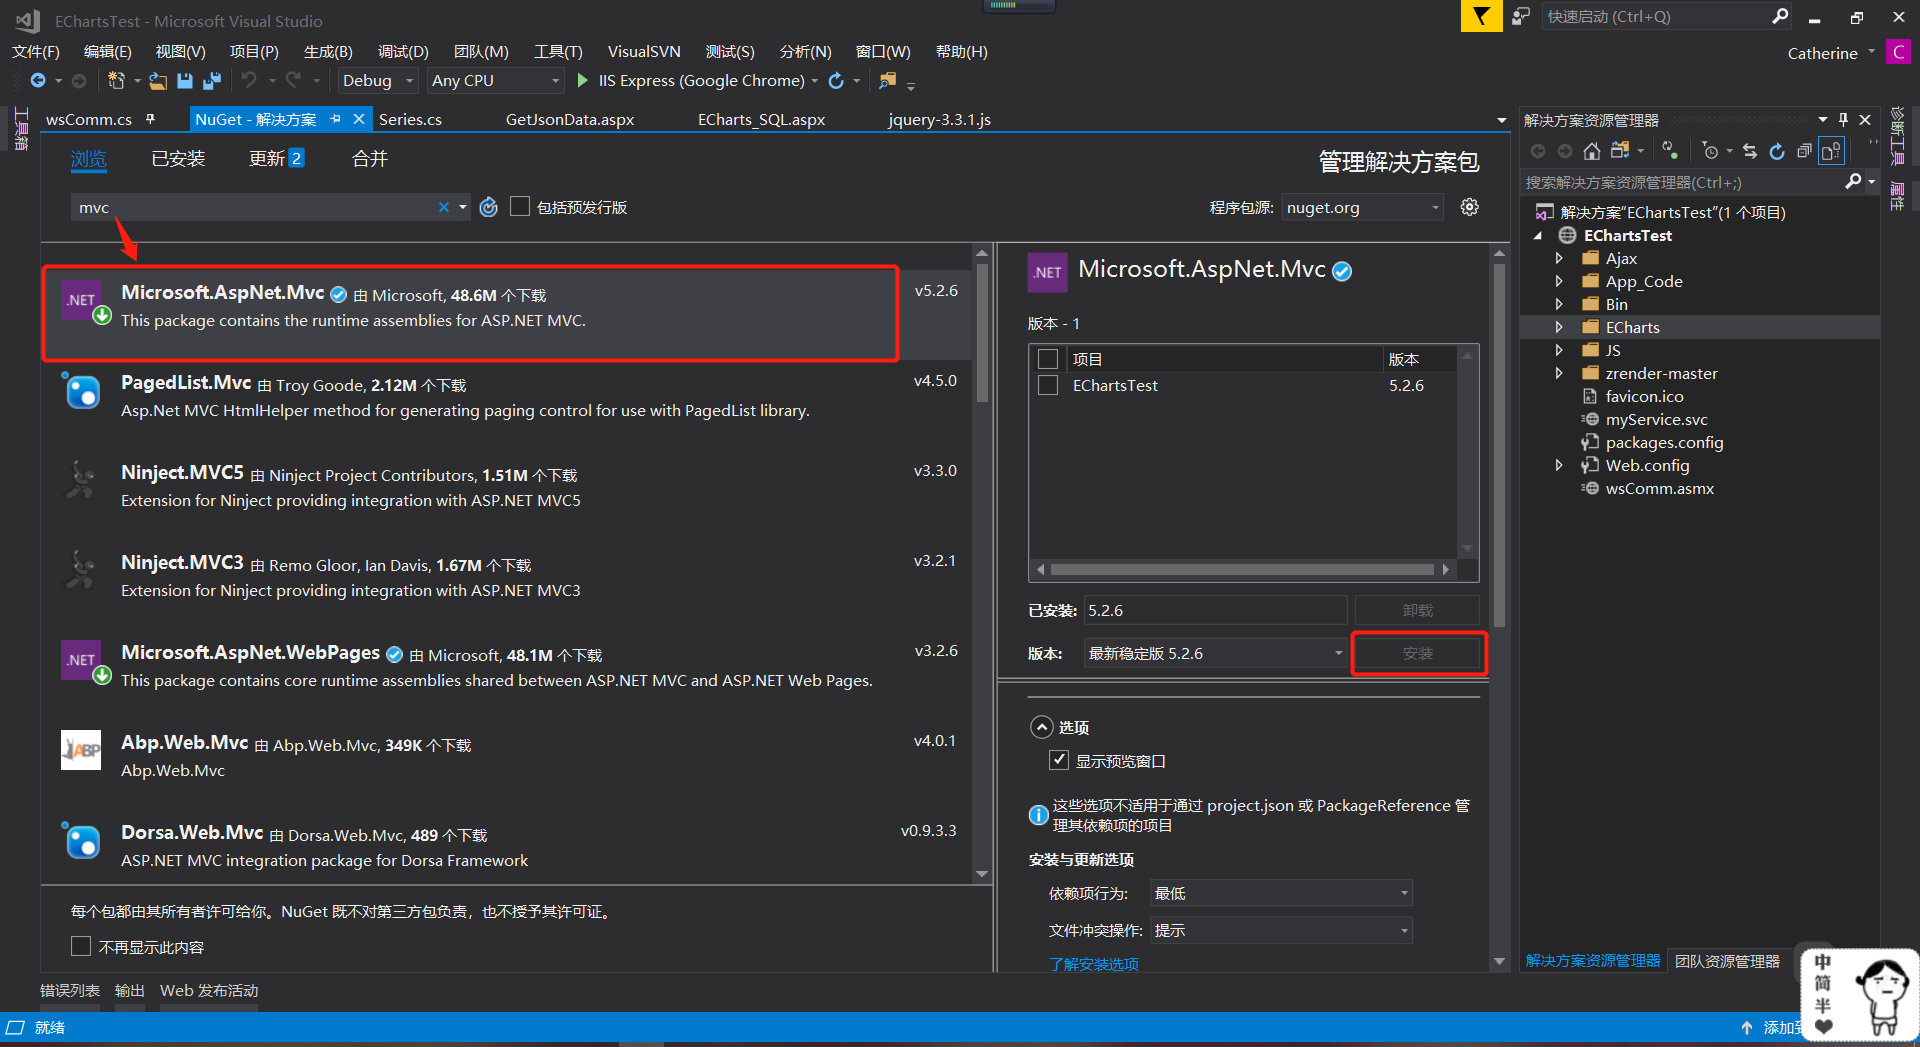
1.動態從後臺獲取資料,需使用Ajax獲取後臺Json,為此我們需要做一些準備工作,安裝兩個包(在vs的NuGet包管理)
一個json的包,一個mvc的包。


2.新增必要的js。
ECharts和jQuery均可在各自官網下載到。Echarts依賴zrender,但好像專案中是否引用並不影響。原諒我對Echarts還只是初識,理解不夠深刻。

(三) 開始吧~
然後現在開始我們的小練習。
先準備一個Series類

1 using System; 2 using System.Collections.Generic; 3 using System.Linq; 4 using System.Web; 5 6 /// <summary> 7 /// Series 的摘要說明 8 /// </summary> 9 public class Series 10 { 11 public string name; 12 public string type; 13 publicSeriesint yAxisIndex; 14 public List<double> data; 15 }
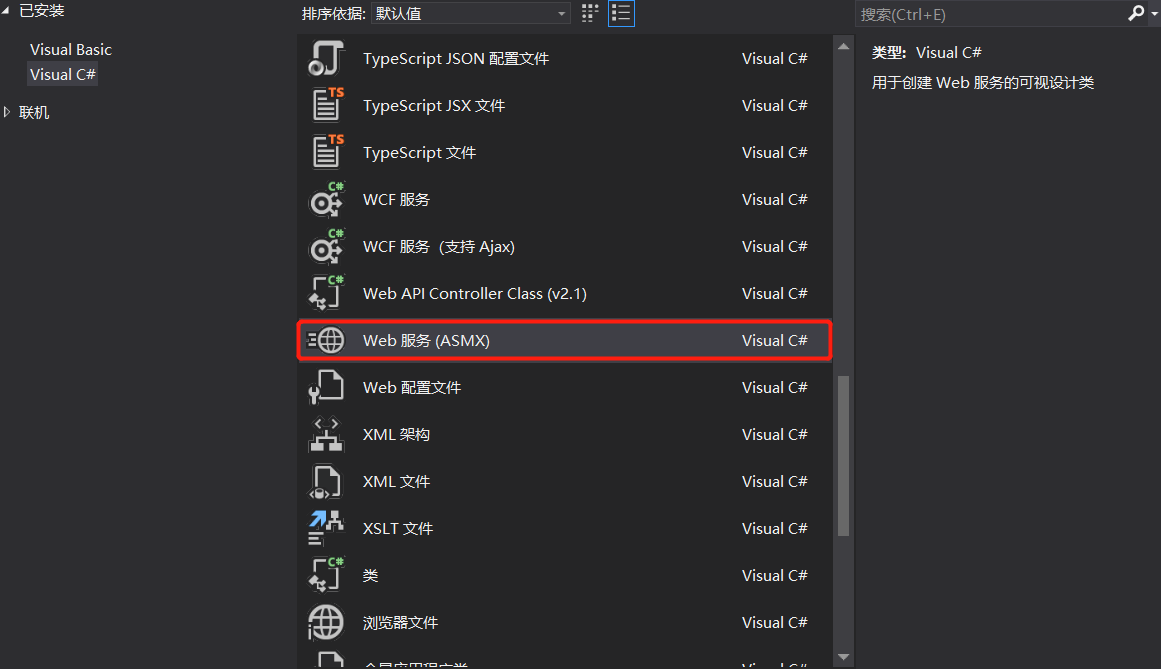
然後我們新增一個web服務

是的,就是這個~ 我給的名字叫 wsComm
(VS很智慧的告訴我要取消如下注釋,然而我一開始仍然沒有看到,瞎了大概)

然後我們需要在這裡面寫一個webmethod,以便在前臺進行資料獲取(關於webmethod的問題,這裡不做詳述)。

 1 /// <summary>
 2 /// wsComm 的摘要說明
 3 /// </summary>
 4 [WebService(Namespace = "http://tempuri.org/")]
 5 [WebServiceBinding(ConformsTo = WsiProfiles.BasicProfile1_1)]
 6 // 若要允許使用 ASP.NET AJAX 從指令碼中呼叫此 Web 服務,請取消註釋以下行。
 7 [System.Web.Script.Services.ScriptService]
 8 public class wsComm : System.Web.Services.WebService
 9 {
10
11     /// <summary>
12     /// ECharts圖表資料獲取
13     /// </summary>
14     /// <returns></returns>
15     [WebMethod]
16     public JsonResult getdataechart()
17     {
18         //考慮到圖表的category是字串陣列 這裡定義一個string的List
19         List<string> categoryList = new List<string>();
20         //考慮到Echarts圖表需要設定legend內的data陣列為series的name集合這裡需要定義一個legend陣列
21         List<string> legendList = new List<string>();
22         //考慮到圖表的series資料為一個物件陣列 這裡額外定義一個series的類
23         List<Series> seriesList = new List<Series>();
24         //設定legend陣列
25         legendList.Add("月支出金額"); //這裡的名稱必須和series的每一組series的name保持一致
26         legendList.Add("月工作量"); //這裡的名稱必須和series的每一組series的name保持一致
27         //填寫第一個Series
28         //定義一個Series物件
29         Series seriesObj = new Series();
30         seriesObj.name = "月支出金額";
31         seriesObj.type = "line"; //線性圖呈現
32         seriesObj.data = new List<double>(); //先初始化 不初始化後面直直接data.Add(x)會報錯
33
34         //模擬兩組資料,都放在二組陣列中。該資料你可以從資料庫中獲取,關於如何從後臺資料庫進行讀取,本文不再詳述。
35         string[,] MonthCost = new string[,] { { "201701", "10110020" }, { "201702", "2000000" }, { "201703", "3500000" }, { "201704", "4590876" }, { "201705", "5809833" }, { "201706", "5309902" }, { "201707", "7388332" }, { "201708", "2000000" }, { "201709", "19879802" }, { "2017010", "2378945" } };
36         string[,] ProjectVal = new string[,] { { "201701", "3000" }, { "201702", "7500" }, { "201703", "9500" }, { "201704", "10000" }, { "201705", "12000" }, { "201706", "10050" }, { "201707", "30050" }, { "201708", "7893" }, { "201709", "7312" }, { "2017010", "8905" } };
37         //設定資料
38         for (int i = 0; i < 10; i++)
39         {
40             //加入category刻度陣列
41             categoryList.Add(MonthCost[i, 0]);
42             //加入資料值series序列陣列 這裡提供為了效果只提供一組series資料好了
43             seriesObj.data.Add(Convert.ToDouble(MonthCost[i, 1])); //資料依次遞增
44         }
45         seriesList.Add(seriesObj);
46         //填寫第二個Series
47         seriesObj = new Series();
48         seriesObj.name = "月工作量";
49         seriesObj.type = "bar"; //線性圖呈現
50         seriesObj.yAxisIndex = 1;
51         seriesObj.data = new List<double>(); //先初始化 不初始化後面直直接data.Add(x)會報錯
52         //設定資料
53         for (int i = 0; i < 10; i++)
54         {
55             seriesObj.data.Add(Convert.ToDouble(ProjectVal[i, 1])); //資料依次遞增
56         }
57         seriesList.Add(seriesObj);
58         //最後呼叫相關函式將List轉換為Json
59         //因為我們需要返回category和series、legend多個物件 這裡我們自己在new一個新的物件來封裝這兩個物件
60         JsonResult json = new JsonResult();
61         var newObj = new
62         {
63             category = categoryList,
64             series = seriesList,
65             legend = legendList
66         };
67         json.Data = JsonConvert.SerializeObject(newObj);
68         return json;
69     }
70 }
wsComm
前臺:

 1 <html xmlns="http://www.w3.org/1999/xhtml">
 2 <head runat="server">
 3     <meta http-equiv="Content-Type" content="text/html; charset=utf-8" />
 4     <script type="text/jscript" src="../JS/jquery-3.3.1.js"></script>
 5     <script type="text/jscript" src="../JS/echarts.js"></script>
 6     <title></title>
 7 </head>
 8 <body>
 9     <form id="form1" runat="server">
10         <div id="main" style="height: 400px"></div>
11         <script type="text/javascript">
12             var myChart = echarts.init(document.getElementById('main'));
13             //圖表顯示提示資訊
14             myChart.showLoading({
15                 text: "圖表資料正在努力載入..."
16             });
17             //定義圖表options
18             var options = {
19                 title: {
20                     text: "測試報表1",
21                 },
22                 //右側工具欄
23                 toolbox: {
24                     show: true,
25                     feature: {
26                         mark: { show: true },
27                         dataView: { show: true, readOnly: false },
28                         magicType: { show: true, type: ['line', 'bar'] },
29                         restore: { show: true },
30                         saveAsImage: { show: true }
31                     }
32                 },
33                 tooltip: {
34                     trigger: 'axis'
35                 },
36                 legend: {
37                     data: []
38                 },
39                 calculable: true,
40                 xAxis: [
41                     {
42                         type: 'category',
43                         name: '月份',
44                         data: []
45                     }
46                 ],
47                 yAxis: [
48                     {
49                         type: 'value',
50                         name: '金額',
51                         axisLabel: {
52                             formatter: '{value} Y'
53                         },
54                         splitArea: { show: true }
55                     },
56                     {
57                         type: 'value',
58                         name: '工作量',
59                         axisLabel: {
60                             formatter: '{value} M3'
61                         },
62                         splitArea: { show: true }
63                     }
64                 ],
65                 series: []
66             };
67             //通過Ajax獲取資料
68             $.ajax({
69                 type: "POST",
70                 async: false,
71                 contentType: 'application/json; charset=utf-8',
72                 url: "../wsComm.asmx/getdataechart",
73                 dataType: "json", //返回資料形式為json
74                 success: function (result) {
75                     var obj = JSON.parse(result.d.Data); //一定要注意大小寫,本語句中,一直把Data寫成data,總是取不出資料,耽誤了半天
76                     if (result) {
77                         //將返回的category和series物件賦值給options物件內的category和series
78                         //因為xAxis是一個數組 這裡需要是xAxis[i]的形式
79                         options.yAxis[0].data = obj.value;
80                         options.xAxis[0].data = obj.category;
81                         options.series= obj.series;
82                         options.legend.data = obj.legend;
83                         myChart.hideLoading();
84                         myChart.setOption(options);
85                     }
86                 },
87                 error: function (XMLHttpRequest, textStatus, errorThrown) {
88                     alert(XMLHttpRequest.responseText);
89                     alert(XMLHttpRequest.status);
90                     alert(XMLHttpRequest.readyState);
91                     alert(textStatus);
92                 }
93             });
94         </script>
95     </form>
96 </body>
97 </html>
html
嗯,然後就完成了。
參考原文:https://blog.csdn.net/guoxy_nb/article/details/78943185

