
ELK6.0日誌從收集到處理完整版教程(二)
ELK簡介
Elasticsearch
開源分散式搜尋引擎,它的特點有:分散式,零配置,自動發現,索引自動分片,索引副本機制,restful風格介面,多資料來源,自動搜尋負載等。也可以認為ElasticSearch是一個NoSQL儲存中心,可以儲存各種資料,並且查詢速度超級快。
Logstash
完全開源的工具,可以從各種輸入流(檔案,佇列,資料庫)收集資訊,並對資訊進行處理,將處理後的資訊儲存到ElasticSearch
kibana
開源和免費的工具,它可以從ElasticSearch讀取日誌等儲存的資訊, 提供的日誌分析友好的 Web 介面,可以幫助您彙總、分析和搜尋重要資料日誌。
1.Kibana安裝與配置
[[email protected] elk]# tar -zxvf kibana-6.2.4-linux-x86_64.tar.gz
[[email protected] kibana-6.2.4-linux-x86_64]# ls
bin config data LICENSE.txt node node_modules nohup.log NOTICE.txt optimize package.json plugins README.txt src ui_framework webpackShims
配置檔案:
[[email protected] config]# grep "^\s*[^# \t].*$" config/kibana.yml
server.port: 5601
server.host: 0.0.0.0 #將本機的外網ip地址配置上,這樣外網才能訪問到
elasticsearch.url: "http://localhost:9200" ##配置EA的地址,本機使用localhost,可配置ip
啟動:
nohup sh ./bin/kibana > nohup.log &
http://192.168.3.113:5601 #驗證web頁面啟動
關閉kibana:ps -ef | grep node #檢視程序,kill -9
2.LogStash安裝與配置
[[email protected] elk]# tar -zxvf logstash-6.2.4.tar.gz
[[email protected] logstash-6.2.4]# cat config/logstash.conf
input {
beats {
port => "5043"
}
}
filter {
grok {
match => { "message" => "\[%{IP:ip}\] \[%{TIMESTAMP_ISO8601:timestamp}\] \[%{NOTSPACE:class}\]"}
}
}
output {
elasticsearch {
hosts => [ "http://localhost:9200" ]
}
}
啟動:
[[email protected] logstash-6.2.4]# nohup bin/logstash -f config/logstash.conf > nohup.log &
3.Filebeat安裝與配置
[[email protected] elk]# tar -zxvf filebeat-6.2.4-linux-x86_64.tar.gz
filebeat必須屬於root使用者名稱下;filebeat.yml中 enable項都由false改為true;
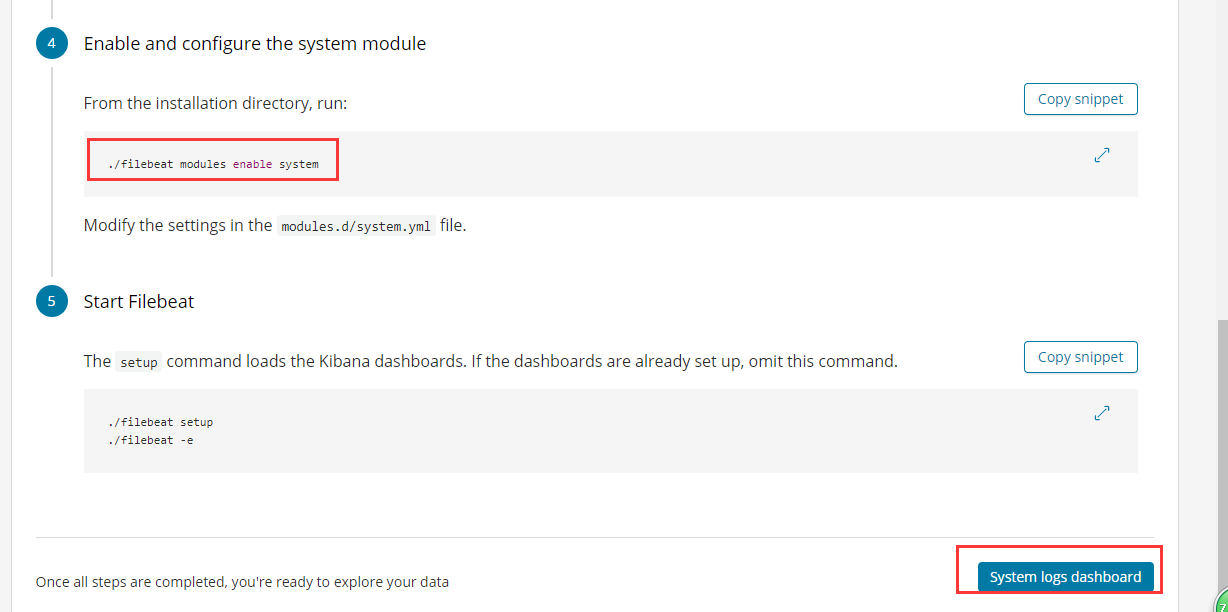
開啟收集system系統日誌: ./filebeat modules enable system

過濾配置檔案中的註釋空格等無用字元只顯示生效配置:
[[email protected] filebeat-6.2.4-linux-x86_64]# grep "^\s*[^# \t].*$" filebeat.yml
filebeat.prospectors:
- type: log
enabled: true
paths:
- /var/log/*.log
filebeat.config.modules:
path: ${path.config}/modules.d/*.yml
reload.enabled: true
setup.template.settings:
index.number_of_shards: 3
setup.kibana:
host: "localhost:5601"
#output.elasticsearch:
#hosts: ["localhost:9200"]
output.logstash:
hosts: ["localhost:5043"]
啟動:
nohup ./filebeat -e -c filebeat.yml -d "Publish" > filebeat.log &
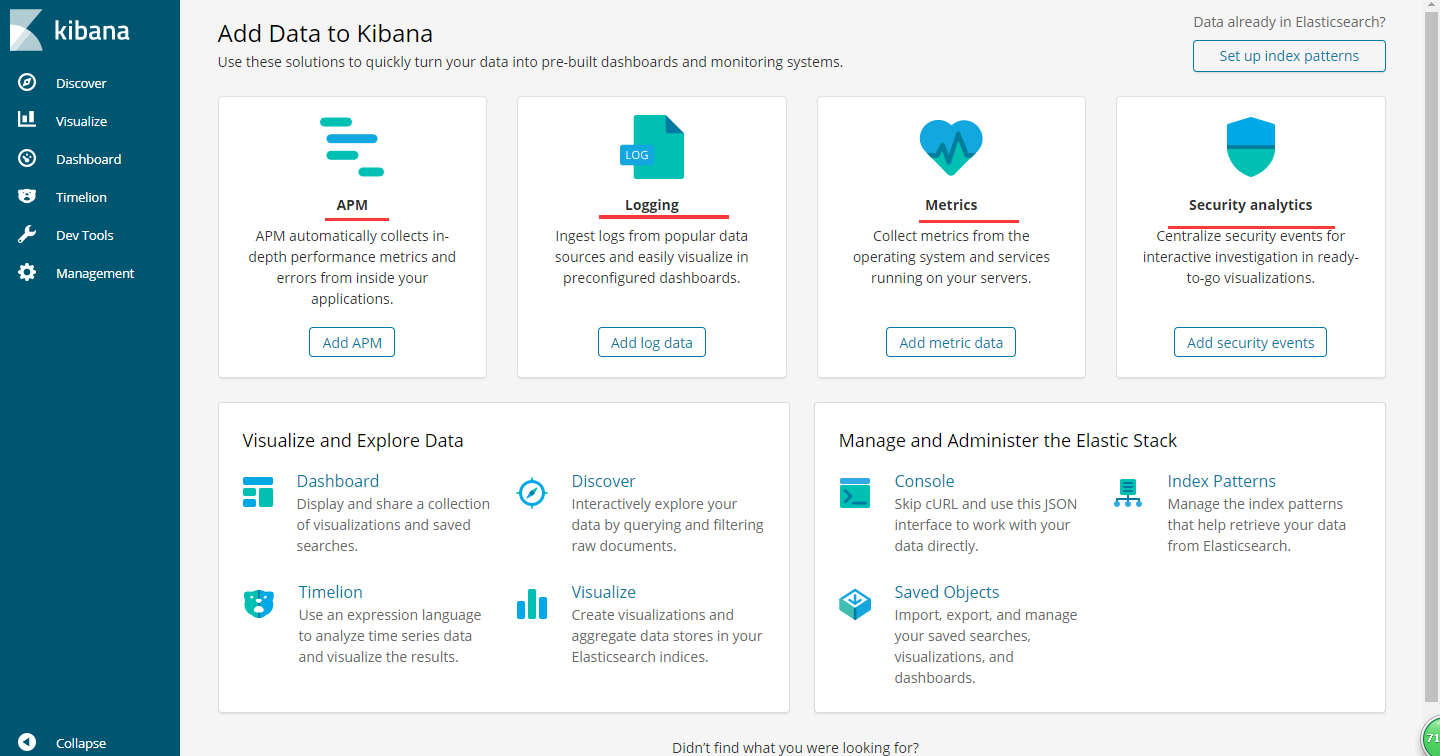
最後kibana配置:

選擇對應需要收集展示的日誌型別:如:System,nginx,apache,Redis等

按教程配置filebeat後按System logs dashboard
第一次訪問的時候,會要求設定Index Pattern,因為我們在logstash-es.conf中設定為logstash-%{+YYYY-MM},所以設定為logstash-*就可以了。
Discover是主要的查詢互動介面,如下所示:
