
django Highcharts製作圖表--顯示CPU使用率
Highcharts 是一個用純JavaScript編寫的一個圖表庫。
Highcharts 能夠很簡單便捷的在web網站或是web應用程式新增有互動性的圖表
Highcharts 免費提供給個人學習、個人網站和非商業用途使用。
訪問官網:
進入下載頁面:
https://www.hcharts.cn/download
下載6.10版本
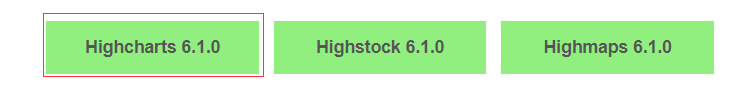
解壓Highcharts-6.1.0.zip檔案,訪問裡面的index.htm檔案。
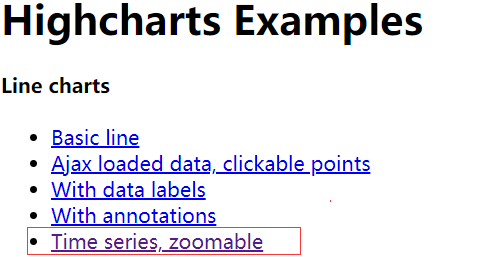
點選Time series, zoomable
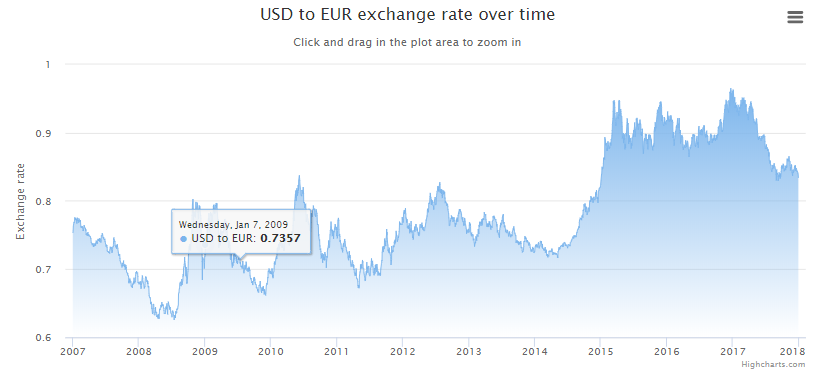
頁面效果如下:
這個,就是接下來django需要用的模板。
它在目錄Highcharts-6.1.0\examples\line-time-series裡面,編輯line-time-series目錄下的index.htm檔案
注意這一行:
'https://cdn.rawgit.com/highcharts/highcharts/057b672172ccc6c08fe7dbb27fc17ebca3f5b770/samples/data/usdeur.json',
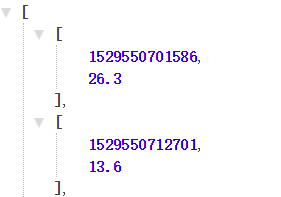
它是圖表需要的json資料,開啟這個json連結,將網頁內容複製,使用json格式化工具處理,效果如下:
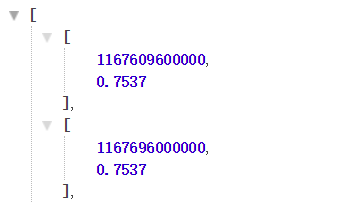
如果谷歌瀏覽器,安裝外掛JSON Formatter,就可以得到上面的效果。
它的資料格式一個大的列表,裡面每一個元素都是小列表。
列表第一個值,是一個時間戳,第二個是具體的值。開啟站長工具的時間戳轉換,連結如下:
輸入數值1167609600000,點選轉換

很明顯,時間不對。為什麼呢?因為它是毫秒
選擇毫秒,再次點選轉換,時間就對了。

那麼django需要輸出,指定格式的json資料,才能展示正確的圖表。
資料從何而來呢?自己造唄!
下面將演示,如何展示一個CPU使用率的圖表。
在專案根目錄建立檔案monit_system.py,它能統計系統的CPU使用率,記憶體使用情況。
統計完成之後,將對應的數值插入到MySQL中。它會插入30條記錄,每隔10秒採集一次。
程式碼如下:
#!/usr/bin/env python
# -*- coding: utf-8 -*-
import pymysql
import gevent
import time
import psutil

#解決wind10錯誤OSError: raw write() returned invalid length
import win_unicode_console
win_unicode_console.enable()

class MyPyMysql:
    def __init__(self, host, port, username, password, db, charset='utf8'):
        self.host = host  # mysql主機地址
        self.port = port  # mysql埠
        self.username = username  # mysql遠端連線使用者名稱
        self.password = password  # mysql遠端連線密碼
        self.db = db  # mysql使用的資料庫名
        self.charset = charset  # mysql使用的字元編碼,預設為utf8
        self.pymysql_connect()  # __init__初始化之後,執行的函式

    def pymysql_connect(self):
        # pymysql連線mysql資料庫
        # 需要的引數host,port,user,password,db,charset
        self.conn = pymysql.connect(host=self.host,
                                    port=self.port,
                                    user=self.username,
                                    password=self.password,
                                    db=self.db,
                                    charset=self.charset
                                    )
        # 連線mysql後執行的函式
        self.asynchronous()

    def getCPUstate(self,interval=1):
        cpu = psutil.cpu_percent(interval)
        return cpu

    def getMemorystate(self):
        phymem = psutil.virtual_memory()
        cur_mem = phymem.percent
        mem_rate = int(phymem.used / 1024 / 1024)
        mem_all = int(phymem.total / 1024 / 1024)

        line = {
            'cur_mem': cur_mem,
            'mem_rate': mem_rate,
            'mem_all': mem_all,
        }

        return line

    def run(self):
        # 建立遊標
        self.cur = self.conn.cursor()
        # 定義sql語句
        sql = "insert into blog_system_monit(cpu,cur_mem,mem_rate,mem_all,create_time,time_stamp) values (%s,%s,%s,%s,%s,%s)"
        print(sql)

        # 定義資料
        cpu = self.getCPUstate()  # cpu使用率
        mem = self.getMemorystate()  # 記憶體info資訊
        mem_rate = mem['mem_rate']  # 記憶體使用率
        cur_mem = mem['cur_mem']  # 當前使用記憶體
        mem_all = mem['mem_all']  # 總記憶體
        struct_time = time.localtime()
        create_time = time.strftime("%Y-%m-%d %H:%M:%S", struct_time)  # 轉換為標準時間
        t = time.time()  # 當前時間戳
        time_stamp = int(round(t * 1000))  # 轉換為毫秒的時間戳

        print((cpu, cur_mem,mem_rate, mem_all,create_time,time_stamp))

        # 執行插入一行資料,如果插入多行,使用executemany(sql語句,資料(需一個元組型別))
        content = self.cur.execute(sql,(cpu,cur_mem,mem_rate,mem_all,create_time,time_stamp))
        if content:
            print('插入ok')

        # 提交資料,必須提交,不然資料不會儲存
        self.conn.commit()

    def asynchronous(self):
        #執行30次協程任務
        for i in range(0,30):
            time.sleep(10)  # 等待10秒
            gevent.spawn(self.run())  # 執行方法

        self.cur.close()  # 關閉遊標
        self.conn.close()  # 關閉pymysql連線

if __name__ == '__main__':
    start_time = time.time()  # 計算程式開始時間
    st = MyPyMysql('127.0.0.1', 3306, 'root', '', 'db2')  # 例項化類,傳入必要引數
    print('程式耗時{:.2f}'.format(time.time() - start_time))  # 計算程式總耗時
建立表blog_system_monit
進入django專案,修改blog目錄下的models.py,內容如下:
from django.db import models

# Create your models here.
#必須要繼承models.Model類,這個固定寫法。
# 這裡表示建立表blog_system_monit,blog是應用名,它會自動加上的。
class system_monit(models.Model):
    #id自增,型別為bigint。設定為主鍵
    id = models.BigAutoField(primary_key=True)
    #型別為decimal(10,2),長度為10,小數點保留2位
    cpu = models.DecimalField(max_digits=10, decimal_places=2)
    #型別為int(11),11是預設長度
    cur_mem = models.IntegerField()
    mem_rate = models.DecimalField(max_digits=10, decimal_places=2)
    mem_all = models.IntegerField()
    #型別為datetime
    create_time = models.DateTimeField()
    #由於毫秒的時間戳超過了timestamp的長度,所以只能設定bigint了。
    time_stamp = models.BigIntegerField()
在Pycharm的Terminal視窗中,輸入以下命令
python manage.py makemigrations
python manage.py migrate
執行完成之後,它會自動建立表blog_system_monit
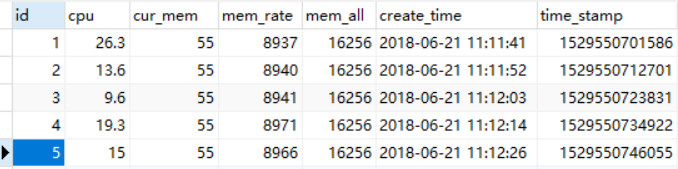
使用pycharm執行指令碼monit_system.py,等待5分鐘,就會插入30條資料。
如果指令碼沒有報錯,查看錶記錄,會有30條記錄
編輯檔案views.py,增加2個檢視函式
def chart(request):
    #顯示html檔案
    return render(request, "chart.html")

def chart_json(request):
    #讀取表所有記錄
    system_monit = models.system_monit.objects.all()
    data = []  # 建立一個空列表
    for i in system_monit:  # 遍歷,拼橫縱座標
        #橫座標為時間戳,縱座標為cpu使用率。注意,必須轉換型別,否則資料不對。
        data.append([int(i.time_stamp),float('%.2f' % i.cpu)])

    print(data)

    isdict = json.dumps(data)  # json序列化列表
    return HttpResponse(isdict, content_type="application/json")  # 執行型別為json
修改mysite下的urls.py,新增2個路徑
urlpatterns = [
    path('admin/', admin.site.urls),
    path('chart/', views.chart),
    path('chart_json/', views.chart_json),
]
訪問json的url
http://127.0.0.1:8000/chart_json/
必須保證格式,和上面cdn.rawgit.com連結的json格式一樣。
上的圖片是用了JSON Formatter外掛展示json資料的效果。
否則下面的步驟不用做了!!!
將line-time-series目錄下的index.htm檔案複製到django專案的templates目錄下,重新命名為chart.html
在django專案的static資料夾下,建立目錄Highcharts-6.1.0
將Highcharts-6.1.0解壓目錄中的3個檔案,複製到此目錄
修改部分程式碼,大家可以和index.htm對比一下,就知道修改的部分了。完整程式碼如下:
<!DOCTYPE HTML>
<html>
<head>
    <meta http-equiv="Content-Type" content="text/html; charset=utf-8">
    <meta name="viewport" content="width=device-width, initial-scale=1">
    <title>Highcharts Example</title>

    <style type="text/css">

    </style>
    {#配置favicon.ico,解決警告Not Found: /favicon.ico#}
    {% load staticfiles %}
    <link REL="SHORTCUT ICON" HREF="{% static "images/favicon.ico" %}"/>
</head>
<body>
<script src="../static/js/jquery-3.3.1.min.js"></script>
<script src="../static/Highcharts-6.1.0/highcharts.js"></script>
<script src="../static/Highcharts-6.1.0/modules/exporting.js"></script>
<script src="../static/Highcharts-6.1.0/modules/export-data.js"></script>

<div id="container" style="min-width: 310px; height: 400px; margin: 0 auto"></div>

<script type="text/javascript">
    {#解決顯示時間少8小時問題#}
    Highcharts.setOptions({global: {useUTC: false}});

    $.getJSON(
        {#'https://cdn.rawgit.com/highcharts/highcharts/057b672172ccc6c08fe7dbb27fc17ebca3f5b770/samples/data/usdeur.json',#}
        '/chart_json/',
        function (data) {

            Highcharts.chart('container', {
                chart: {
                    zoomType: 'x'
                },
                title: {
                    text: 'cpu使用率'
                },
                subtitle: {
                    text: document.ontouchstart === undefined ?
                        '單擊並拖動繪圖區域以放大' : '捏合圖表放大'
                },
                xAxis: {
                    type: 'datetime',

                },
                {#自定義x座標資訊顯示,return部分是用js拼接的,內容可以自己定義。#}
                tooltip: {
                    formatter: function () {
                        return '<strong>' + this.series.name + ':' + this.y + '%<br/></strong>' +
                            Highcharts.dateFormat('%Y-%m-%d %H:%M:%S', this.x);
                    }
                },
                yAxis: {
                    title: {
                        text: '使用率'
                    }
                },
                legend: {
                    enabled: false
                },
                plotOptions: {
                    area: {
                        fillColor: {
                            linearGradient: {
                                x1: 0,
                                y1: 0,
                                x2: 0,
                                y2: 1
                            },
                            stops: [
                                [0, Highcharts.getOptions().colors[0]],
                                [1, Highcharts.Color(Highcharts.getOptions().colors[0]).setOpacity(0).get('rgba')]
                            ]
                        },
                        marker: {
                            radius: 2
                        },
                        lineWidth: 1,
                        states: {
                            hover: {
                                lineWidth: 1
                            }
                        },
                        threshold: null
                    }
                },

                series: [{
                    type: 'area',
                    name: '百分比',
                    data: data
                }]
            });
        }
    );
</script>
</body>
</html>
專案檔案結構如下:
mysite/
├── blog
│   ├── admin.py
│   ├── apps.py
│   ├── __init__.py
│   ├── models.py
│   └── views.py
├── manage.py
├── monit_system.py
├── mysite
│   ├── __init__.py
│   ├── settings.py
│   ├── urls.py
│   └── wsgi.py
├── static
│   ├── css
│   ├── Highcharts-6.1.0
│   │   ├── highcharts.js
│   │   └── modules
│   │       ├── export-data.js
│   │       └── exporting.js
│   ├── images
│   │   └── favicon.ico
│   └── js
│       └── jquery-3.3.1.min.js
└── templates
    ├── chart.html
    ├── cur_time.html
    ├── detail.html
    └── index.html
使用pycharm啟動django專案,訪問url
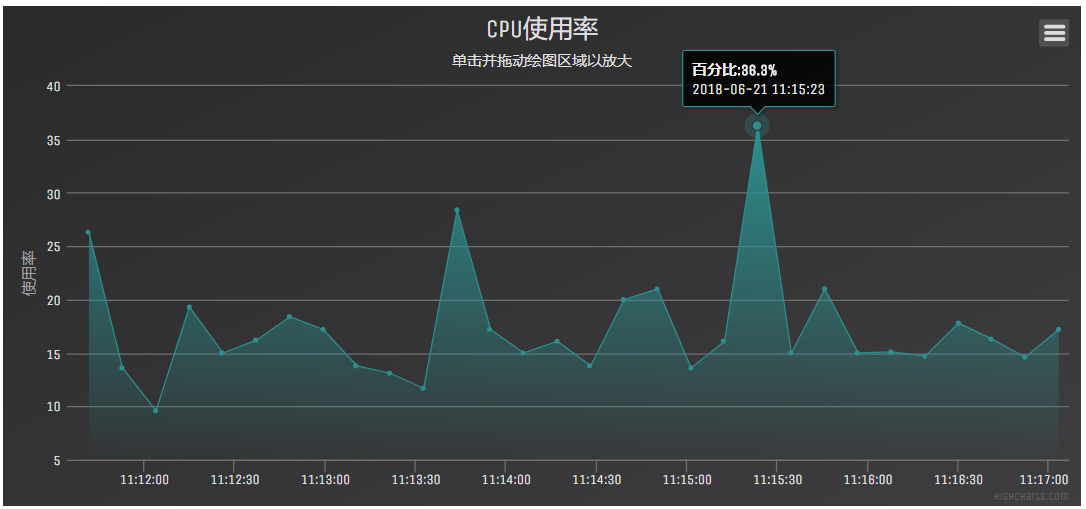
頁面效果如下:
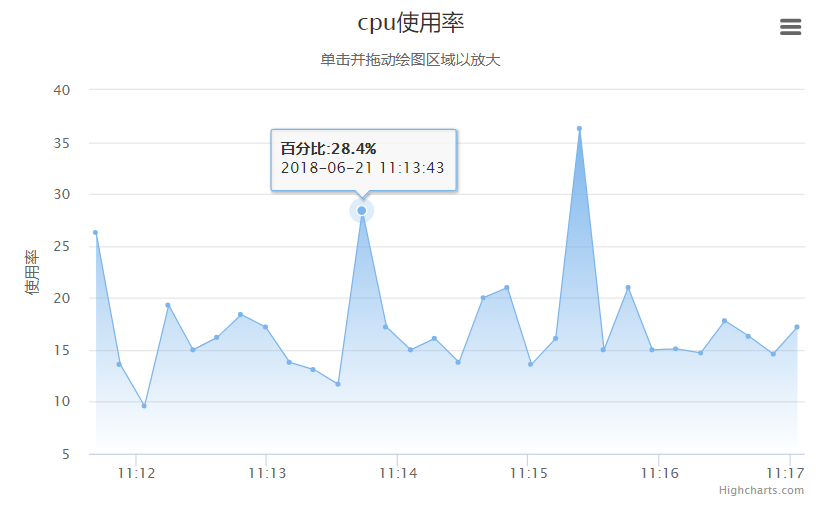
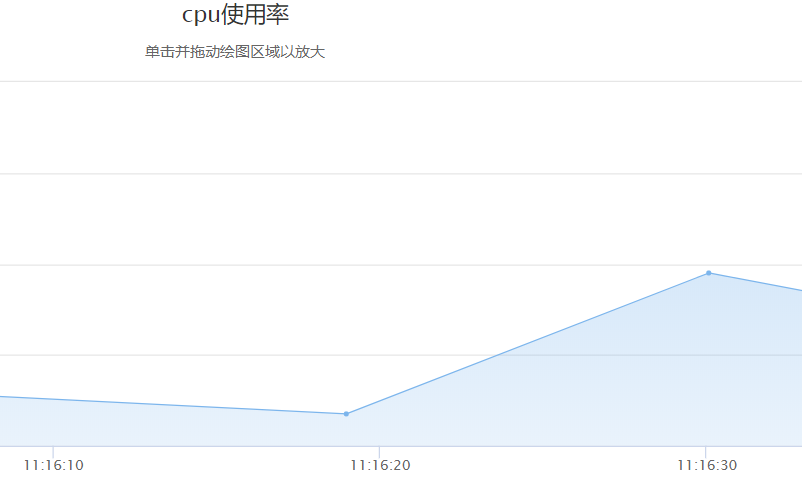
圖示支援放大和縮小,可以看到秒級的資料,比如
增加黑色主題
開啟解壓路徑,進入目錄Highcharts-6.1.0\code\themes,裡面有一個dark-unica.js檔案
在static\Highcharts-6.1.0目錄下建立目錄themes,將dark-unica.js檔案複製到此目錄
修改char.html檔案,在
<script src="../static/Highcharts-6.1.0/modules/export-data.js"></script>
下面一行新增如下程式碼,匯入主題js
{#黑色主題#}
<script src="../static/Highcharts-6.1.0/themes/dark-unica.js"></script>
再次訪問網頁,效果如下:
我的部落格即將搬運同步至騰訊雲+社群,邀請大家一同入駐:https://cloud.tencent.com/developer/support-plan?invite_code=vcus7uflzabs