
CPU profiler(gperftools)在嵌入式系統上的應用示例
上一篇博文《效能測試工具CPU profiler(gperftools)的使用心得》記錄了CPU profiler的基本使用方式。本文以halley2開發板為例記錄用CPU profiler在嵌入系統下進行效能分析的方法.
按照上文方法,已經可以讓自己的測試程式test_capture生成效能分析報告 test_capture.prof。然後將test_capture交叉編譯生成mips的可執行檔案。然後複製到halley2開發板上執行(我是用開發板上的SD卡來儲存程式),test_capture執行結束後,與在PC平臺上一樣生成效能分析報告 test_capture.prof。將 test_capture.prof複製到PC系統下(ubuntu).
如同在PC平臺上一樣,呼叫pprof,如下,會報一些找不到動態庫(.so)的錯誤。但文字的報告還是正常生成了。
# text方式輸出 pprof ./test_capture test_capture.prof --text Using local file ./test_capture. Using local file test_capture.prof. /usr/bin/objdump: '/lib/libc-2.22.so': No such file /usr/bin/objdump: '/lib/libgcc_s.so.1': No such file /usr/bin/objdump: '/lib/libm-2.22.so': No such file /usr/bin/objdump: '/lib/libpthread-2.22.so': No such file /usr/bin/objdump: '/lib/ld-2.22.so': No such file /usr/bin/addr2line: '/lib/libgcc_s.so.1': No such file /usr/bin/addr2line: '/lib/libc-2.22.so': No such file Total: 18659 samples 5523 29.6% 29.6% 5523 29.6% RunCascade 5519 29.6% 59.2% 5519 29.6% CanFaceCcd 1210 6.5% 65.7% 1218 6.5% StepImageHalfNormal 1117 6.0% 71.6% 1118 6.0% GetIntegralOfIma 1078 5.8% 77.4% 1078 5.8% GetSqIntegralOfIma 480 2.6% 80.0% 480 2.6% ImageFilter 448 2.4% 82.4% 448 2.4% ExtRegOnHor144_Mouth 439 2.4% 84.8% 439 2.4% ExtRegOnHor144 370 2.0% 86.7% 373 2.0% StepFaceConv 364 2.0% 88.7% 364 2.0% FindCandiRects 330 1.8% 90.5% 331 1.8% StepFaceConv1 217 1.2% 91.6% 217 1.2% PupilModel_Filter 179 1.0% 92.6% 179 1.0% ImageBinary 148 0.8% 93.4% 148 0.8% CheckEyePairsByMouth 148 0.8% 94.2% 148 0.8% GetHalfImage 89 0.5% 94.6% 89 0.5% StepFaceGeoMouth
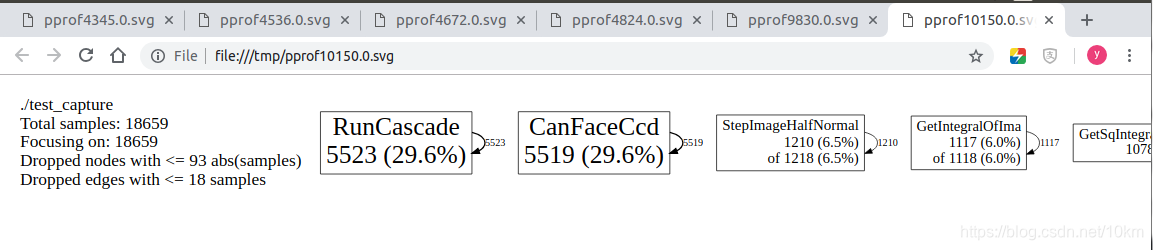
執行 pprof ./test_capture test_capture.prof --web輸出到瀏覽器的圖形報告也能正常生成,但同樣會報上面的錯誤。
出現上面錯誤的原因很直接,就是pprof找不到test_capture在mips平臺的依賴庫。
pprof有一個引數--lib_prefix就是用來解決這個問題的,執行google-pprof --help | grep lib_prefix就可以顯示--lib_prefix的用途:
google-pprof --help | grep lib_prefix
   --lib_prefix=<dir>  Comma separated list of library path prefixes # 逗號分隔的動態庫搜尋路徑列表
所以加上--lib_prefix指定這些缺失的動態庫所在的位置就好了,對於君正的編譯器這個位置在mips-gcc520-glibc222/mips-linux-gnu/libc。
pprof ./test_capture test_capture.prof --text  \
	--lib_prefix=/opt/toolchains/mips-gcc520-glibc222/mips-linux-gnu/libc
現在唯一沒搞明白的就是在mips平臺上生成的圖形報告的排版方式與PC平臺上不一樣,所有的節點幾乎都是橫著的,不知道是什麼原因。