wepy繪製雷達圖
阿新 • • 發佈:2018-12-03
程式碼如下:
<style lang='less'> .radar-canvas2 { width: 690rpx; height: 420rpx; } </style> <template> <canvas class='radar-canvas2' canvas-id='radar-canvas'></canvas> </template> <script> import wepy from 'wepy' var windowW = wx.getSystemInfoSync().windowWidth exportdefault class RadarCanvas extends wepy.component { props = { source: { default: [ {desc: '綜合', value: 0}, {desc: '思修法基', value: 0}, {desc: '史綱', value: 0}, {desc: '馬原', value: 0}, {desc: '毛中特', value: 0} ], type: Array } } data = { ctx:null, sideNum: 5, angle: 1.26, centerPointX: 345, centerPointY: 210, radius: 120 } methods = { drawCanvas: () => { let ctx = wx.createCanvasContext('radar-canvas') this.sideNum = this.source.length this.angle = Math.PI * 2 / this.sideNum this.centerPointX = this.rpx(690 / 2) this.centerPointY = this.rpx(420 / 2) this.radius = this.rpx(120) this.$apply() this.drawPolygon(ctx) this.drawRib(ctx) this.addDataPoint(ctx) this.linePoint(ctx) ctx.draw(false) } } drawPolygon(ctx) { ctx.setLineDash([2, 2]) ctx.setStrokeStyle('#E3E2E2') let r = this.rpx(30) for (let i = 1; i < 5; i++) { ctx.beginPath() let currR = r * i // 當前半徑 ctx.setFontSize(this.rpx(20)) ctx.setFillStyle('#8E8C8B') ctx.setTextAlign('right') ctx.fillText(25 * (i - 1), this.centerPointX - 5, this.centerPointY - r * (i - 1) + this.rpx(10)) // 最外面的是實線 if (i === 4) { ctx.setLineDash() } for (let j = 0; j < this.sideNum; j++) { let x = this.centerPointX + currR * Math.cos(this.angle * j + Math.PI / 3.3) let y = this.centerPointY + currR * Math.sin(this.angle * j + Math.PI / 3.3) ctx.lineTo(x, y) } ctx.closePath() ctx.stroke() } } drawRib(ctx) { ctx.setLineDash([2, 2]) // 虛線 ctx.setStrokeStyle('#E3E2E2') ctx.beginPath() for (let i = 0; i < this.sideNum; i++) { let x = this.centerPointX + this.radius * Math.cos(this.angle * i + Math.PI / 3.3) let y = this.centerPointY + this.radius * Math.sin(this.angle * i + Math.PI / 3.3) ctx.moveTo(this.centerPointX, this.centerPointY) ctx.lineTo(x, y) ctx.setFontSize(this.rpx(28)) ctx.setFillStyle('#8E8C8B') switch (i) { case 0: ctx.setTextAlign('left') ctx.fillText(this.source[i].desc, x, y + 20) break case 1: ctx.setTextAlign('right') ctx.fillText(this.source[i].desc, x, y + 20) break case 2: ctx.setTextAlign('right') ctx.fillText(this.source[i].desc, x - 10, y) break case 3: ctx.setTextAlign('center') ctx.fillText(this.source[i].desc, x, y - 10) break case 4: ctx.setTextAlign('left') ctx.fillText(this.source[i].desc, x + 10, y) break default: break } } ctx.closePath() ctx.stroke() } addDataPoint(ctx) { ctx.setLineDash() for (let i = 0; i < this.sideNum; i++) { let x = this.centerPointX + this.radius * Math.cos(this.angle * i + Math.PI / 3.3) * this.source[i].value let y = this.centerPointY + this.radius * Math.sin(this.angle * i + Math.PI / 3.3) * this.source[i].value ctx.beginPath() ctx.arc(x, y, this.rpx(4), 0, 2 * Math.PI) ctx.setFillStyle('#47D891') ctx.fill() ctx.closePath() } } linePoint(ctx) { ctx.setStrokeStyle('#47D891') ctx.beginPath() for (var i = 0; i < this.sideNum; i++) { var x = this.centerPointX + this.radius * Math.cos(this.angle * i + Math.PI / 3.3) * this.source[i].value var y = this.centerPointY + this.radius * Math.sin(this.angle * i + Math.PI / 3.3) * this.source[i].value ctx.lineTo(x, y) } ctx.closePath() ctx.setFillStyle('rgba(37,212,129,0.25)') ctx.fill() ctx.stroke() } rpx(param) { return Number((windowW / 750 * param).toFixed(2)) } } </script>
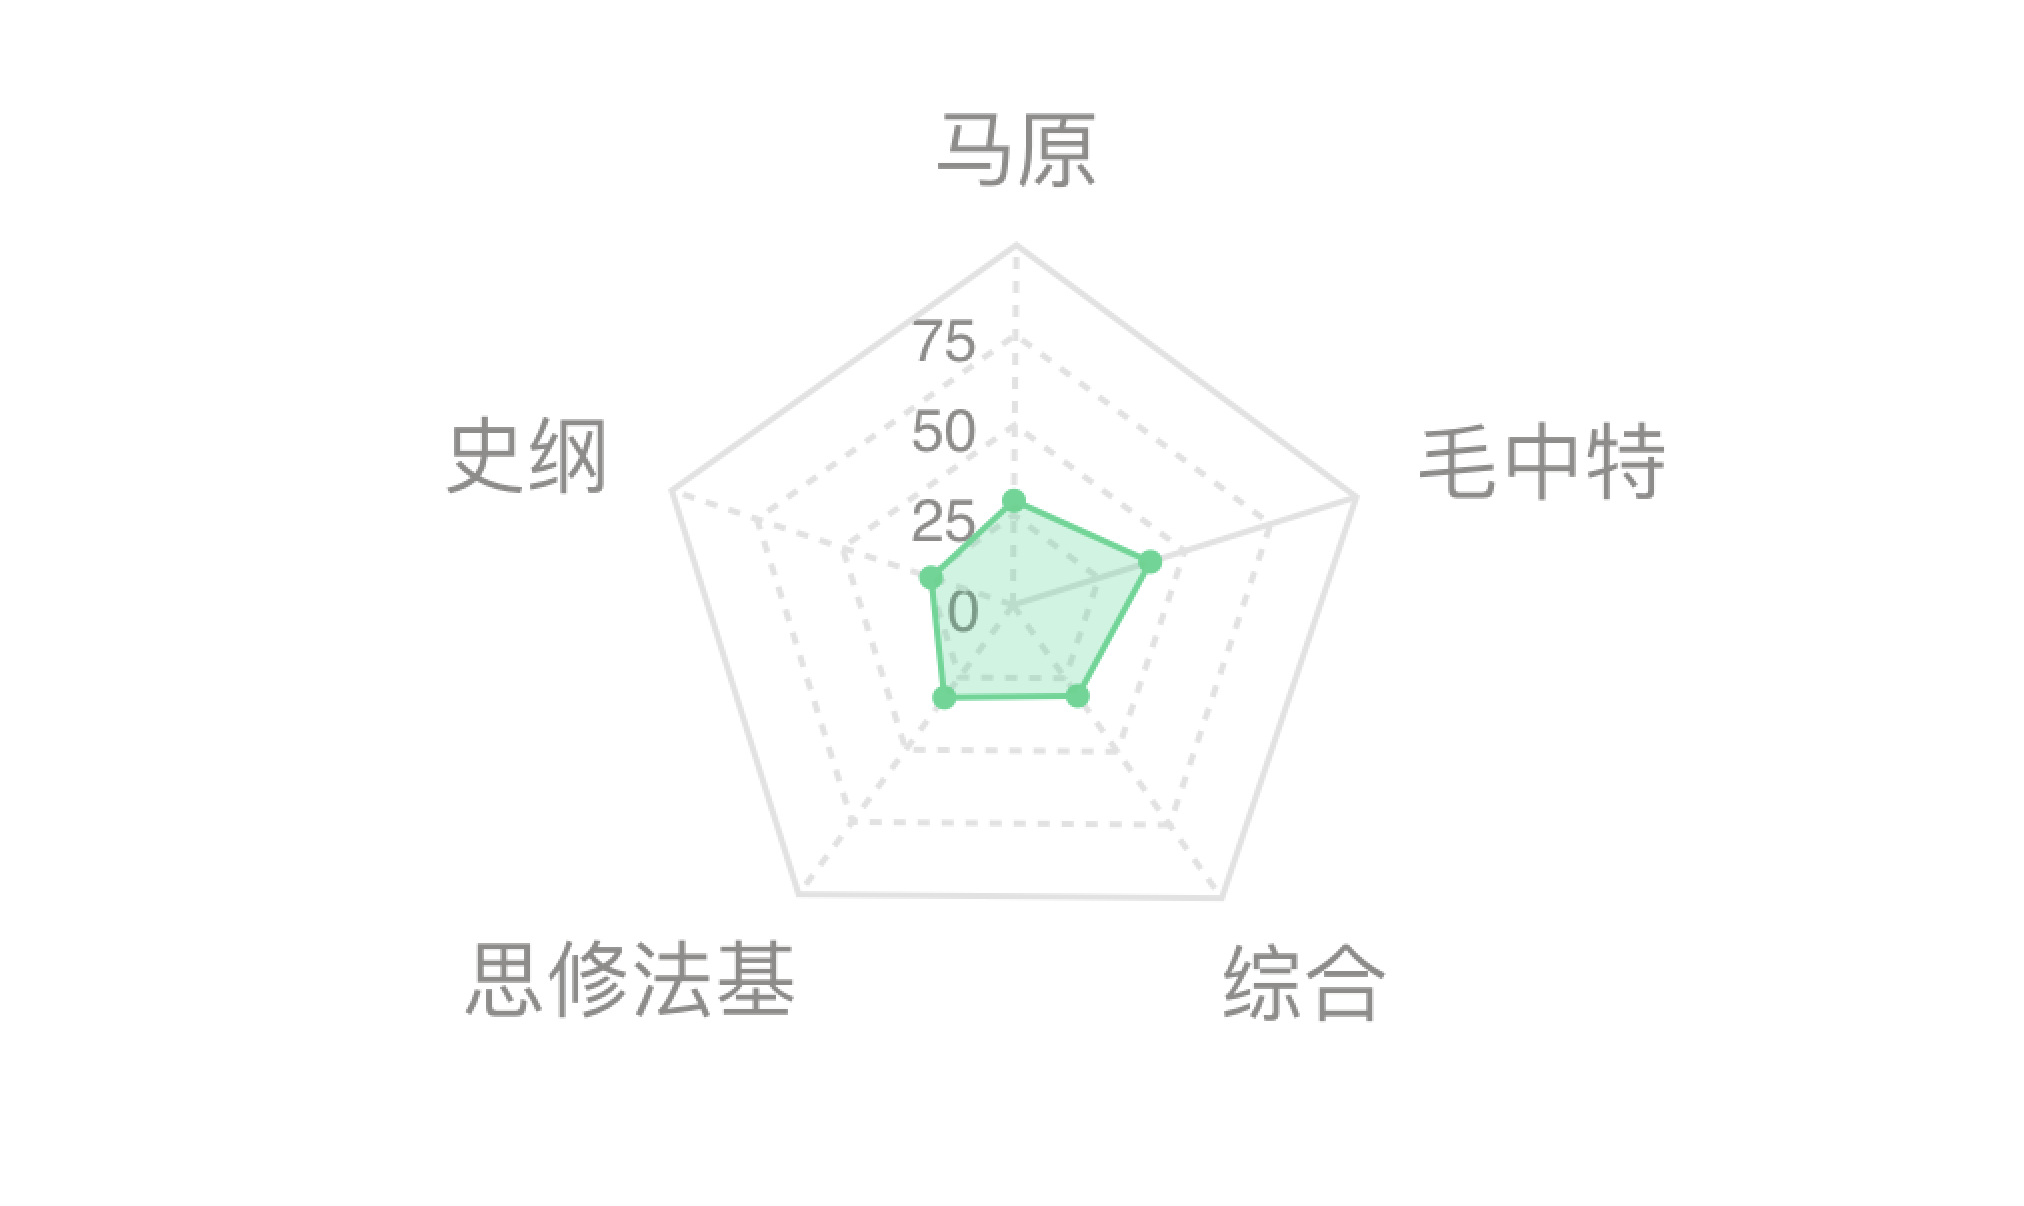
效果圖如下:

