
matplotlib.pyplot(plt)學習
參考一篇文章:https://blog.csdn.net/qq_28485501/article/details/82222512
前言:
在Matplotlib 結構中分位三個層次,分別為:後端層,藝術層,指令碼層。而pyplot就是一個指令碼層應用。它為使用者提供了很多的介面來讓使用者與後端層和藝術層一起工作。
import matplotlib.pyplot as plt
學習plt
figure與axes物件
兩者是不同的概念,axes是從屬於figure的:
比如 : figure,axes = plt.subplots( )
-
axes (物件): self.figure.add_subplots( )
可以新增feature,label,title ,contour and so on。 -
figure(物件):self.figure_manager.canvas.figure()
- figure.colorbar ( )
各個模組的所屬物件的除錯資訊如下:
in: plt.get_current_fig_manager()
out: Figuremanager object 0x106e1ea48
in:plt.get_current_fig_manager().figure
out:AttributeError 沒有這個屬性
in :plt.plot([1,2,3,4])
out:matplotlib.lines.Line2D at 0x256154152 GUI:Some features that we can add to plots
plt本質上上來說,就是作為一個GUI的功能,顯示繪畫的函式,並對主體的GUI進行裝飾,以下的元件都是放在axes的容器中的,由axes來管理!
- adding a grid :plt.grit( ),設定網格線
- handling axes :plt.axis( )設定座標軸刻度,(x,y)的四個值。
- adding albels :plt.xlabel( ),plt.ylabel( ),增加座標軸標籤
- adding title :plt.title( ):增加標題
- adding a legend :plt.legend( ):增加說明各個Line2D物件註釋
- add contour :plt.contour(matrix);為三點繪製邊界線
markers and line styles(圖元)
- colors
| Color abbreviation | Color Name |
|---|---|
| b | blue |
| c | cyan |
| g | green |
| k | black |
| m | magenta |
| r | red |
| w | white |
| y | yellow |
- line styles
| Style abbreviation | Style |
|---|---|
| - | solid line |
| - - | dashed line |
| -. | dash-dot line |
| : | dotted line |
- makers styles
| Marker abbreviation | Marker style |
|---|---|
| . | Point marker |
| , | Pixel marker |
| o | Circle marker |
| v | Triangle down marker |
| ^ | Triangle up marker |
| < | Triangle left marker |
| > | Triangle right marker |
| 1 | Tripod down marker |
| 2 | Tripod up marker |
| 3 | Tripod left marker |
| 4 | Tripod right marker |
| s | Square marker |
| p | Pentagon marker |
| * | Star marker |
| h | Hexagon marker |
| H | Rotated hexagon marker |
| + | Plus marker |
| x | Cross (x) marker |
| D | Diamond marker |
| d | Thin diamond marker |
| | | Vertical line (vlinesymbol) marker |
| _ | Horizontal line(hline symbol)marker |
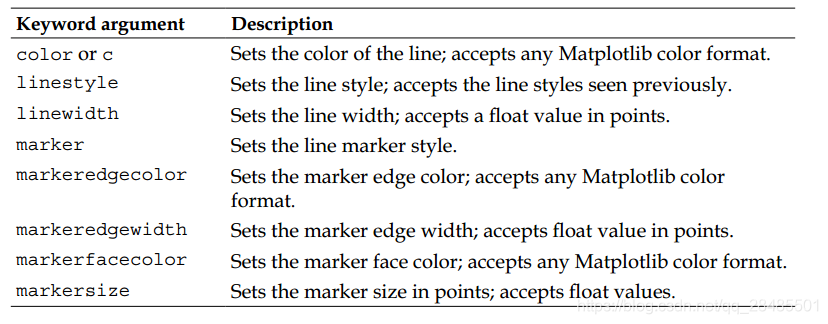
Finer control with keyword arguments
Text inside figure, annotations,and arrows
- Text inside figure
plt.text(point,text) - Annotations
plt.annotate(text,piont)
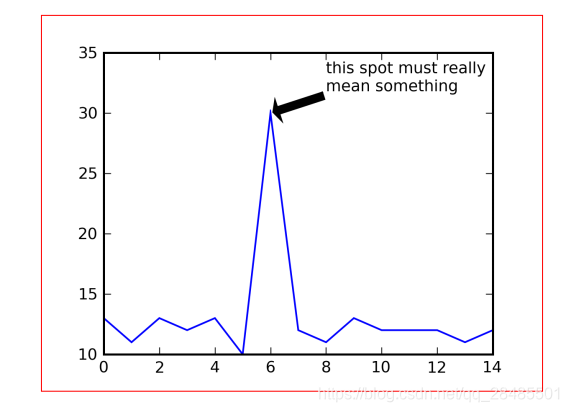
- Arrow
plt.arrow(x,y,dx,dy)
| Name | Attributes |
|---|---|
| - | None |
| -> | head_length=0.4, head_width=0.2 |
| -[ | WidthB=1.0, lengthB=0.2, angleB=None |
| <- | head_length=0.4, head_width=0.2 |
| <-> | head_length=0.4, head_width=0.2 |
| fancy | head_length=0.4, head_width=0.4, tail_width=0.4 |
| simple | head_length=0.5, head_width=0.5, tail_width=0.2 |
| wedge | tail_width=0.3, shrink_factor=0.5 |
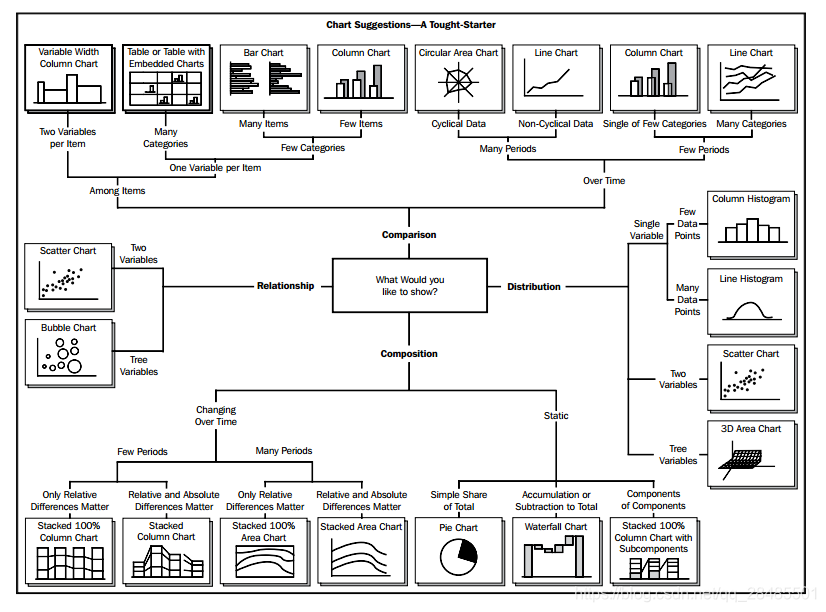
plt繪製不同圖表
plt.plot : 參見下文的plot資料的過程。
plt.hist
plt.errorbar
plt.bar
plt.pie
plt.scatter
plt.polar
pyplot作用
是充當一個GUI的作用
figure內建在pyplot中,所以不用其餘的操作,直接plt.show()直接畫出GUI影象。
plt.show()的函式作用和win.mainloop()函式是一樣的,如果不呼叫,就不會顯示影象。
面向物件
返回的都是一些有容器概念的物件,它們承載圖元(primitives)
- plt.figure()
return Figure(640x480) - plt.subplots()
返回Figure object and AxesSubplot object - plt.add_subplot()
返回AxesSubplot object - canvas是FigureCanvas的抽象的實現。由plt.get_current_fig_manager().canvas管理
- plt.plot()
返回(return) Line2D object
在pyploy庫中,plot(): This function calls the plot method in the current figure’s Axes object and the figure canvas’s draw* method (as identified in the preceding setup)
pyplot.plot()data的過程分析
- Plot the given data:
- Get the figure manager (or create one if it doesn’t exist).
- Get its figure canvas.
- From this, get the figure object of the canvas.
- From the figure object, get the current axes object (or create it if it doesn’t exist).
- Once the figure’s axes object is available, call its plot function.
- The axes plot function clears the axes and creates some lines based on the provided data.
- Get the active figure manager.
- Call the figure manager’s canvas.draw() function.
GUI+Figure:
GUI提供後端,然後matplotlib提供藝術層的圖形的圖元和容器
GUI工具連線Figure兩者可以畫出一幅影象出來,不過中間需要Canvas的幫忙,例如Tk的gui則要呼叫
canvas = FigureCanvasTkAgg(fig, master=root)
canvas._tkcanvas.pack(side=tk.TOP, fill=tk.BOTH, expand=1)
'''show的功能'''
root.update()
root.deiconify()
root.mainloop()