期末大作業,最後一週上課檢查
阿新 • • 發佈:2018-12-13
#讀取資料
from sklearn.datasets import load_boston   #匯入房價資料集
boston=load_boston()
boston.data
boston.target
boston.data.shape
#將資料轉化為資料框形式
import pandas as pd
df=pd.DataFrame(x)
df


#建立變數與房價之間的預測模型
import matplotlib.pyplot as plt
x=boston.data[:,5]     #下標2表示feature_names 的‘INDUS'
y=boston.target
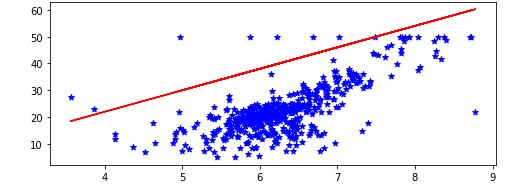
plt.figure(figsize=(8,3))#指定顯示圖大小
plt.scatter(x,y,c='b',marker='*')
plt.plot(x,8*x-10,'r')#迴歸線
plt.show()


#通過訓練集和測試集劃分得出實際模型
from sklearn.linear_model import LinearRegression
from sklearn.model_selection import train_test_split
x_train,x_test,y_train,y_test=train_test_split(boston.data[:,5],boston.target,test_size=0.3, )#劃分訓練和測試資料集
lineR=LinearRegression()
lineR.fit(x_train.reshape(-1,1),y_train)  #對資料進行訓練
#lineR.coef_   #通過訓練得到斜率
lineR.intercept_   #通過訓練得到截距
plt.figure(figsize=(8,3))#指定顯示圖大小
plt.scatter(x_train,y_train,c='b',marker='*')
plt.plot(x,9*x-37,'r')#迴歸線
plt.show()

# 檢測模型好壞
x_train,x_test,y_train,y_test=train_test_split(boston.data[:,5],boston.target,test_size=0.3, )#劃分訓練和測試資料集
print(x_train.shape,y_train.shape)
lineR=LinearRegression()
lineR.fit(x_train,y_train)  #對資料進行訓練
lineR.coef_   #通過訓練得到斜率
lineR.intercept_   #通過訓練得到截距
import numpy as np
x_predict = lineR.predict(x_test)
print("預測的均方誤差:", np.mean(x_predict - y_test)**2)# 列印預測的均方誤差
print("模型的分數:",lineR.score(x_test, y_test))# 列印模型的分數----


