
【 MATLAB 】gca 介紹(當前軸或圖表)
gca
Current axes or chart
Syntax
ax = gca
Description
ax = gca
ax = gca
Graphics functions, such as title, target the current axes or chart. Use ax
gca creates Cartesian axes.
圖形功能(例如標題)以當前軸或圖表為目標。 使用ax訪問和修改軸或圖表的屬性。 如果軸或圖表不存在,則gca建立笛卡爾座標軸。
Specify Properties for Current Axes
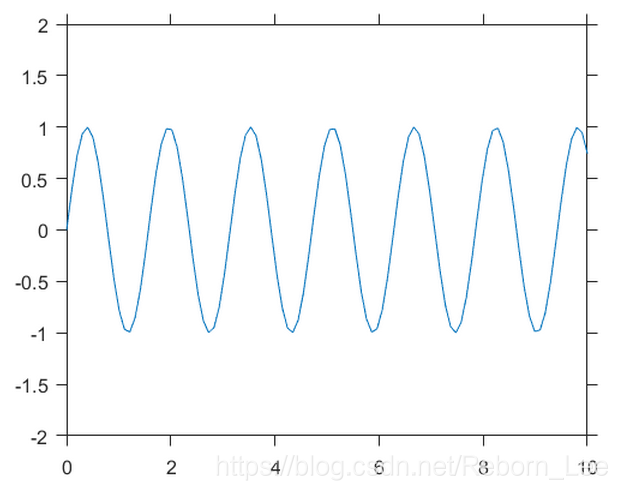
Plot a sine wave.
x = linspace(0,10);
y = sin(4*x);
plot(x,y)

Set the font size, tick direction, tick length, and y-axis limits for the current axes. Use gca to refer to the current axes.
Note: Starting in R2014b, you can use dot notation to set properties. If you are using an earlier release, use the docid:matlab_ref.f67-432995 function instead, such as set(ax,'FontSize',12).
ax = gca; % current axes
ax.FontSize = 12;
ax.TickDir = 'out';
ax.TickLength = [0.02 0.02];
ax.YLim = [-2 2];
Tips
-
User interaction can change the current axes or chart. It is better to assign the axes or chart to a variable when you create it instead of relying on
gca. -
使用者互動可以更改當前軸或圖表。 最好在建立變數時將軸或圖表分配給變數,而不是依賴於gca。
-
Changing the current figure also changes the current axes or chart.
-
更改當前圖形也會更改當前軸或圖表。
-
Set axes properties after plotting since some plotting functions reset axes properties.
-
繪圖後設置軸屬性,因為某些繪圖功能會重置軸屬性。
-
To access the current axes or chart without forcing the creation of Cartesian axes, query the figure
CurrentAxesproperty. MATLAB® returns an empty array if there is no current axes. -
要在不強制建立笛卡爾座標軸的情況下訪問當前軸或圖表,請查詢圖形CurrentAxes屬性。 如果沒有當前軸,MATLAB®將返回一個空陣列。
fig = gcf; ax = fig.CurrentAxes;Starting in R2014b, you can query properties using dot notation. If you are using an earlier release, use thegetfunction instead, such asax = get(fig,'CurrentAxes'). - 從R2014b開始,您可以使用點表示法查詢屬性。 如果您使用的是早期版本,請改用get函式,例如
ax = get(fig,'CurrentAxes').
上例中,如果加入語句:
fig = gcf; ax = fig.CurrentAxes;
則得到:
ax =
Axes - 屬性:
XLim: [0 2]
YLim: [-100 20]
XScale: 'linear'
YScale: 'linear'
GridLineStyle: '-'
Position: [0.1300 0.1100 0.7750 0.8150]
Units: 'normalized'