TensorFlow非線性擬合
阿新 • • 發佈:2018-12-18
1、心得: 在使用TensorFlow做非線性擬合的時候注意的一點就是輸出層不能使用啟用函式,這樣就會把整個區間對映到啟用函式的值域範圍內無法收斂。
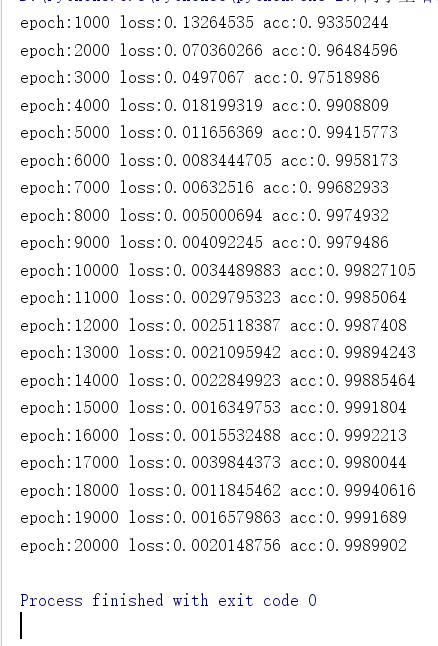
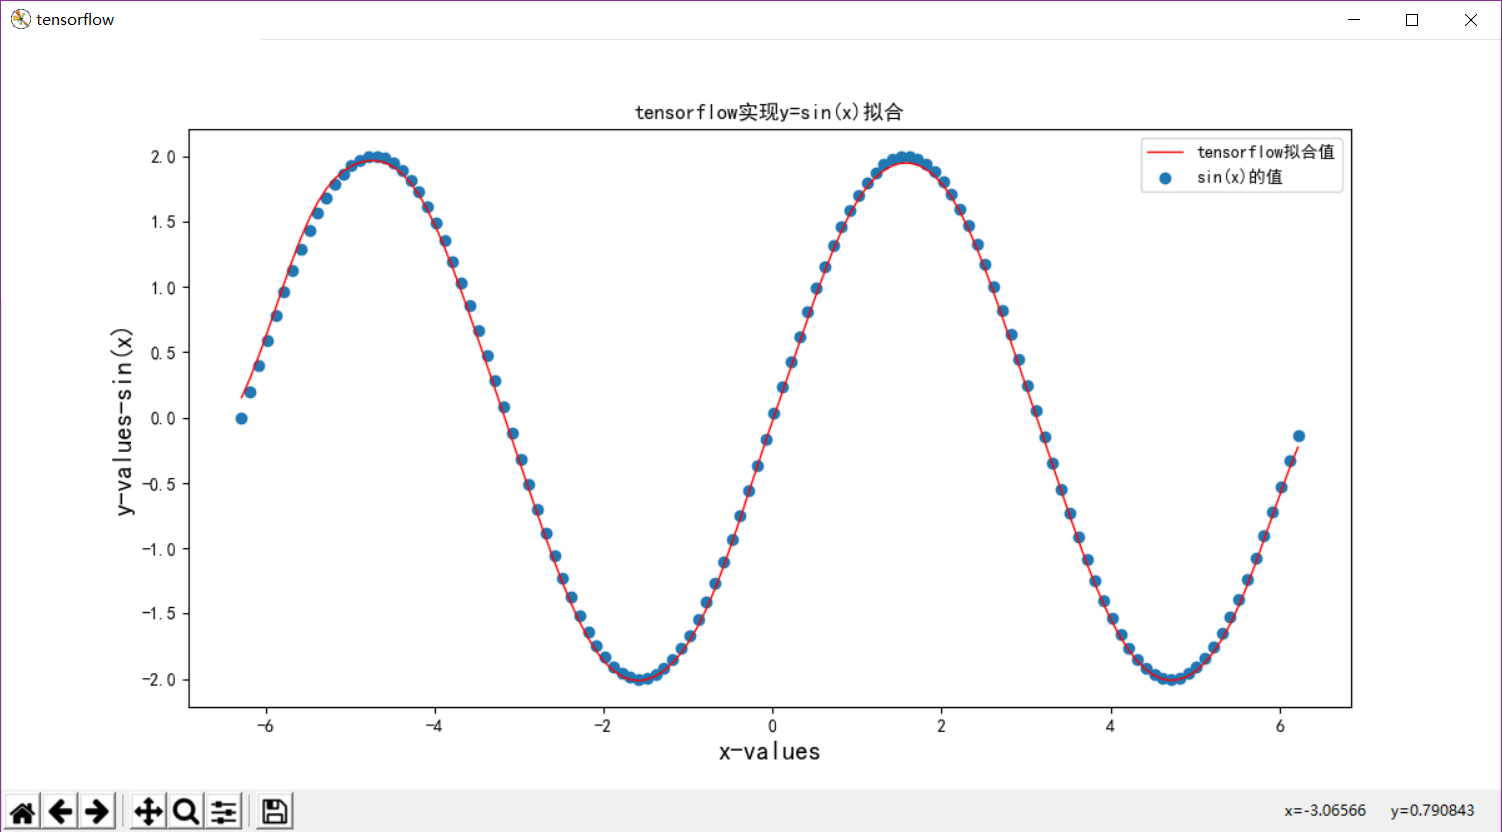
# coding:utf-8 import tensorflow as tf import numpy as np import matplotlib.pyplot as plt import os os.environ['TF_CPP_MIN_LOG_LEVEL'] = '2' # 準備需要擬合的資料點 x_data = np.arange(-2*np.pi,2*np.pi,0.1).reshape(-1,1) y_data= np.sin(x_data).reshape(-1,1)*2 # 建立TensorFlow網路模型 x = tf.placeholder(tf.float32,[None,1]) y = tf.placeholder(tf.float32,[None,1]) # 定義權重 weights = { 'w1':tf.Variable(tf.random_normal([1,10],stddev=0.1)), 'w2':tf.Variable(tf.random_normal([10,20],stddev=0.1)), 'out':tf.Variable(tf.random_normal([20,1],stddev=0.1)) } biases= { 'b1':tf.Variable(tf.random_normal([10])), 'b2':tf.Variable(tf.random_normal([20])), 'out':tf.Variable(tf.random_normal([1])) } # 定義模型 def deep_liner_model(_x,_weights,_biases): y1 = tf.nn.tanh(tf.add(tf.matmul(_x,_weights['w1']),_biases['b1'])) y2 = tf.nn.tanh(tf.add(tf.matmul(y1,_weights['w2']),_biases['b2'])) # 在計算的時候最後一層別使用啟用函式,會進行對映不收斂的。 out = tf.add(tf.matmul(y2,_weights['out']),_biases['out']) return out y_pred = deep_liner_model(x,weights,biases) # 損失函式:使用歐式距離 # loss = tf.sqrt(tf.reduce_sum(tf.pow(y-y_pred,2))) loss = tf.reduce_mean(tf.square(y-y_pred)) # 優化器:訓練方法 optm = tf.train.GradientDescentOptimizer(learning_rate=0.1).minimize(loss) #optm = tf.train.AdadeltaOptimizer(learning_rate=0.01).minimize(loss) # 準確率:R方評估 R2 = 1 - tf.reduce_sum(tf.pow(y-y_pred,2))/tf.reduce_sum(tf.pow(y-tf.reduce_mean(y_pred),2)) acc_score = tf.reduce_mean(tf.cast(R2,tf.float32)) # 萬事俱備只欠訓練了。 with tf.Session() as sess: # 初始化全域性變數 sess.run(tf.global_variables_initializer()) # 開始迭代首先使用一萬次 for i in range(20000): sess.run(optm,feed_dict={x:x_data,y:y_data}) if (i+1)%1000==0: acc = sess.run(acc_score,feed_dict={x:x_data,y:y_data}) avg_loss = sess.run(loss,feed_dict={x:x_data,y:y_data}) print('epoch:%s loss:%s acc:%s'%(i+1,str(avg_loss),str(acc))) y_predict = sess.run(y_pred,feed_dict={x:x_data}) plt.figure('tensorflow',figsize=(12,6)) plt.scatter(x_data, y_data,label='sin(x)的值') plt.plot(x_data,y_predict,'r',linewidth=1,label='tensorflow擬合值') plt.rcParams['font.sans-serif'] = ['SimHei'] # 設定字型為SimHei顯示中文 plt.rcParams['axes.unicode_minus'] = False # 設定正常顯示符號 plt.title('tensorflow實現y=sin(x)擬合') plt.xlabel('x-values',{'size':15}) plt.ylabel('y-values-sin(x)',{'size':15}) plt.legend(loc='upper right') plt.show()