數字訊號處理——MATLAB實驗(一)
阿新 • • 發佈:2018-12-20
實驗名稱: 離散時間訊號和系統的時域分析
一、實驗目的:
熟悉Mat lab中產生訊號和繪製訊號的基本命令,掌握產生離散時間訊號的基本方法;掌握離散時間系統對輸入訊號的簡單運算處理,驗證離散時間系統有關特性。
二、實驗內容及要求:
1. 離散時間訊號的時域分析:
(1)修改程式P1.1,產生單位抽樣序列 並繪圖。 (2)修改程式P1.1,產生單位步長序列 並繪圖。 (3)修改程式P1.4,產生長度為50、頻率為0.08、振幅為2.5、相移為90度的一個正弦序列並繪圖,該序列的週期是多少?
2. 離散時間系統的時域分析:
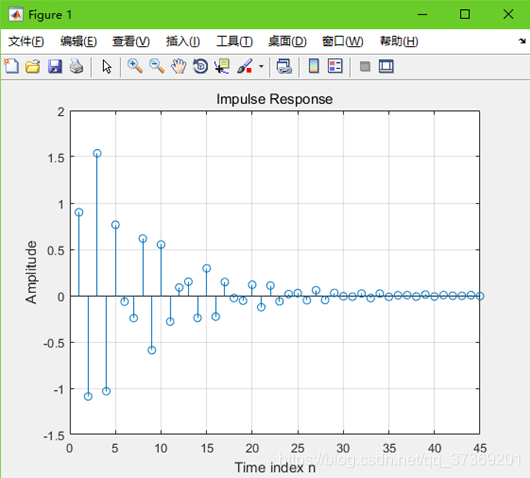
(1)修改程式P2.3,其中a=4, b=-6, 並繪圖,該離散時間系統是線性嗎? (2)修改程式P2.4,其中D=15, 並繪圖,該離散時間系統是時不變嗎? (3)修改程式P2.5,產生如下因果線性時不變系統的衝激響應的前45個樣本並繪圖: (4)執行程式P2.7,對序列 和 求卷積生成 ,並用FIR濾波器 對輸入 濾波,求得 ; 和 有差別嗎?為什麼要使用對 補零後得到的 作為輸入來產生 ?
三、實驗結果及問題回答:
1. 離散時間訊號的時域分析:
(1)實驗結果:
% Program P1_1
% Generation of a Unit Sample Sequence
clf;
% Generate a vector from -10 to 20
n = -10:20;
% Generate the unit sample sequence
u = [zeros(1,21) 1 zeros(1,9)];
% Plot the unit sample sequence
stem(n,u);
xlabel('Time index n');ylabel('Amplitude');
title('Unit Sample Sequence');
axis([-10 20 0 1.2]);
 (2)實驗結果:
% Program P1_1
% Generation of a Unit Sample Sequence
clf;
% Generate a vector from -10 to 20
n = -10:20;
% Generate the unit sample sequence
u = [zeros(1,3) ones(1,28)];
% Plot the unit sample sequence
stem(n,u);
xlabel('Time index n');ylabel('Amplitude');
title('Unit Step Sequence');
axis([-10 20 0 1.2]);
 (3)實驗結果:
  % Program P1_4
    % Generation of a sinusoidal sequence
    n = 0:50;
    f = 0.08;
    phase = pi/2;
    A = 2.5;
    arg = 2*pi*f*n - phase;
    x = A*sin(arg);
    clf;            % Clear old graph
    stem(n,x);      % Plot the generated sequence
    axis([0 40 -4 4]);
    grid;
    title('Sinusoidal Sequence');
    xlabel('Time index n');
    ylabel('Amplitude');
    axis;

2. 離散時間系統的時域分析:
(1)實驗結果:
% Program P2_3
% Generate the input sequences
clf;
n = 0:40;
a = 4;b = -6;
x1 = cos(4*pi*0.1*n);
x2 = cos(4*pi*0.4*n);
x = a*x1 + b*x2;
num = [2.2403 2.4908 2.2403];
den = [1 -0.4 0.75];
ic = [0 0]; % Set zero initial conditions
y1 = filter(num,den,x1,ic); % Compute the output y1[n]
y2 = filter(num,den,x2,ic); % Compute the output y2[n]
y = filter(num,den,x,ic); % Compute the output y[n]
yt = a*y1 + b*y2;
d = y - yt; % Compute the difference output d[n]
% Plot the outputs and the difference signal
subplot(3,1,1)
stem(n,y);
ylabel('Amplitude');
title('Output Due to Weighted Input: a \cdot x_{1}[n] + b \cdot x_{2}[n]');
subplot(3,1,2)
stem(n,yt);
ylabel('Amplitude');
title('Weighted Output: a \cdot y_{1}[n] + b \cdot y_{2}[n]');
subplot(3,1,3)
stem(n,d);
xlabel('Time index n');ylabel('Amplitude');
title('Difference Signal');
 (2)實驗結果:
% Program P2_4
% Generate the input sequences
clf;
n = 0:40; D = 15;a = 3.0;b = -2;
x = a*cos(4*pi*0.1*n) + b*cos(4*pi*0.4*n);
xd = [zeros(1,D) x];
num = [2.2403 2.4908 2.2403];
den = [1 -0.4 0.75];
ic = [0 0]; % Set initial conditions
% Compute the output y[n]
y = filter(num,den,x,ic);
% Compute the output yd[n]
yd = filter(num,den,xd,ic);
% Compute the difference output d[n]
d = y - yd(1+D:41+D);
% Plot the outputs
subplot(3,1,1)
stem(n,y);
ylabel('Amplitude');
title('Output y[n]'); grid;
subplot(3,1,2)
stem(n,yd(1:41));
ylabel('Amplitude');
title(['Output due to Delayed Input x[n ?, num2str(D),']); grid;
subplot(3,1,3)
stem(n,d);
xlabel('Time index n'); ylabel('Amplitude');
title('Difference Signal'); grid;
 (3)實驗結果:
%%
clf;
N = 45;
num1 = [0.9 -0.45 0.35 0.002];
den1 = [1 0.71 -0.46 -0.62];
y1 = impz(num1,den1,N);
% Plot the impulse response
figure(1)
 stem(y1);
xlabel('Time index n'); ylabel('Amplitude');
title('Impulse Response'); grid;
 (4)實驗結果
沒有差別。對x[n]補零是因為filter函式產生的輸出序列和輸入序列相等,而兩訊號卷積得到的序列長度為N1+N2-1,所以要補相應個數的零。
