Tracking transactions on the blockchain with nodejs and kafka
Tracking transactions on the blockchain with nodejs and kafka
In this blog post im going to give some insight into a project that i did recently with nodes and Kafka. The purpose of the project is to analyze the transaction values sent into and out of an account on the ethereum block chain. This involves regenerating data for the blocks that were minted in the past as well as analyzing future blocks.
First im going to give a brief overview over the whole architecture of this setup, then i will go into detail for each section and share some learnings. For example deployment workflow, what each service does and more.
BTW: The frontend part of the project can be found here: https://ethwalletflows.now.sh/
PS: If you are looking for some details about kafka, have a look at section: Worker-Service


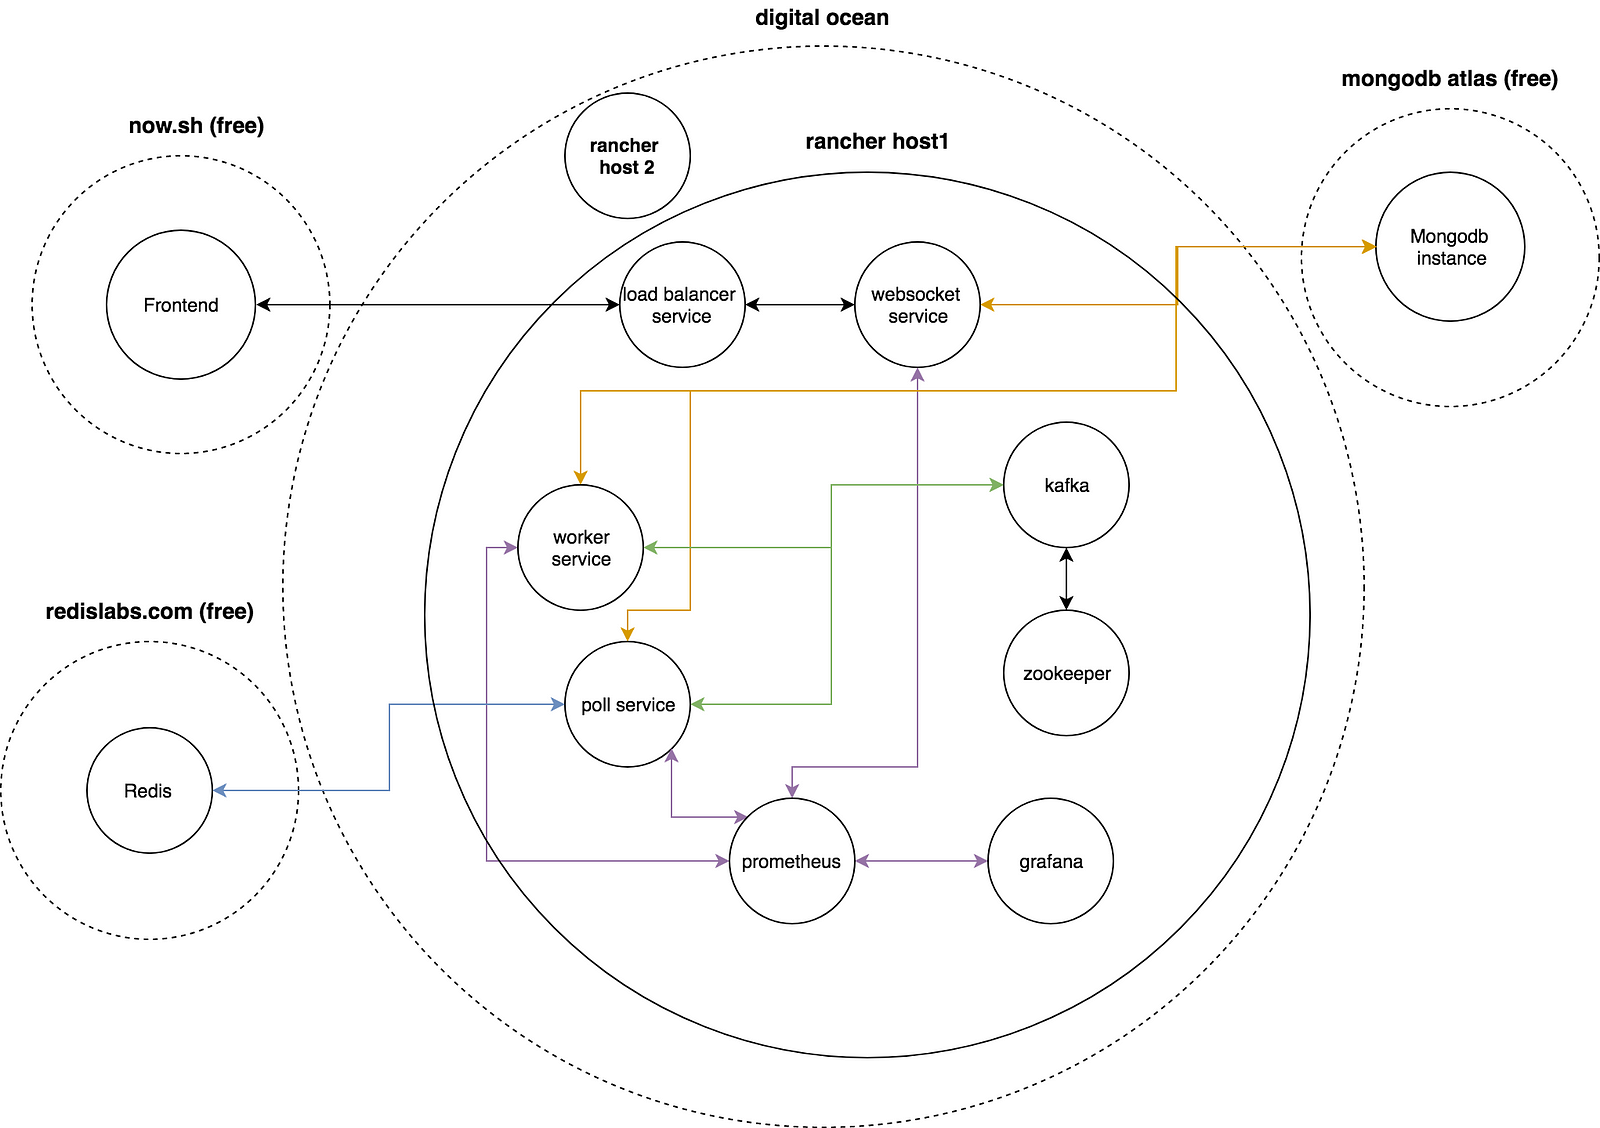
As seen on the illustration the app consists of a frontend and a backend. The frontend is hosted on now.sh and is separate from the backend which is hosted on digital ocean. Data is stored in Mongodb and on Redis, both are hosted on external providers for free.
I’m using rancher as container management framework which is installed on rancher host 1 / 2. Host 2 is hosting all the app containers. The backend consists of 3 main services: 1. Poll-service, 2. Worker-service, 3. ws-service. Additional services are Kafka + zookeeper for data-pipeline, Prometheus + grafana for metrics.
Poll-Service
The poll service is responsible to poll the blockchain for new blocks and add them to the block topics in kafka. The worker service will query the block and index the relevant transactions. The blockheight is stored in redis.
Worker-Service
The worker-service is consuming data from kafka and inserting / querying data from mongodb and also producing new events in kafka.
Confession: In the beginning i wanted to use an quick and dirty self-made redis based worked queue but in the end the self balancing consumer groups were the perfect fit.
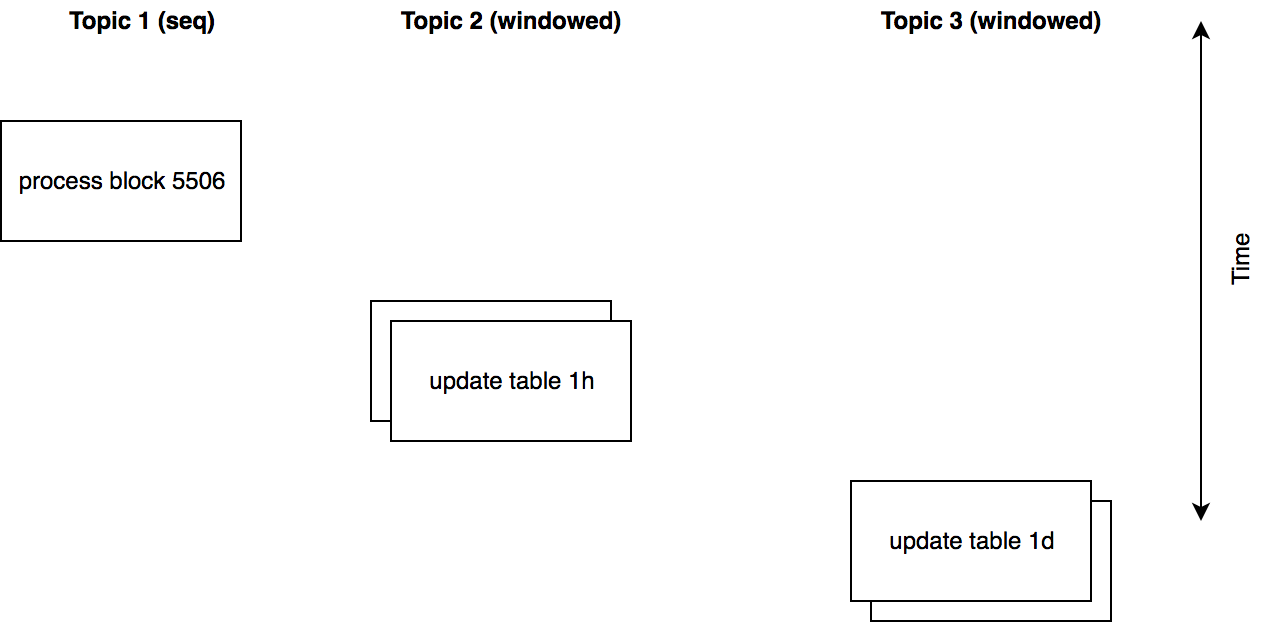
Each worker is running 4 consumers one for each topic, im using one consumer group. I can scale up to 10 workers because each topic got 10 partitions.
There are 2 modes a consumer can run in.
One mode is seqential mode (autocommit=false), after handeling one event it will be commited.
Windowed mode is the mode were the consumer waits for a certain amount of events to arrive, once the window / buffer is full it deduplicates the batch of events and processes it seqential.


The app contains 4 tables, each tables state can be generated from the previous tables state: table1 (raw) <table2 (1h) < table3 (1d) < table4 (1m), that way at least once delivery of kafka events is not an concern, the resulting data of an computation can just be more recent should one event be processed 2 times.
To make the the whole windowing and seq. committing work with node-kafka i build my own observable based consumer / producer on top of it because exisiting solutions didnt work as expected.
The worker is reporting metrics to prometheus in an fixed interval, that makes it possible to see how much events one worker is processing in a certain timeframe.
Learnings:
- kafka and observables are working very well together, using native rxjs pipe-operators makes things so easy and straight forward
- make up your mind about how many topics you need and how many partitions you want early
- self balancing consumer groups are a blessing with up / down scaling
- kafka without flow control can eat up unnecessary much memory, depending on how much unprocessed events are in an partition / topic
WS-Service
The websocket service is mainly responsible to receive events from the client and return data accordingly. I choose websockets, because in the future i might want to provide real-time updates for the displayed data. I used observables extensively because they just make much sense to me in the context of event streams.
Rancher (docker-management)
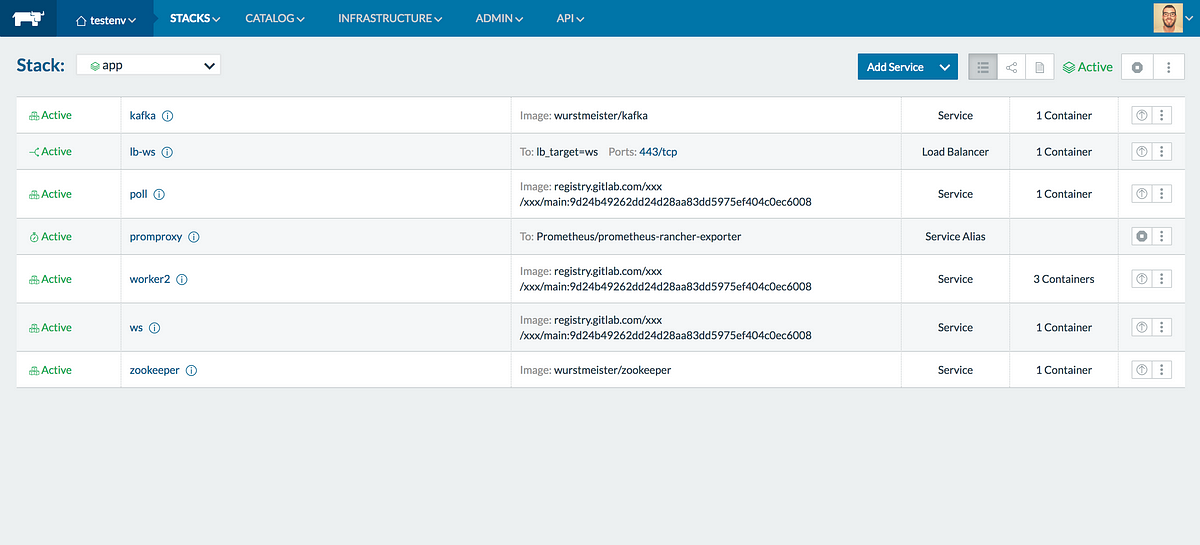
Just to clearify at the beginning rancher has 2 components, rancher-client and rancher-server. The picture below is the webinterface of rancher-server.


Everyone knows the pain of using docker-compose without an GUI. Rancher is kinda like docker-compose but with way more features and an GUI. The cool thing is, you can use your existing docker-compose files and import them in rancher to create an stack. It comes with an API and ready to go stacks which can be one click installed.
Pros:
- rancher-server comes as a docker image, so its installed with an single liner
- comes with an nice interface, which allows up / down scaling on click
- load balancers are easy to setup
- easy access to logs and the terminal of a docker container (super nice for hands on debugging)
- docker image upgrades can be rolled back with one click
Cons:
- infrasturcture can be exported as a file but you cannot reimport an updated file and expect it to adjusts the stack accordingly
- API access keys are not scoped — one key can do everything :(
- sometimes a bit unstable ( i had freezes, containers stuck an a certain state)
- installation of rancher-clients by hand is a bit cumbersome, using the machine drivers for digital ocean and Aws is more reliable
Logging
For logging i used google-stackdriver main reason was that it offers more volume for free then loggly or papertrail. I can also do crash reporting and such, but i didnt implment that yet.
Learnings:
- Crashes are not logged well, thats something to improve
- Google allows to disable logging, so the logs wont be ingested and are discarded when they arrive
Metrics
It was the first time that i implemented some metrics for an nodejs app. And it was interesting to see in realtime how much load and events the app is processing. I used grafana for visualizing the data and prometheus for storing the metrics.
Learnings:
- decided on push or pull metrics early — is your service pushing the metrics to prometheus or is prometheus pulling the metrics, push is less reliable but easier to setup, pull requires service discovery
- Grafana supports setting alerts which can be useful for getting notified about a failure of a service
- learning some Grafana query language can be useful to create some advanced charts, using the sum operator is just the beginning
Hosting
I chooese digital ocean as a host because i know their servers with ssd’s are pretty powerful and cheap compared to AWS where you already pay 10$ for a very lowspec vserver not including bandwidth etc. My current setup with 2 instances is around 20$ / month. But after the initial generation of the data i can scale it down to 10$ / month.
Deploy flow


The illustration above roughly describes the what happens after i commit to master. To extend on this, the gitlab ci sends a request to the rancher API to rereference (upgrade) the docker images to the new ones. I use the now CLI to upload the latest build to now.sh.
External storages
As storage engines i opted for mongodb, because i know it can handle a lot of writes per second without breaking a sweat. Mongodb atlas provides free instances with up to 512mb storage. Redis is used to store the blockheight at which the processing currently is. That way i dont need to worry about backups and running additional storage instances.
Gitlab
Its worth the have an own category for gitlab because it positivly suprised me constantly throughout the course of this project. Before this project i was pretty pro Github, but after this project im pretty pro Gitlab for the following reasons:
- Free private repos yes you read right, free private repos, for this project i decided to not release the code open source for now, so the private repo came in handy
- Free CI build-in if you are building a proper deployment workflow there is no way around a CI. The gitlab CI was easy to setup, and works almost like any other CI out there, at times it can be a bit slow / builds get stuck though.
- FREE DOCKER REGISTRY deserves all-caps, sorry not sorry. When i started the project i was sure i would bundle the nodejs with docker, the ugly part about private hosted docker registries is you need to pay for them (google, aws). The gitlab docker-registry is free, fast, didnt make hassle to setup + its easy to push images from your CI to your docker-registry.
Frontend
The frontend was the part where not much was to do, the only requirement was to display an in/out chart for every wallet which is being watched. Data is to be fetched via web-socket. Keep everything event based for future live data updates.
Learnings:
- React Material ui is awesome, its taking care of accessibility and is providing a wide range of ready to use components.
- Create-react-app lets you avoid having to deal with webpack config, just plug and play
- Now.sh is makes it easy to deploy your static SPA for free if you dont have a problem to release the source code publicly.
- Graphjs is easy to use, i wrote a quick wrapper for react, without the animations its also pretty fast
- Websockets are best to be used with observables
Initially i wanted to host the backend also on now.sh, but the free tier version is limiting when it comes to instance counts. For a payed now.sh (15$) i can get plenty of servers on digitalocean and have more freedom.
