
To sleep or not to sleep — Fitbit data analysis
To sleep or not to sleep — Fitbit data analysis
A tiring day does not always lead to better sleep at night! And what you browse through on the internet can also affect your quality of sleep.
I am a fairly fit guy, love playing soccer, going for runs and in general work towards a better lifestyle. I somehow still struggle with managing my sleep at night!
Note: This analysis is based on a limited sample size and might not generalize. It is meant to be a fun read!
Through this blog I merged my sleep, fitness and browsing history to come up with correlations, some of them ‘maybe’ spurious!
I got a new Fitbit Versa in May and since then have been tracking my sleep and exercise pretty much 24/7. I also interned full time over those months and hence had a pretty good schedule without much change.
Weekdays — work
Weekends — Either study or travel
I am a very erratic sleeper though. Some days I sleep for 9 hours and there are some days I hardly sleep. Either due to work or restlessness or because the temperature isn’t right. I wanted to find out the best possible method to ensure a good night’s sleep so that I am fresh the next day!
I extracted my fitbit data from the dashboard online. It has the following columns:
Dataset 1 (Sleep data)
'Start Time', 'End Time', 'Minutes Asleep', 'Minutes Awake', 'Number of Awakenings', 'Time in Bed', 'Minutes REM Sleep', 'Minutes Light Sleep', 'Minutes Deep Sleep'
I annotated the data to add a ‘Date’ column that corresponds to the night of the sleep. If I wake up on 16th September for that row of data, I annotated it as 15th September. So even if I slept before 12 AM or after, it would be marked as 09/15.

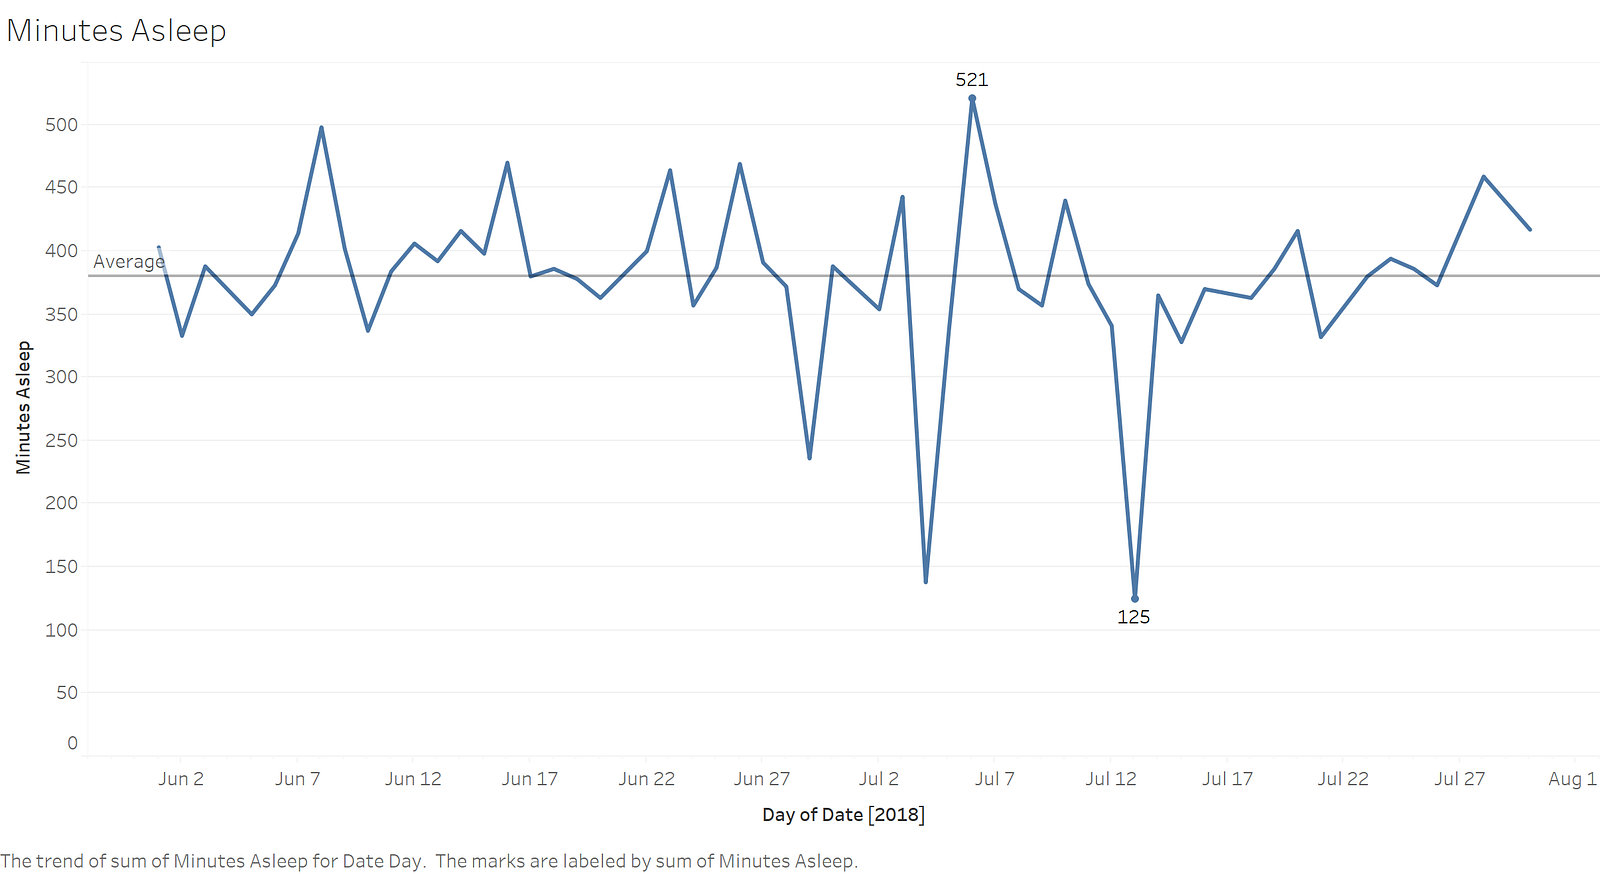
This image gives you an idea of how erratic my sleep is.
My average time asleep is 6.33 hours with a standard deviation of 1.1 hours. Ideally I would like to have a standard deviation below 0.5!
Yes the minimum has been 2 hours 5 minutes! (Thank you Georgia Tech! :D)
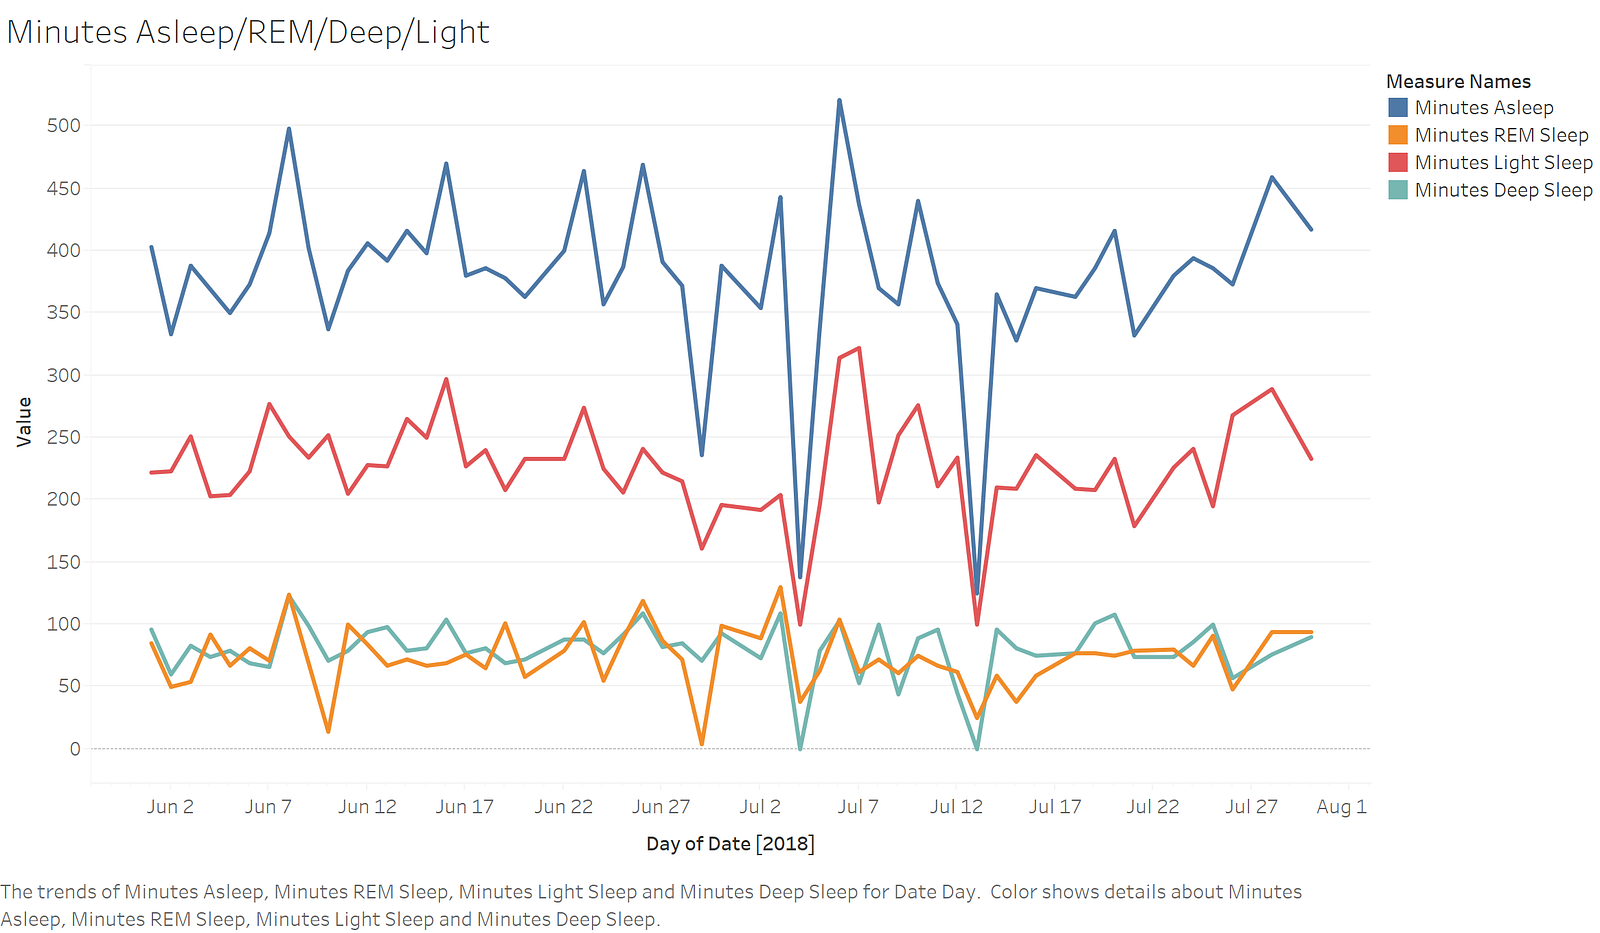
Time in Bed = Minutes Asleep + Minutes Awake
Minutes Asleep = Minutes REM Sleep + Minutes Deep Sleep + Minutes Light Sleep
All these 3 sleep types are pretty positively correlated with minutes asleep.
However even a small change in REM or Deep Sleep can make you grumpy or tired when you wake up.

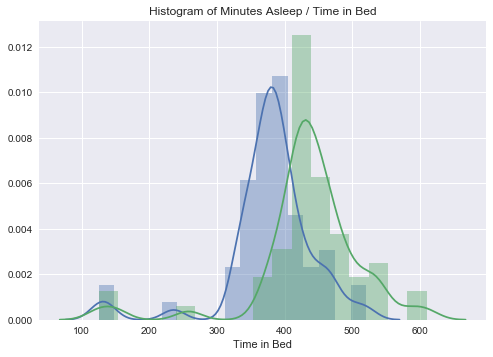
Just to explore a bit more I plotted the histogram of my Minutes Asleep and Time in Bed. Although the distribution seems like it is only shifted, there is some difference in the peak heights, indicating that there is some other factor that causes the relationship to vary between these two variables (thereby leading to changes in Minutes Awake).

The joint plot below between number of awakenings and Time in Bed has a pearson coefficient of 0.74. This might imply that yes there is a strong positive relationship between the Time Spent in Bed vs the Number of Awakenings but that is not the only influencing factor.

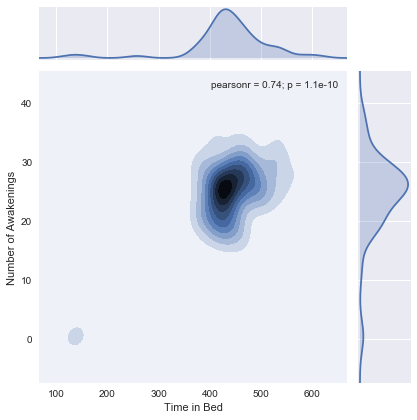
Number of Awakenings might depend on stress or exertion that day or a number of other factors.
Dataset 2 (Fitness activity data)
The most obvious choice was to get in my activity data.
['Date', 'Calories Burned', 'Steps', 'Distance', 'Floors', 'Minutes Sedentary', 'Minutes Lightly Active', 'Minutes Fairly Active', 'Minutes Very Active', 'Activity Calories']
I added variables for day of the week and a weekend flag followed by time shifted variables to capture previous day values for Calories Burned, Steps, Distance, Floors, and all activity features.
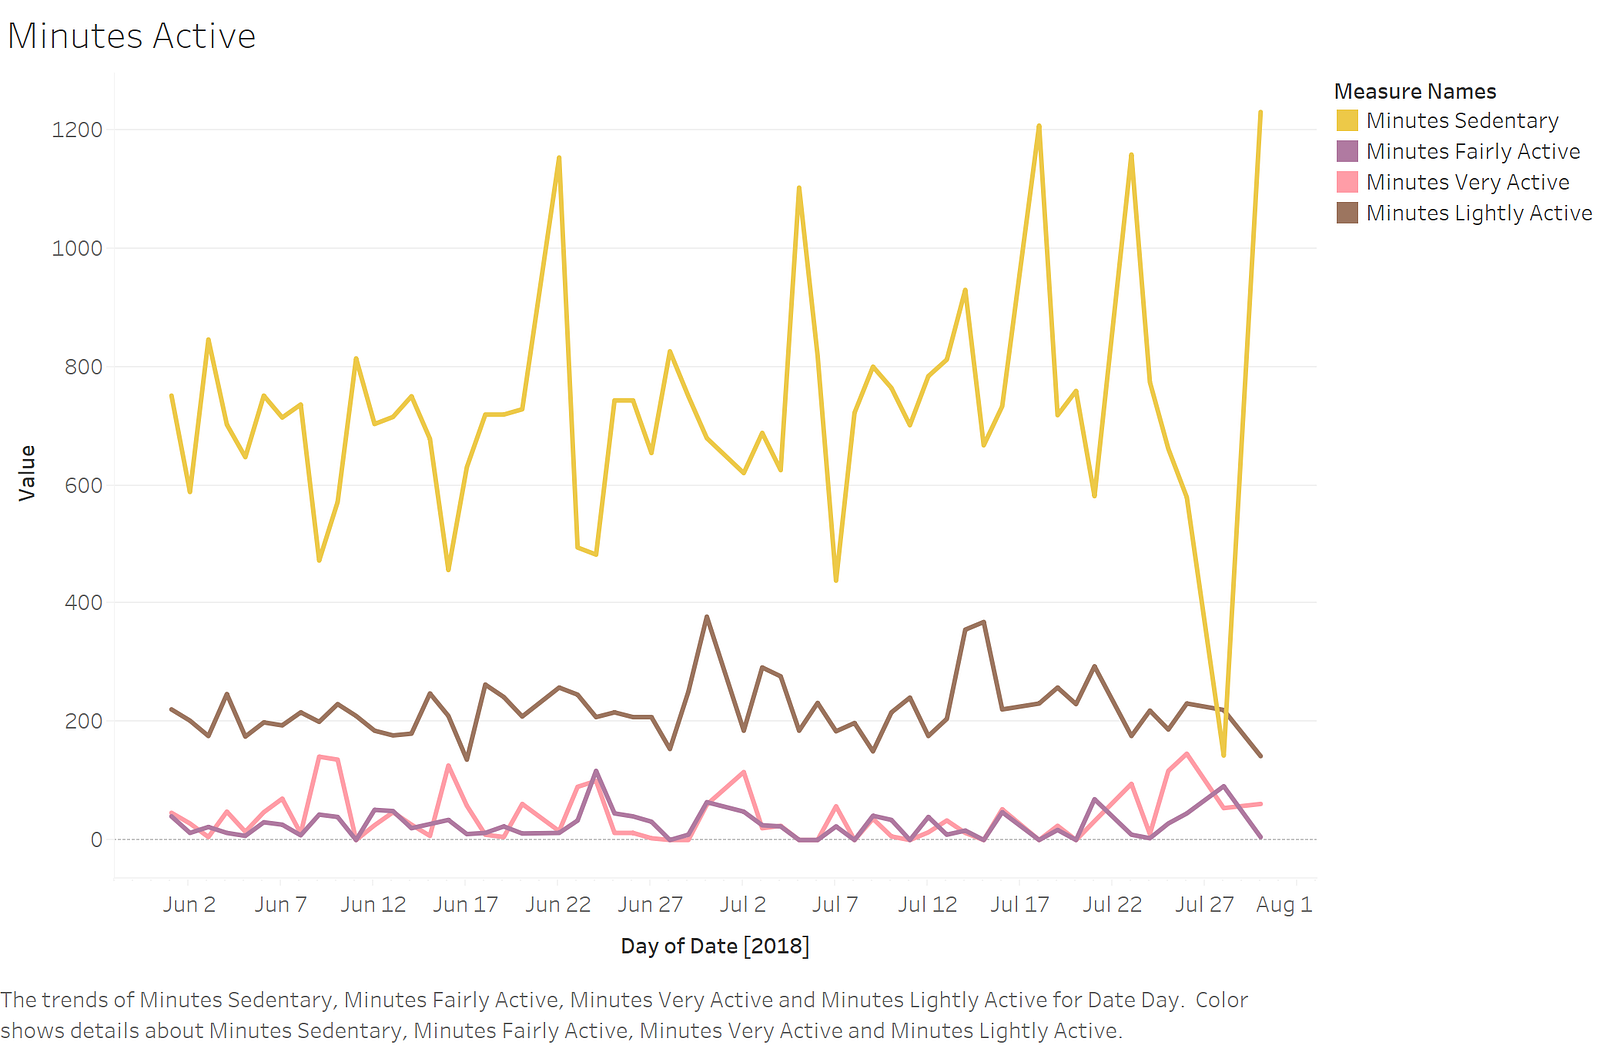
Minutes active are broadly categorized by fitbit as;
Minutes Sedentary, Minutes Lightly Active, Minutes Fairly Active and Minutes Very Active
Unlike sleep data, there is no visual relationship between these 4 categories and you can be very active without having a number of minutes in the fairly active category.
However, if you closely notice, the very active graphs (pink) lags the fairly active (brown) in some cases.

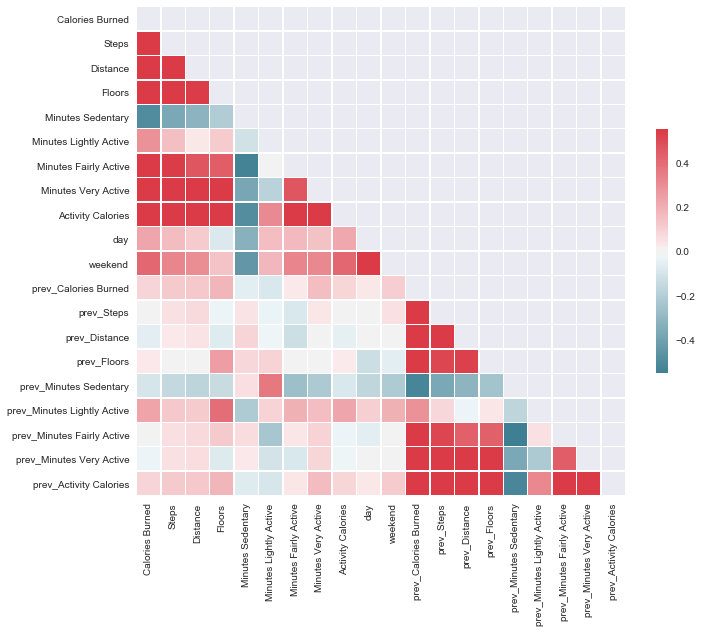
As expected, the weekend flag has a decently high correlation with minutes active. It also has a high negative correlation with Minutes Sedentary, implying that I don’t just spend my weekends the couch. (Sorry Netflix)
An observation I am happy about is that my activity (calories burned or activity calories) is not “highly” correlated (negatively) with my activity on the previous day, implying that I don’t rest just because I went for a run or worked out the previous day.

On combining dataset 1 (sleep) and dataset 2 (fitness), I got some interesting hypothesis.

I had to dig deep to get some pattern out of the data. Yes this is not how analysis should be done, but I really wanted some understanding between my activity and sleep patterns.
- Minutes Lightly active has a negative correlation with Minutes Awake, Number of Awakenings and Time in bed. This implies that I get better quality sleep when I am ‘lightly’ active that day. Furthermore sleep is also better the next night. All this is obviously controlling for other parameters
- Minutes Very Active has a slight positive correlation with Minutes Asleep, Number of Awakenings and Time in bed, both for the current night’s sleep and the next one. This is because high physical exertion (soccer/football and a 5 km run in my case) leads to higher muscle recovery which often kicks you out of sleep phases and you hence sleep longer. This also spills over to the next night!
Dataset 3 (Web-usage data)
I’ve always liked tracking my own usage patterns on chrome and installed a ‘Webtime tracker’ add-in on chrome. This tracked the time spent on each website (in seconds) and stops counting when I am idle for 45 seconds or if I navigate away from the page or if I switch apps.
So time to get this in too!
I split all the websites into 7 categories;
General, Georgia Tech, News, Social Media, Sports, Video Streaming, and Work

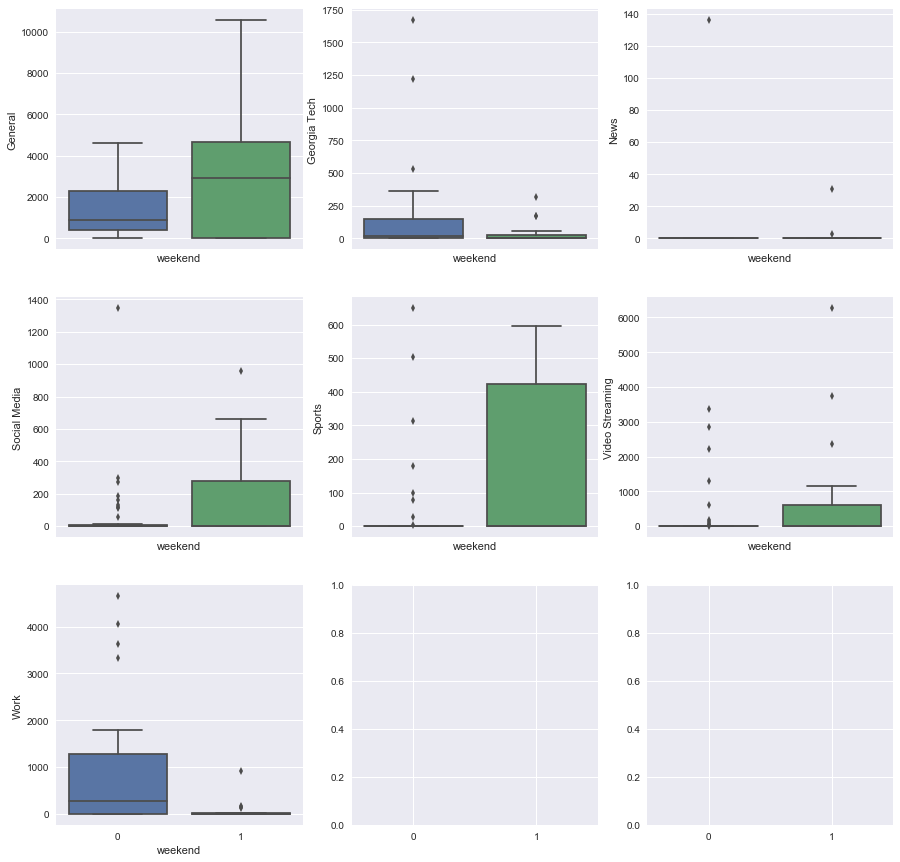
- Georgia Tech related browsing goes on up weekdays, which is surprising since I would have wanted to work on school stuff on the weekend. I guess should change that!
- Social Media is much lower during the week. (Yes I was a diligent intern at work :P)
- Video Streaming and Sports are really high during the weekends. There are sport values that are a bit higher during the week which can be attributed to the ‘World Cup’!
- Finally I never got my work back home and the data doesn't lie (Maybe did a bit on the weekend. Starting and shutting down AWS clusters I guess?)
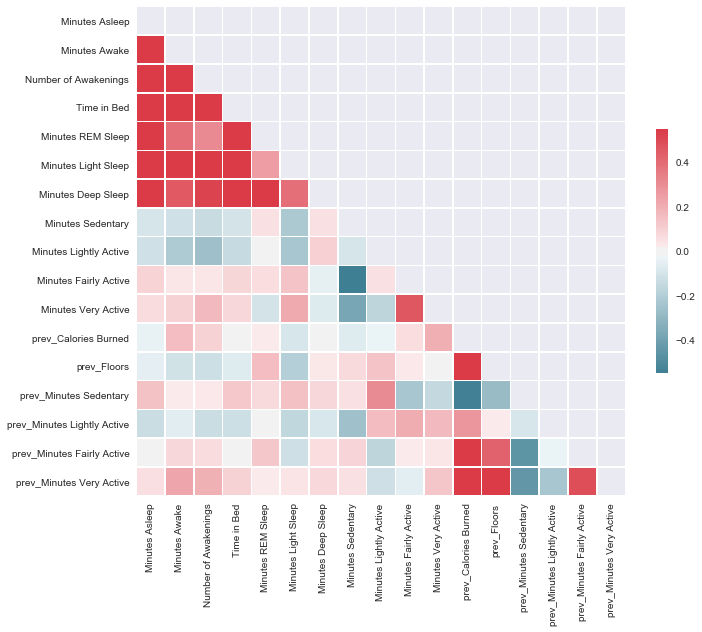
I finally combined all the 3 datasets!
I don’t know why but I like correlation plots a lot. From this one I’d like to point out the relationship between Sports browsing and sleep.

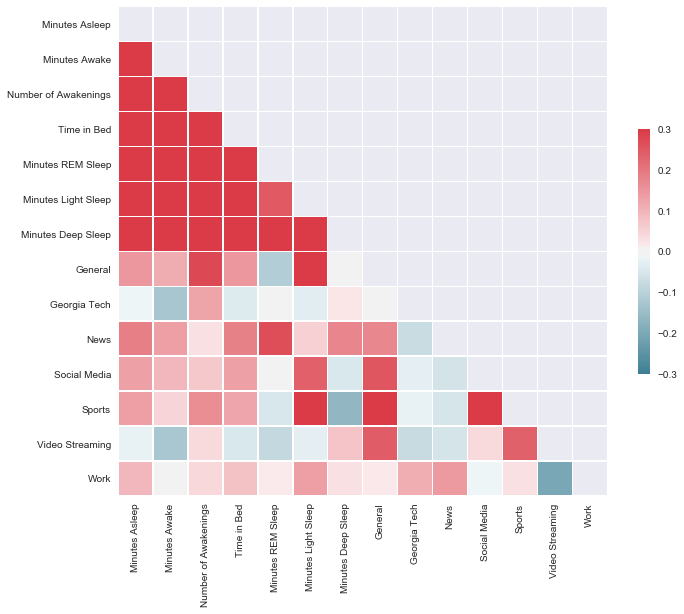
- Sports browsing is negatively correlated with Deep Sleep that night while positively correlated with Light Sleep the same night.
Deep sleep promotes physical recovery and aspects of memory and learning. This stage has also been shown to support your immune system.
Light sleep promotes mental and physical recovery.
This is what the Fitbit website mentions. So does watching more sports lead to more light sleep for mental recovery to get over the stress? I get very involved in football/soccer games (even if Arsenal isn’t playing) and this very well might be true. But then however correlation does not mean causation!
- Less video streaming during work! Yes I am a good employee! (Re-iterating :P)
- So social media in my case has a direct relationship with Minutes Asleep. But there is the inverse relationship between Social Media browsing and Deep Sleep. How does that make sense?
More social media => More sleep => Less deep sleep but more Light sleep (Mental recovery? Interesting..)
Conclusion
- Minutes Fairly Active plays a good role in determining my Minutes Asleep sleep that night. So yes you got to get some fair activity in for a good sleep time!
- Furthermore Minutes Lightly Active both for the current day and the previous play a good role in determining sleep at night. If you have a day with less light activity you your sleep time can be lesser! But you’ll still have Deep Sleep Time based on your activity the previous day
- Distance is high during the days I run to Piedmont and/or play soccer. This often results in a lot of exertion (increase in fairly active and very active minutes). Also distance is higher during work days since I walk quite a bit to and from work. Distance covered during the previous day also affects sleep for the current day. Hence physical exertion is not completely overcome in a night’s sleep!
- Minutes Very active is has an inverse effect on sleep quality, which means that it is not good to exert yourself a lot. Over exertion often leads to inconsistent physical recovery during sleep and you tend to wake up a lot more at night. Deep Sleep might increase but at the cost of REM. And when REM is inconsistent you tend you wake up. More often than not Deep Sleep will decrease that night and you will feel groggy the next morning. However sleep the following night is more important and that’s where your physical recovery will take place
- Surprisingly (or not) Georgia Tech scores high on that list, implying that if I have school work, I sleep lesser and wake up a lot more during the night (the correlation chart seconds this). I don’t know why. Maybe grad school IS stressful!
I hope that through this I am at least able to reduce my standard deviation of Minutes asleep at night and have a better and more consistent sleep schedule!