
Clustering electricity usage profiles with K-means
As we can see, K-means found three unique groups of load-profiles.
The green cluster contains loads that maintain a steady use of energy throughout the afternoon. Maybe these are days where the occupants stayed at home, like weekends and special dates.
The blue cluster has a high peak in the morning, a decline in usage during the afternoon and high again at night. This pattern seems to fit business days when occupants leave for work and/or school.
Finally, the red cluster shows days when consumption is low throughout the whole day. Maybe a case of holidays when only a few appliances are left on?
Validating results with t-SNE
One way we can validate the results of the clustering algorithm is to use a form of dimensionality reduction and plot the points in a 2D plane. Then, we can color them according to the cluster they belong.
A popular algorithm for this purpose is called t-SNE. The inner workings of the algorithm are beyond the scope of this article, but a very good explanation can be found here.
The thing to keep in mind is that t-SNE doesn’t know anything about the clusters found by K-means.

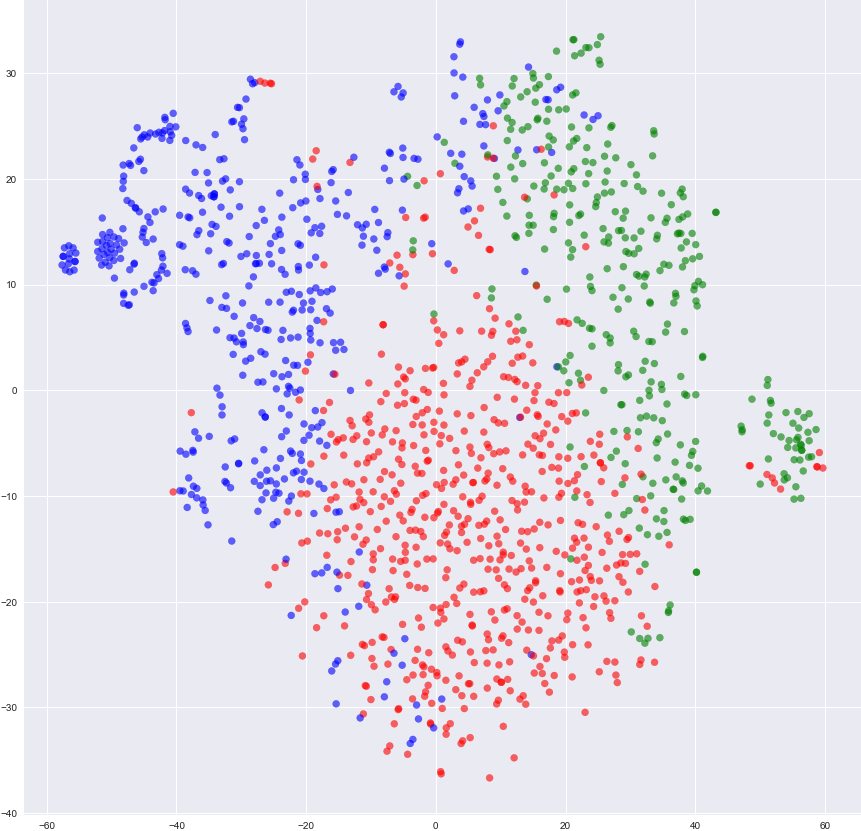
In the above plot, each point represents a daily load-profile. They were reduced from 24 to 2 dimensions. Theoretically, the distance between points in the higher dimensional space was preserved, so points that are close together refer to similar load-profiles. The fact that most blue, red and green points are close together is an indication that the clustering worked well.
Conclusion and further work
This article presented a way to find clusters of electricity usage with the K-means algorithm. We used the silhouette score to find the optimal number of clusters and t-SNE to validate the results.
As for next steps, we could try different clustering algorithms. Scikit-learn has a bunch of them to explore. Some don’t require the choice of the number of clusters to be made a priori.
Another interesting application would be to extend this model to different households and find clusters of similar energy consumption behavior across families.
I hope you enjoyed it! If you have any comments and/or suggestions feel free to contact me.